新型低密度短寿命铈单掺硼硅酸盐玻璃闪烁材料
2023-12-29 15:56张芳铭李建苇刘文星付悦滢季俊杰郭艳艳
发光学报 2023年12期
张芳铭, 李 策, 李建苇, 刘文星,付悦滢, 季俊杰, 郑 涛,4, 郭艳艳,4,5*
(1. 长春理工大学 材料科学与工程学院, 吉林 长春 130012;2. 湖北新华光信息材料有限公司, 湖北 襄阳 441100; 3. 西南技术物理研究所, 四川 成都 610041;4. 长春理工大学 光电功能材料教育部工程研究中心, 吉林 长春 130012;5. 阿卜杜拉国王科技大学 光子学实验室, 沙特阿拉伯 图沃 23955-6900)
1 Introduction
With the rapid development of industrial exploration, high-energy physics research, medical imaging and other technologies, the demand for scintillation materials was continuing increasing and the hot of scintillation materials had last a long time[1-3].Scintillation materials can emit UV or visible light under the radiation of X-ray, γ-ray and other highenergy particles[4-6]. It can conjunct with different photodetectors to realize the detection and analysis of high-energy rays or high-energy particles[7]. Scintillation crystals and scintillation glass were the most widely studied[8-9]. Although the scintillation glass was short of light yield compared with scintillation crystal, but its advantage of shorter decay time was also significant[10]. In addition, scintillation glass also had the advantages of simple preparation process,easy adjustment of components, low cost, high production efficiency, and large size materials, which is expected to become the preferred material to replace scintillation crystal in the civil field[1,8].
In the study of scintillation glass, Ce3+was the most popular activator and it had already been studied in several research[11-16]. Because Ce3+([Xe]4f1)had an allowed parity transition between 4f and 5d electronic configurations[17]. It had a strong absorption in the UV region and gave a strong and broad emission in visible range. The fast decays in the UV and visible range are about 20-50 ns[3,7,11,17-18].Therefore, the interest of scintillation glass research was focused on the scintillation properties study of the Ce3+ions doped in different glass matrix[8,17-20].Among all optical glasses, silicate glass had good thermal stability, low optical loss and greater advantages in strength and hardness because of the main composition ofHowever, the luminescence efficiency of doped rare earth ions was weakened by the high melting temperature of silicate glass[21].The introduction of B2O3in silicate glass will lower the melting temperature. It will also increase the refractive index, concentration of Ce3+ions and transmittance in the UV and visible range which will benefit the scintillation properties of Ce3+ions[22].The most important effects of B2O3are its high resistance to radiation and the possibility of scintillating in low density matrix[3,11]. And the scintillation materials prepared in this work were mainly used in the field of UV excitation, and lower density is conducive to excitation in the field of UV light. Therefore, the choice of borosilicate glass is more appropriate.
Based on the advantages of the borosilicate glass and the good scintillation properties of Ce3+ions, the physical and optical properties of B2O3-SiO2-Al2O3-BaO-Na2O-La2O3(BSA-BNL) were chosen as the substrate. Sb2O3was used as a reducing agent and Ce3+was introduced in the form of CeO2.Firstly, the corresponding molar volume was calculated using the density of samples as well as the Ce3+ion concentration and ion spacing per unit volume were evaluated by molar volume. Secondly, the structure of the glass samples was investigated using FT-IR. Meanwhile, the UV-visible transmission spectra and fluorescence lifetimes were also tested.Finally, the relationship among fluorescence spectra,optical basicity and optical band gap was discussed to explore the application prospects of this scintillation material in the field of detection.
2 Experiment
2.1 Sample Preparation
This experiment was prepared by the melt quenching method with the chemical composition of(60-x)B2O3-6SiO2-3Al2O3-5BaO-15Na2O-10La2O3-1Sb2O3-xCeO2(x=0, 0.3, 0.4, 0.5, 0.6, 0.7), and named C0-C5. Experiments were conducted in using high purity reagents(H3BO3(99.9%), SiO2(99.9%), Al2O3(99.9%), BaCO3(99.9%), Na2CO3(99.9%), La2O3(99.9%), Sb2O3(99.9%), and CeO2(99.9%)). Among them, Sb2O3was used to provide a reducing atmosphere. The raw materials of each sample are weighed(10 g), mixed, and ground. The powder was melted in a corundum crucible at 1 300 ℃ for 1 h. Then it was cast on an iron plate preheated at 200 ℃ and annealed at 50 ℃ for 2 h immediately. After that, it was cooled to room temperature at a rate of 1 ℃/min. The samples were cut and polished for physical and optical test. The shape of optical test samples was 10 mm×10 mm×2 mm. The powder samples were used for FT-IR spectra test.
2.2 Characterizations
The density of the glass samples was tested by Archimedes drainage method using an MD-2014 density tester at room temperature. Each glass sample was measured three times and averaged. Infrared absorption spectra were tested using a Fourier transform infrared spectroscopy manufactured by Perkin Elmer. Absorption and transmittance in UV and visible range were tested by a Perkin Elmer Lambda 950 in the range of 200-800 nm. Excitation and emission spectra were measured using a Shimadzu RF-5301PC type fluorescence spectrometer from Japan. Fluorescence lifetime was measured using a Fluo Time 300 fluorescence lifetime spectrometer. XPS spectra tests were performed using Thermo-Fisher Nexsa's XPS equipment.
3 Results and Discussion
3.1 Physical Properties
In this experiment, the physical properties of C0-C5 glass samples were listed in Tab. 1, which includes density(ρ), molar volume(Vm), ion concentration per unit volume of Ce(Ni), and average Ce-Ce inter-core distance(ri). The values ofNiandriwere calculated byρandVm, the specific values in Tab. 1 were obtained by Formulas (1) and (2)[23],whereCrepresents CeO2doping concentration:
The trend of density, molar volume, ion concentration, and inter-core distance of C0-C5 glass samples(the value listed in Tab. 1) were plotted according to the increase of CeO2ions, as shown in Fig. 1.First, this borosilicate glass has low density compared with other scintillating materials[3,10]. It can be found that the density and molar volume of C0-C5 glass samples gradually increased gently with the increase of CeO2content. At the same time,Niof Ceincreases continuously with the increase of CeO2content, as well as theridecreases continuously.The change in density can be attributed to the increased CeO2by replacing B2O3of the glass component, which has larger relative molecular mass of CeO2(172.11 g/mol) compared with that of B2O3(69.62 g/mol). Additionally, based on the Pauling’s rules in crystal chemistry for the ionic structure architecture the Ce3+should be six-coordinated by O2-(=0.649<0.732)[24]. In other words, the introduced Ce3+ions will enter the network gap but not destroy the glass network structure. It also gave a possibility of increased density obviously(2.07%),which exceed the change of CeO2concentration(0.7%). Considering the error, the range of density change indicates that the influence of introduced CeO2on glass structure is mild. And it can be also observed from Fig. 1 that the molar volume also rises slightly(4.95%) which can be ascribed to the increased CeO2. As we all know that the Ce3+ions have larger atomic number (Z=58) and the Ce3+ions enter the space of network, thus the introduced CeO2will lead to an increase in density. The molar volume and the density are proportionally increased.But the slope of density is larger than the molar volume. It predicts a slightly loose glass structure, likely due to the introduced CeO2. This phenomenon can be identified by the FT-IR spectra.
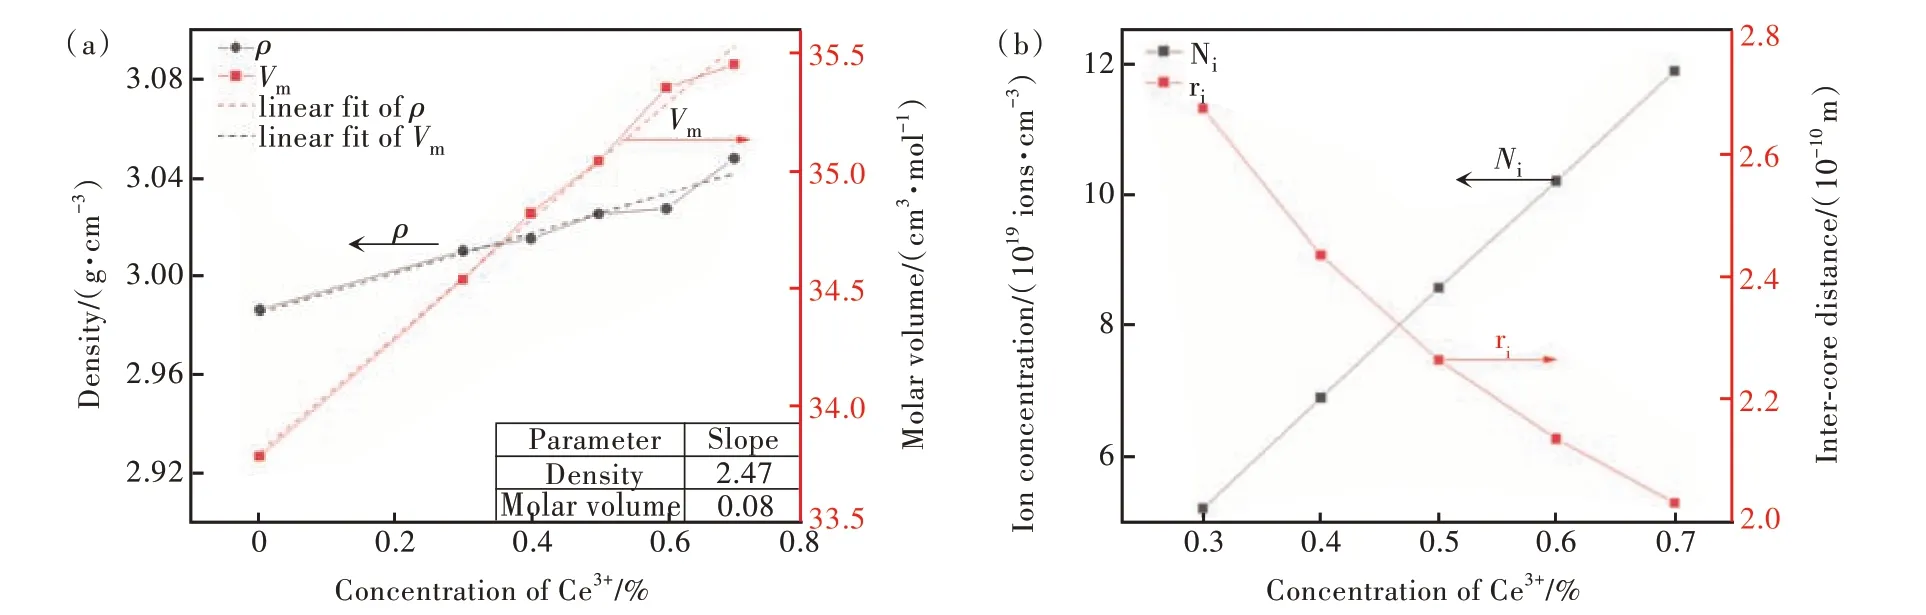
Fig.1 (a)Density(ρ) and molar volume(Vm) trends of glass samples,inset table shows the linear fit slope of density and molar volume. (b)Ion concentration(Ni) and inter-core distance(ri) trends of glass samples

Tab.1 Relevant physical parameters of C0-C5 glass samples
In the borosilicate glass system, CeO2exists as network modifier and the Ce—O bond has strong ionicity and the oxygen ion is easy to be separated from the cation[24]. It was a free oxygen provider. Secondly,because of the large ionic radius of Ce3+ions the introduced Ce3+ions will also play the role of breaking the network. Meanwhile, the increase of CeO2content will decrease the optical band gap which can be confirmed by the changed absorption band[25]. The smallestriis about 0.2 nm, which is larger than the cation radius of Ce3+(0.091 nm), predicting an enhanced spectra properties and less probability of cluster.
3.2 XRD Spectra
XRD is an important means to analyze the crystal field structure in the study of amorphous glass materials. In our work , the peaks of C0-C5 glass samples in XRD tests were basically the same. Combined with the analysis of emission spectra in 3.7 part, the C4 glass sample has the highest luminous intensity. Therefore, XRD spectrum of C4 glass sample was selected for analysis(as shown in Fig. 2). As can be seen from the Fig. 2, there was “steamed bun peak” and no sharp objects were found. It showed obvious amorphous characteristics, which confirm the existence of amorphous properties and long-range structure disorder in the glass. The borosilicate glass system doped with CeO2showed an ideal glassy state.
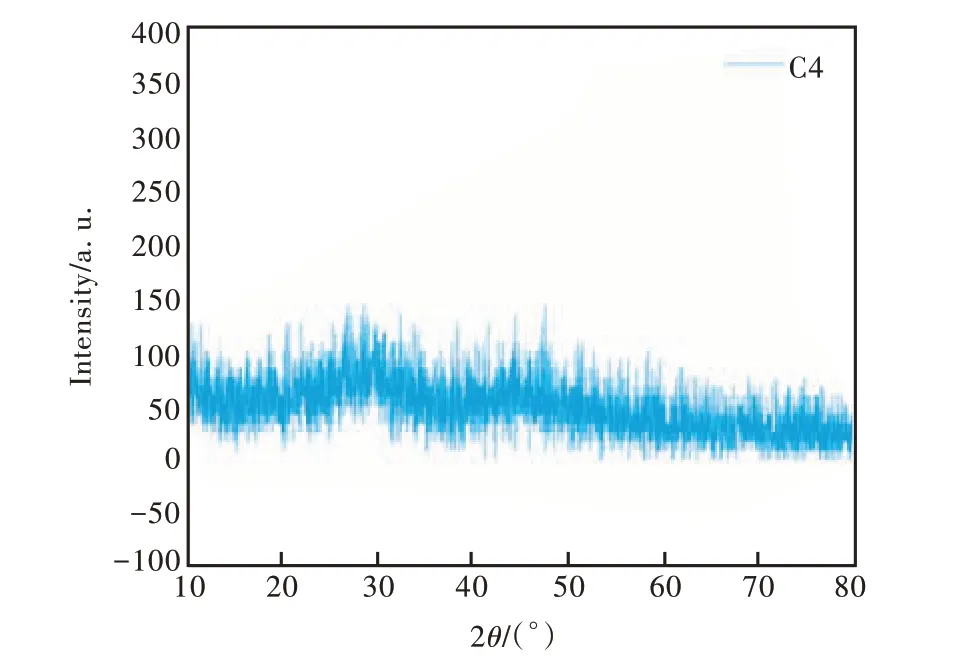
Fig.2 XRD spectrum of C4 glass sample
3.3 FT-IR Spectra
The network structure of the glass samples was investigated using FT-IR. The composition of CeO2was the mainly change in our work which exists as a network modifier and has less effect on the network structure in the glass samples. So, the infrared absorption spectra of C0 and C4 glass samples were selected for comparative analysis as shown in Fig.3(a) and (b) were the infrared absorption spectra of C0 glass sample(=0%) and C4 glass sample(=0.6%), respectively.
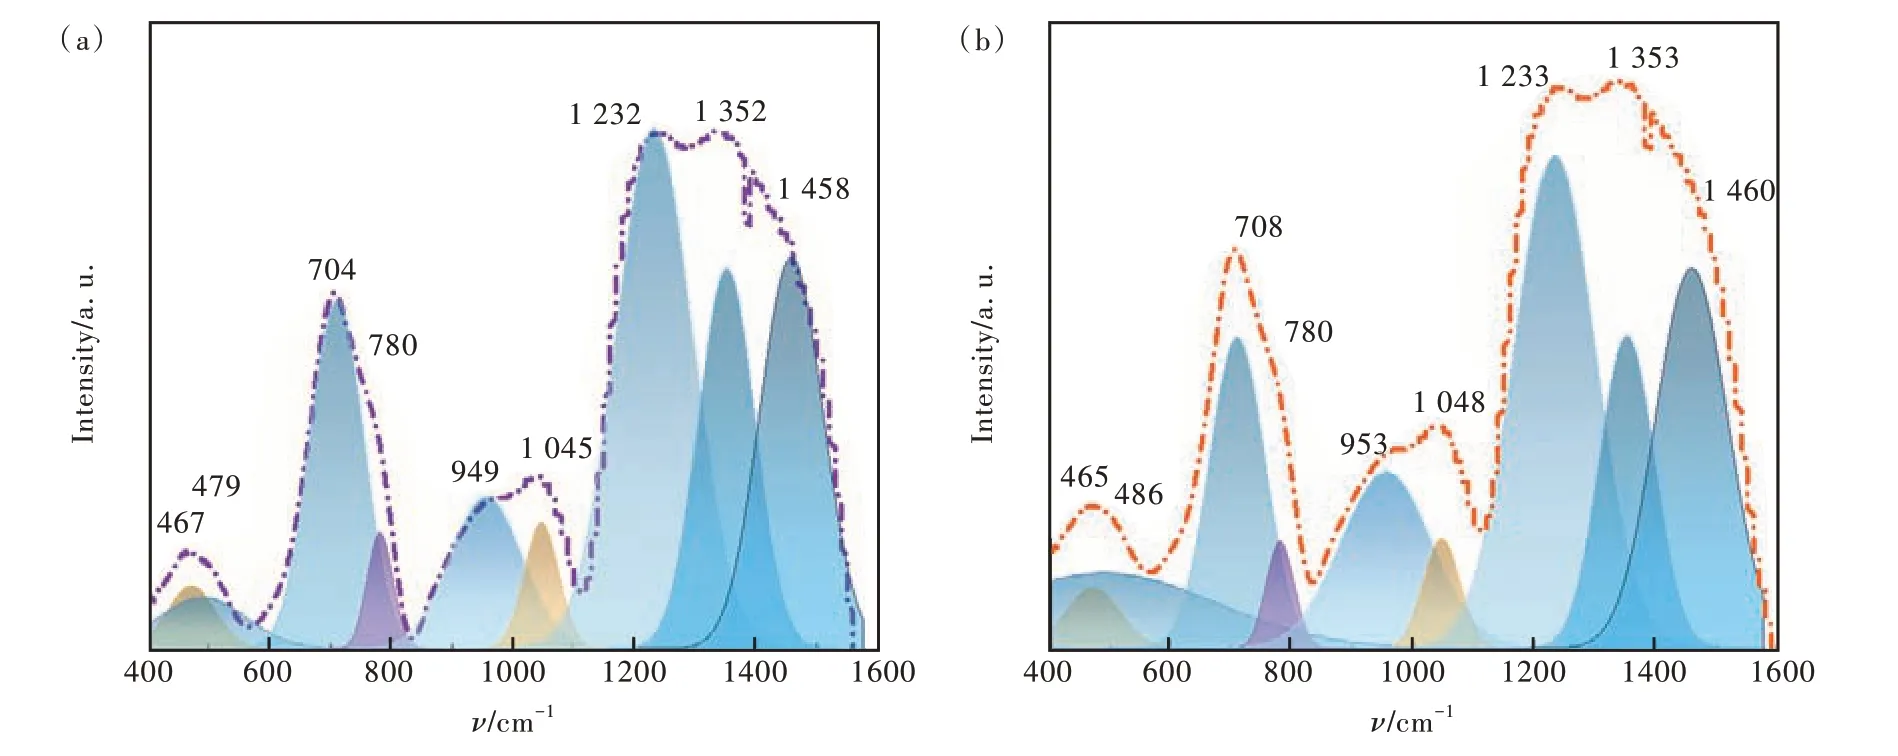
Fig.3 (a)Infrared absorption spectra of C0 glass sample. (b)Infrared absorption spectra of C4 glass sample.

Tab.2 FT-IR absorption peaks of C4 glass samples and the corresponding vibrational modes
From Fig. 3 we can found that both C0 and C4 glass samples contain nine absorption peaks labeled in the figure. The vibration corresponding to each peak was listed in Tab. 2. All peaks in Fig. 3 had been normalizing using Gaussian fitting to distinguish position of the peaks. Based on the comparation of Fig. 3(a) and(b), it was found that the peak position of the glass has no obvious change, indicating that the addition of CeO2has no obvious influence on the network structure of borosilicate glass. It can be concluded that the main structures in this borosilicate glass were [BO3], [BO4] and [SiO4] units[26-29].The introduced CeO2did not generate new detectable vibrations in the samples. One of the reasons that CeO2exists as a network modifier in the samples. The other reason is low concentration of introduced CeO2in all samples. These results were consistent with the above inferences aboutρ,Vm,Niandri.
3.4 XPS Spectra
XPS tests were performed to investigate the oxidation distribution of Ce and the attribution of fluorescence emission. Combined with the analysis of photoluminescence spectra in the following 3.7 part,C4 samples were selected for XPS spectra analysis of complex Ce 3d, and the results were shown in Fig.4.
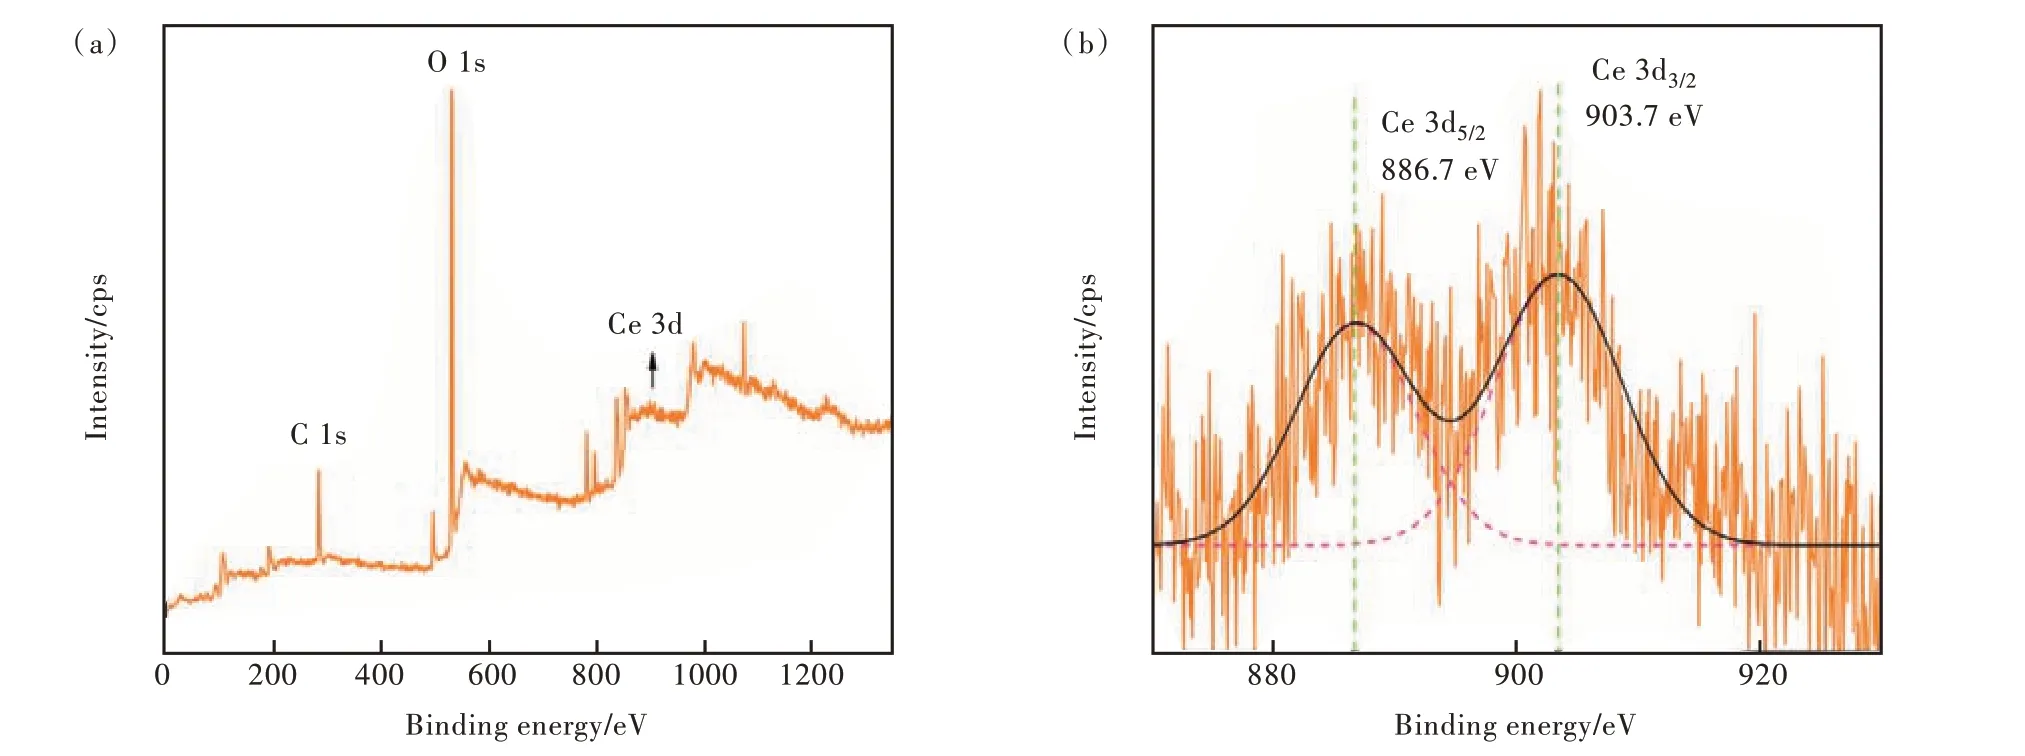
Fig.4 (a)XPS spectrum of C4 glass samples. (b)Locally enlarged image(Ce 3d).
Among them, Fig. 4(a) showed the main elements contained in the C4 sample and valence states. In all samples, Ce exists in the form of Ce3+and Ce4+oxidation states. In order to further explore the relative concentrations of Ce3+/Ce4+, a local magnification diagram was drawn(as shown in Fig. 4 (b)).It can be seen from Fig. 4(b) that the binding energies corresponding to Ce4+and Ce3+are 886.7 eV and 903.7 eV, respectively[32-33].
The relative concentration of Ce3+/4+and (Ce3++Ce4+) in Ce ions can be calculated by the ratio of the peak area(ACe3+/4+) to all the peak areas(ACe3++ACe4+)[34]. From the analysis of fitting results in Tab. 3, it can be calculated that the relative concentration of Ce3+/Ce4+in C4 sample is 1.283. It can be shown that Ce in the sample mainly exists in the form of Ce3+. Combined with the emission spectra analysis in 3.7 part, it was further demonstrated that Ce3+is the main ion of fluorescence luminescence.
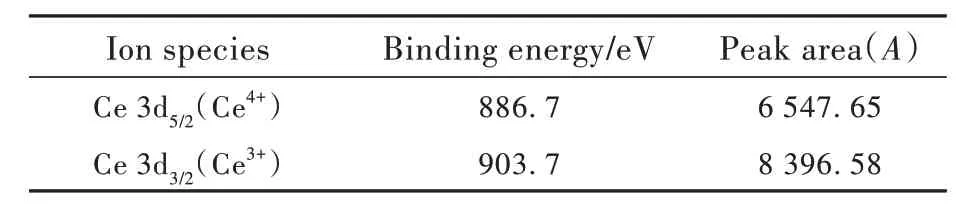
Tab.3 Ce 3d track XPS test fitting results
3.5 Transmission Spectra
The UV-Vis transmission spectra of C0-C5 glass samples with different CeO2contents were shown in Fig. 5(a). The inset figure of Fig. 5(a) is the photo of annealed glass of C4 sample. It was clear that all the samples had good transmission(above 75%). A broad absorption band can be observed in Fig. 5(a), which is due to the electronic transition of the 4f-5d orbital of Ce3+. With the increase of CeO2, there were a clear red-shift of the UV absorption edge. To illustrate it the UV absorption edge part of Fig. 5(a) were enlarged in Fig.5(b). The UV absorption edge of matrix glass (C0)is 320 nm. While that of C1-C5 samples was 331,343, 347, 349,353 nm, respectively. All of them were less than 400 nm which can effectively reduce the generation of self-absorption and is beneficial to the sensitivity of high-energy ray or high-energy particle detection. It was known that the absorption band of Ce4+ions is caused by the charge transfer state from O2-to Ce4+. The charge transfer band of Ce4+ions in oxide glasses was wider than that of Ce3+ions. It can be extended from the far-UV region to the visible region, even up to about 500 nm[35]. With the increase of CeO2, the concentration of Ce4+ions will be increased gradually. It will cause a red shift in the samples[36]. Additionally, the increased CeO2will enlarge the crystal field strength of the glass network structure. Then the energy gap between the 5d and 4f orbits of Ce3+became smaller and it made an easier electrons transition between the 4f and 5d orbits[37]. It also predicts an increased emission spectrum.
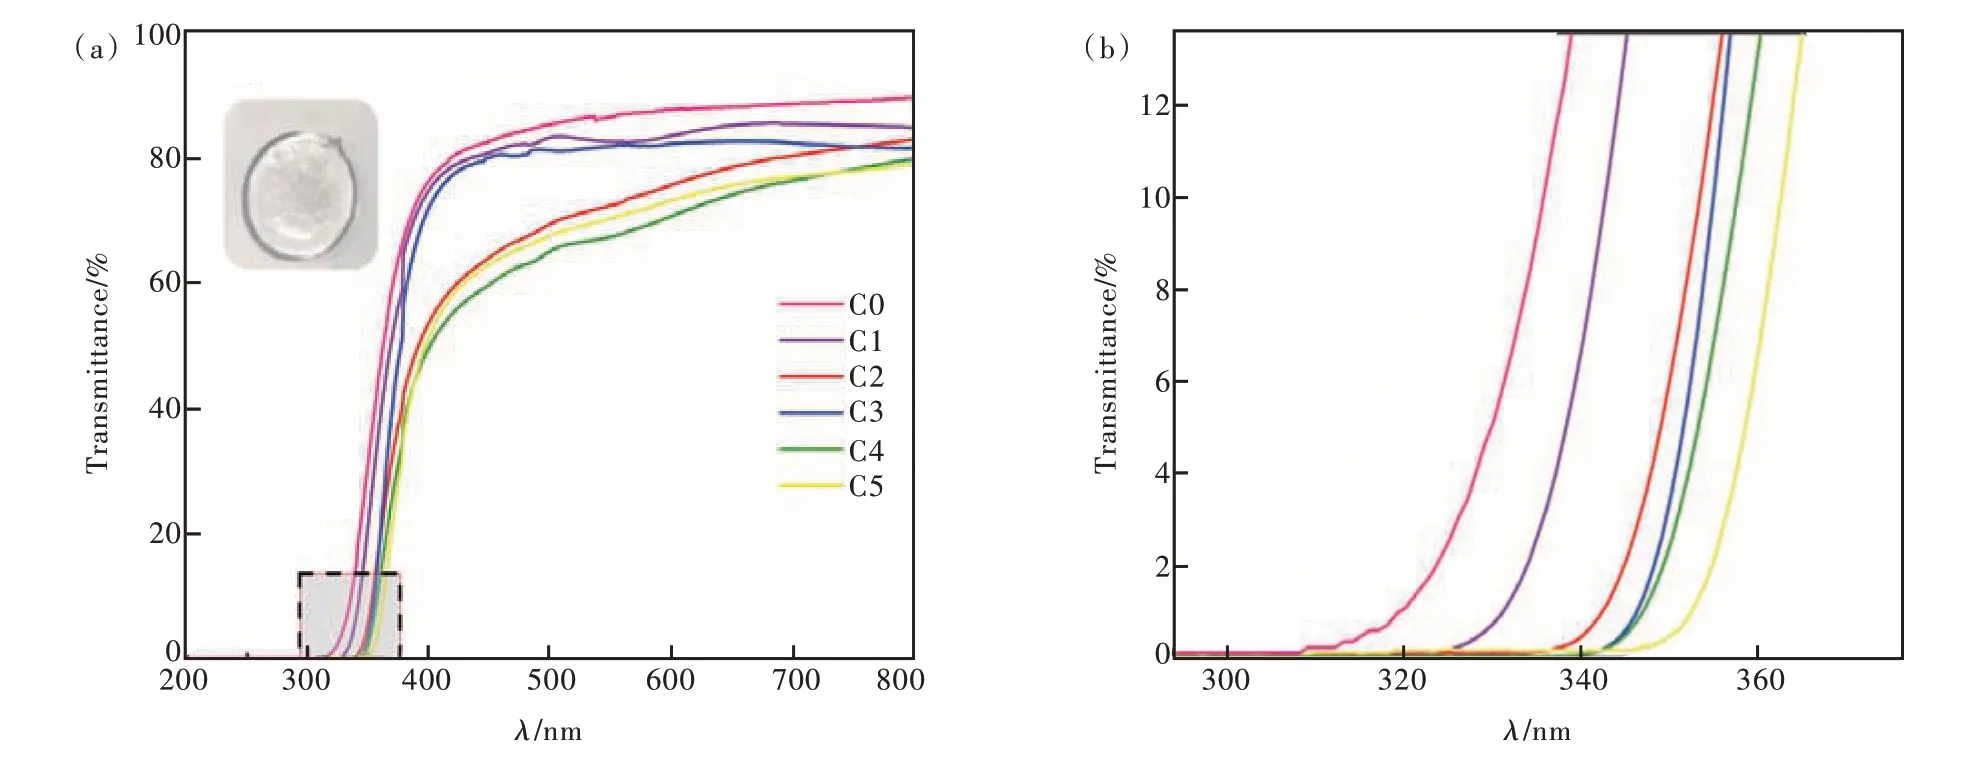
Fig.5 (a)UV-Vis's transmission spectra of C0-C5 glass samples(Inset: diagram of annealed C4 sample). (b)Local enlarged view.

Fig.6 Optical band gap values of C0-C5 glass samples
3.6 Optical Band Gap
Optical band gap(Eg) is an important parameter for predicting the electronic states of crystalline and amorphous solids. The level ofEgcan characterize the size of the band gap of materials, which values the possibility of material as a luminescent host material. TheEgvalue can be calculated by the expression derived independently by Tauc and Mott-Davis[38]. The expression is shown in Formula (3):
whereαis the absorption coefficient,his the plank constant,νis the frequency of the incident photon and the parameterBis the trailing parameter, calculated from the slope of (αhν) relative to (hν-Eg).mis an exponential value describing the transition type, which is allowed indirectly whenm=1/2; whenm=1/3, it means indirect prohibition; whenm=2, indicates direct permission; whenm=3, it means direct prohibition. In this experiment, the prepared glass sample is an amorphous solid, which should be selected indirectly, corresponding tom=1/2. The optical band gap of C0-C5 glass samples was calculated and plotted by absorption spectroscopy. The indirect band gap was represented by (αhν)1/2, as shown in Fig. 6. The specific optical band gapEgvalues were listed in Tab.4.
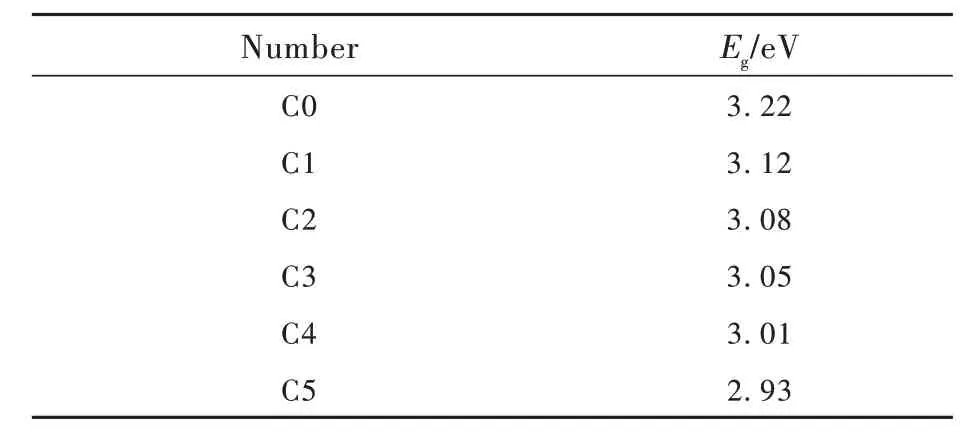
Tab.4 Optical band gap values of C0-C5 glass samples
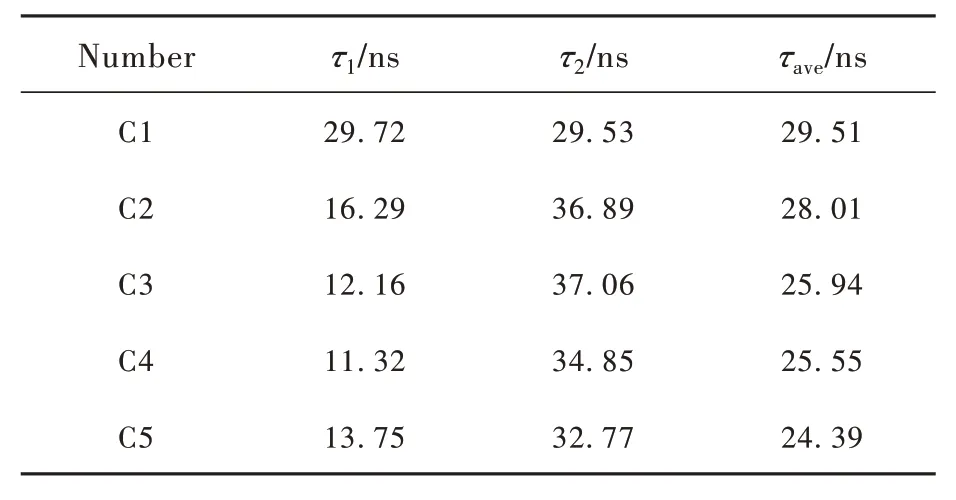
Tab.5 Decay time of each index component and the average decay time of C1-C5 glass samples
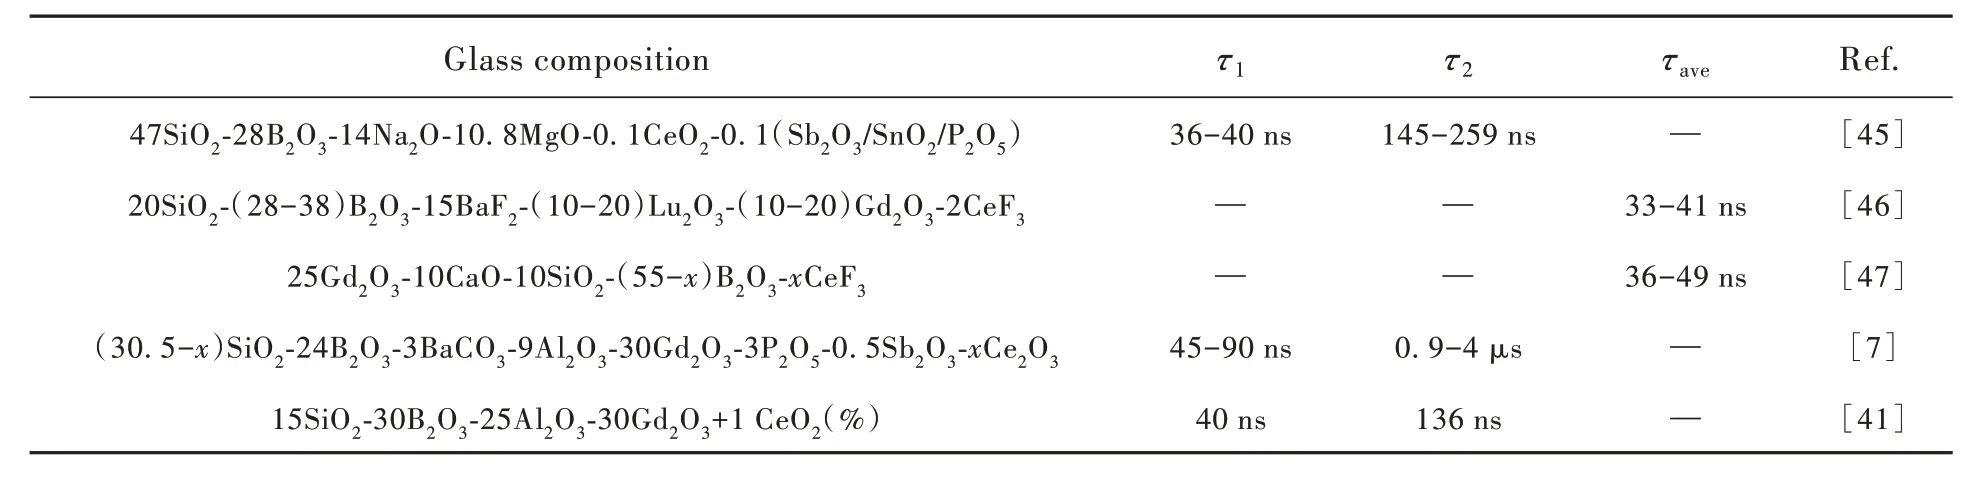
Tab.6 Literature review on cerium-doped borosilicate glasses: glass composition, decay time and respective reference sources
Combining the specific values ofEgin Tab. 4 with the variation trend in Fig. 6, it can be obtained that the indirect band gap of C0-C5 glass samples gradually decreases from 3.22 eV to 2.93 eV with the increase of CeO2content. It was beneficial to the emission of CeO2[39].
Additionally, we all know that the decrease of the optical band gap means an increase in the number of non-bridging oxygen[40]. The increase in the amount of non-bridging oxygen leads to an increase in the negative load around the Ce ion, thus improving the optical basicity. The bonding strength of nonbridged oxygen is less than that of bridged oxygen with excited electrons, which results in less transition energy through optical band gap. In addition,since the optical band gap of the glass system decreases with the increase of the average atomic number, the atomic number of Ce3+is higher than that of B3+, and the outermost electrons of Ce3+are more active and less bound than those of B3+, thus making the glass system more active and more beneficial to the occurrence of optical band gap transition.
But the FT-IR spectra did not show an obvious change on the spectra of non-bridging oxygen. In our opinion, these results can be ascribed to the low concentration of CeO2. And the introduced CeO2will provide free oxygen. So, the values ofEgwere decreased by the increase of CeO2.
3.7 Photoluminescence Spectra
The excitation and emission spectra of the glass samples were tested and the spectra of C4 sample with 0.6% doped CeO2were selected for showing in Fig. 7 for example. The excitation spectra of Ce3+was composed of an asymmetric broadband. At the measuring wavelength of 370 nm, the maximum excitation spectra were 306 nm corresponding to the 4f→5d transition of Ce3+. A strong broadband luminescence of Ce3+was also shown in the emission spectra corresponding to the transition from 5d state to 4f ground state under 306 nm UV excitation. The maximum emission wavelength was about 370 nm, and the Stokes shift was 64 nm. It can be evaluated that the Ce3+in our samples has a [Xe] 4f1electronic configuration with a large full width of half maximum(FWHM) of emission peak(about 68.28 nm). It indicated that environment of the crystal field has a significant effect on the electronic configuration of the Ce3+5d energy level. It resulted to a relatively wide energy level splitting. So, the emission spectra of Ce3+can be observed to be non-uniform broadening from Fig.7.
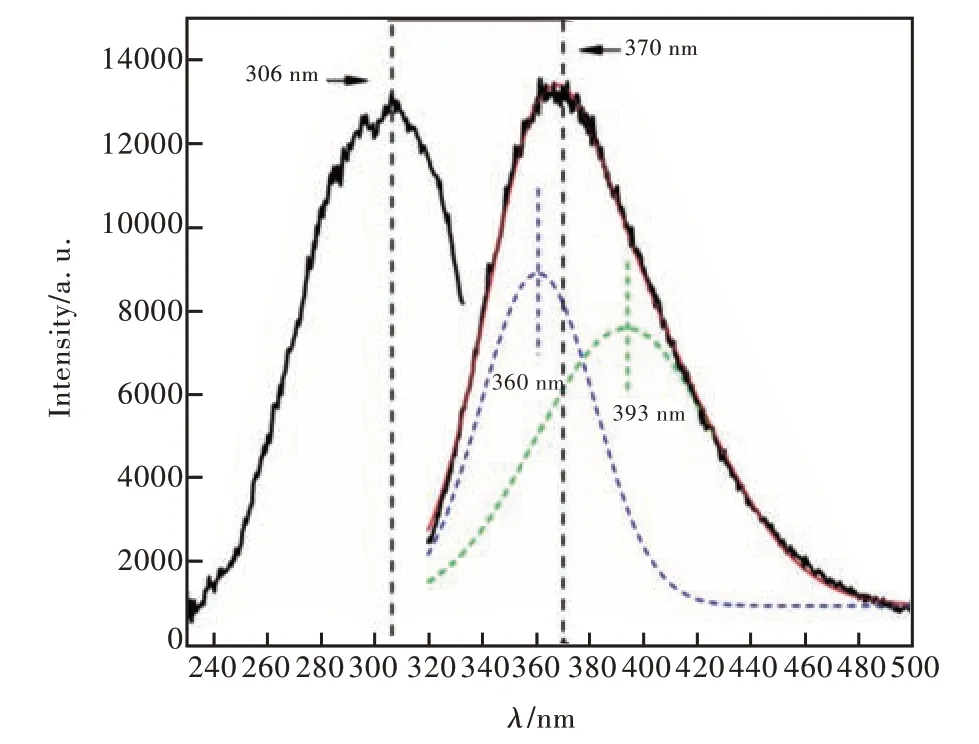
Fig.7 Excitation and emission spectra of C4 glass sample
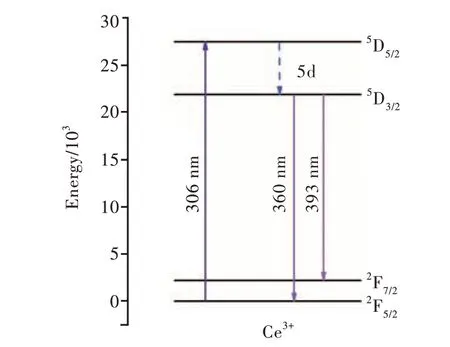
Fig.8 Ce3+ energy level transition diagram
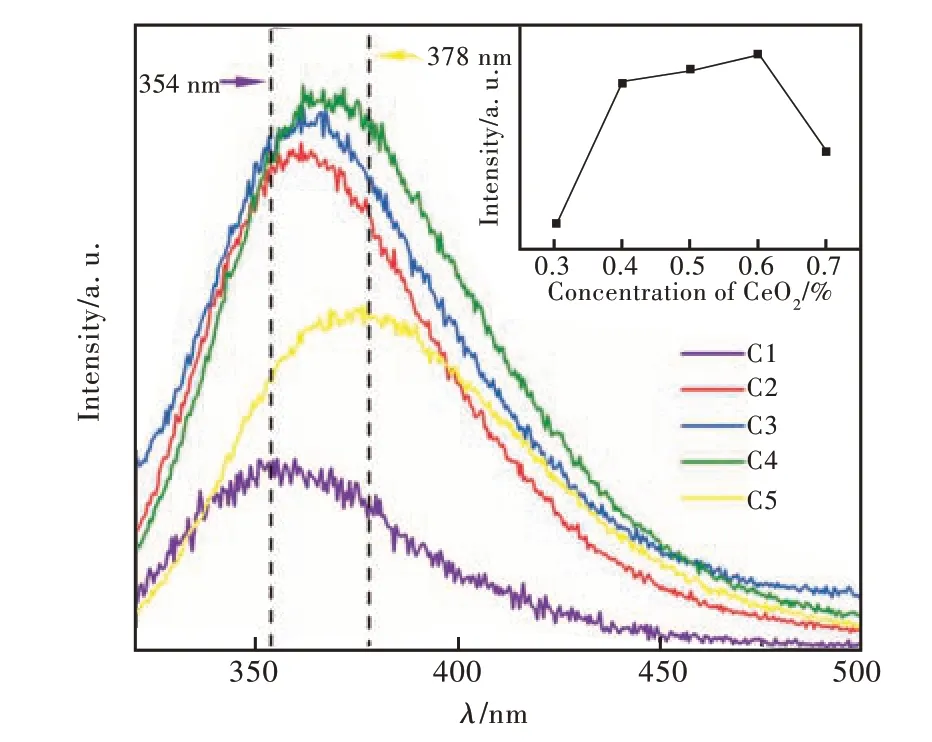
Fig.9 Emission spectra of C1-C5 glass samples
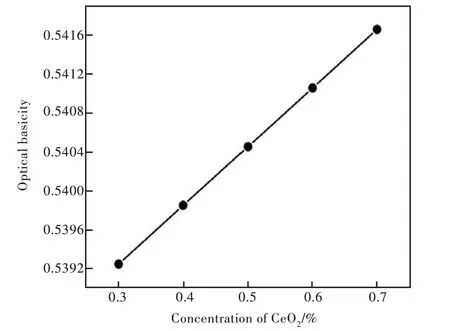
Fig.10 Variation trend of optical basicity under different CeO2 contents

Fig.11 Fluorescence lifetime of C1-C5 glass samples
The nonlinear curve fitting of emission spectra is carried out by Gauss model. It can be observed that the emission of Ce3+came from two transitions,namely5D3/2→2F5/2transition and5D3/2→2F7/2transition, respectively. They can be ascribed to the corresponding emission peaks at 360 nm and 393 nm, respectively[21]. The ground state of the Ce3+ion is a doublet (2F5/2and2F7/2) as diagrammatically shown in Fig. 8. The double characteristics of the emission bands may be due to the lack of specific symmetries or long-range periodicity in the glass, causing the active ions to experience a random distribution of local fields. This results in a large random variation in the position occupied by a single 4f ion, which is also one of the reasons for the uneven broadening of the emission spectra of Ce3+.
To evaluate the effect on emission spectra caused by the increased CeO2, the emission spectra of C1-C5 glass samples were shown in Fig. 9 with an excitation wavelength at 306 nm. The dotted line in the upper right corner of Fig. 9 showed the change of luminescence intensity with CeO2content. It can be observed that the luminescence intensity gradually increases with the increase of CeO2content until the concentration of CeO2is 0.6%(C4). When the doping concentration of CeO2is 0.6%(C4), the luminescence intensity was the highest. When the content of CeO2continued to increase, the luminescence intensity was decreased. There are two main reasons. Firstly, with the increase of CeO2content the concentration of Ce4+and Ce3+ions increased at the same time with the constant concentration of Sb2O3. The content of Sb2O3is certain in our sample. With the continuous increase of CeO2content,Sb2O3cannot satisfy the need for reducibility. More CeO2will be exist in the form of Ce4+ions with non-luminescent. As we all know that the exist of Ce4+ions were harm to the emission of Ce3+ions[35]. So, the emission of CeO2doped glass sample will not vary linearly with the increase of CeO2. It can be identified by the inner figure of Fig. 9. Secondly, according to the principle of interaction between electric dipoles, the cross-relaxation probability is inversely proportional to the distance between adjacent activated ions. According to the study of Ce ion concentration and Ce-Ce ion spacing in unit volume in 3.1 part, it can be found that when the content of CeO2increased gradually, the concentration of Ce ions in unit volume was increased gradually. The distance between adjacent Ce ions was decreased resulting a stronger effect on Ce3+ions by Ce4+ions. Therefore,the best concentration of CeO2in this borosilicate glass was 0.6%.
It can also be observed from Fig. 9 that the emission peak center was in the range of 354-378 nm, which is mainly caused by the 5d→4f transition of Ce3+ions. The emission peak showed an obvious red shift. Combined with the analysis of the optical band gap in 3.6 part, the non-bridged oxygen will provide negative charges which were located between the inner core of Ce3+and the 4f orbit. These gap negative charges can shield the electrostatic attraction between the nucleus and the 4f orbit and short the energy gap of 4f-5d. Therefore, with the increase of CeO2content, the emission spectra of Ce3+under the 5d→4f transition gradually releases photons with longer wavelengths[41].
In addition, the change of optical basicity is also one of the important factors affecting the red shift of emission spectra[40,42-43]. The optical basicity of glass refers to the ability of oxygen atoms to contribute electrons, which is a characterization method of the electron cloud expansion effect. It can reflect its optical properties and chemical structure. The calculation of the theoretical optical basicity can be obtained by the following Formula (4)[43]:
among them,AOa/2andBOb/2represent single oxides,CFcandDFdrepresent fluorides;ɑ,b,c,dare the charge of cationA,B,C,Drespectively;NA,NB,NC,NDrepresent molar ratios. The parameterγand the single oxide alkalinityΛwere adjusted and the electronegativityχof the elementAwas estimated using the following Formula (5):
the electronegativity of B, Si, Al, Ba, Na, Sb, Ce and La are 2.04, 1.9, 1.61, 0.89, 0.93, 2.05, 1.12 and 1.1, respectively. It can be seen from Fig. 10 that the optical basicity of C1-C5 glass samples varies linearly from 0.539 2 to 0.541 7 with the increase of CeO2contents, which is consistent with the trend of the optical basicity resulted by the increased non-bridge oxygen in 3.6 part. The increased optical basicity indicated that oxygen atoms possess a strong ability of giving electrons and a strong ionicity. It will short the energy gap of 4f-5d further. It will contribute to the red shift in the emission spectra[44].
3.8 Fluorescence Lifetime
Fluorescence lifetime is one of the most important parameters to judge the scintillation properties of materials. In this experiment, the fluorescence lifetime of C1-C5 glass samples doped with different CeO2contents was tested and shown in Fig. 11.From the excitation spectra of Fig. 7, the excitation peak was located at 306 nm. Therefore, the closest 320 nm pumping source was selected as the excitation source to test the fluorescence lifetime of the emission peak at 370 nm. The attenuation curve can be well fitted by the double exponential function.The expression is shown in Formula (6):
among them,I0,A1andA2are represented as the fitting parameter values,tis the time,τ1andτ2are expressed as the decay time of each exponential component. The very short decay time ofτ1belongs to the photon pulse of the diode laser source less than 2 ns, andτ2corresponds to the fast luminescence of Ce3+. The specific average decay time of the glass sample can be calculated by Formula (7):
based on the above Formulas(6) and(7), the specific decay time parameters for C1-C5 glass samples in Tab. 5 can be obtained. The nanosecond scale shows that the 5d-4f transition of Ce3+has a very short fluorescence lifetime. It can be ascribed to the 5d-4f transition of Ce3+ions which is an allowedelectric dipole transition. With the increase of CeO2content, the decay time of the glass sample gradually decreases. Considering the structural changes of our samples with the increase of CeO2, the shorted lifetime can be ascribed to the decreasedriand increased optical basicity.
In Tab. 6, the relative literature on cerium-doped borosilicate glass is described in detail, in which the glass composition, decay time(τ1,τ2,τave) and reference sources are described in detail. Compared with the decay time of C1-C5 glass sample (τ1,τ2,τave)in Tab. 5, it can be concluded that the glass sample prepared in this experiment has ultra short decay time.
Fig. 11 showed that the lifetime reached a relatively identical value in C3, C4 and C5 samples with the increase of the CeO2concentration. Combined with the analysis of excitation and emission spectra of glass samples in 3.7 part, the luminescence intensity of C4 glass samples is the strongest. Extra CeO2will decrease the luminescence intensity which will reduce its application value. In brief, this cerium doped borosilicate glass shows strong potential in high sensitivity detection.
4 Conclusion
In this work, a series of (60-x)B2O3-6SiO2-3Al2O3-5BaO-15Na2O-0La2O3-1Sb2O3-xCeO2(x= 0, 0.3, 0.4,0.5, 0.6, 0.7) glass samples were prepared by melt quenching method. The physical and optical properties were studied.
Firstly, their physical properties were analyzed. It was found that the density and molar volume of the glass samples increased gradually with the increase of CeO2content. At the same time, the ion concentration of Ce in unit volume was also increased, which was negatively correlated with the Ce-Ce ion spacing. Secondly, the FT-IR spectra indicated that the main structure of glass did not change by the introduced CeO2. But the optical band gap calculated by the absorption spectra indicated an increase of non-bridge oxygen, which is coincide with the analysis of optical basicity. All these changes of structure gave provides to the increased emission spectra. Finally, the transmittance of sample was higher than 75%, and the UV absorption edge moves toward the long wavelength less than 400 nm. The excitation and emission spectra of the glass samples determined that the optimal doping amount of CeO2is 0.6%(C4) which has the highest luminescence intensity with a short lifetime(25.55 ns). In summary, this Ce3+doped borosilicate glass material was expected to be the matrix material for the high sensitivity detection.
Response Letter is available for this paper at:http://cjl. lightpublishing. cn/thesisDetails#10.37188/CJL.20230209.
猜你喜欢
中国机械工程(2022年18期)2022-10-08
杭州金融研修学院学报(2021年6期)2021-07-11
北方音乐(2020年23期)2020-12-24
中国机械工程(2019年19期)2019-10-28
中国机械工程(2019年11期)2019-06-13
中国机械工程(2019年4期)2019-03-06
大观(书画家)(2018年6期)2018-07-08
校园英语·上旬(2017年7期)2017-07-13
——以新乡学院为例
行政科学论坛(2016年7期)2016-10-25
中国工程咨询(2015年5期)2015-02-16