基于Eu/Tb/SnO2纳米晶体共掺杂二氧化硅玻璃的三激活剂光致发光自参考光学温度测量
2023-12-29 15:56高延鹏戴能利
发光学报 2023年12期
陈 萍, 高延鹏, 何 勇, 戴能利
(1. 合肥工业大学 材料科学与工程学院, 安徽 合肥 230009;2. 华中科技大学 武汉光电国家研究中心, 湖北 武汉 430074)
1 Introduction
As a fundamental thermodynamic parameter,temperature is highly essential in both science researches and industry applications. Considerable efforts have been put into temperature measurement[1-4]. Among numerous methods for measuring temperature, luminescence-based measurements have aroused interests of researchers because they have merits of quick response, precise resolution,contactless and noninvasive operation[5-7]. All these merits make it possible for measuring temperature in some extremely harsh environments based on fluorescence peak shift, bandwidth, intensity, and lifetime[8-11].
Generally, optical temperature probe includes two basic means by monitoring the temperature-induced changes of single emission or relative emission. Single emission detecting has the drawbacks of dependence on concentrations, pumping power, and some other experimental conditions. Relative emission method is based on different luminescent centers or different energy levels of one luminescent center, which can overcome the shortcomings of single emission method due to its independence on experimental fluctuations[12-15]. Specially, self-referencing optical temperature sensing based on fluorescence intensity ratio(FIR) of rare earth ions(RE)has been widely used for precise temperature sensing, which is one of relative emission method[5,16-18].
Usually, FIR methods are based on two thermal coupled levels(TCL) of RE[9]. The energy gap of TCL is 200-2 000 cm-1, such as2H11/2and4S3/2level of Er3+[9,19]. However, researches have shown that the higher sensitivity of FIR thermometer benefits from a larger energy gap[19-20]. Therefore, the sensitivity is restricted by the small energy gap of TCL. Besides, a small energy gap can lead to inferior signal discriminability due to the overlap of the two fluorescence peaks[21]. In addition, the energy level gap of most RE are non-thermal coupled levels(NTCL), especially for materials doped with more than one RE activator. However, FIR methods based on NTCL have been scarcely studied[9,19,22-23].
Eu/Tb co-doped materials have been widely used for FIR-type temperature measurement due to their distinguished red emission of Eu3+(5D0-7F2transition) and green emission of Tb3+(5D4-7F5transition)[8,14,16,24-26]. In this work, we reported Eu/Tb/SnO2nanocrystals(NCs) co-doped silica glasses for temperature sensing based on NTCL. The hybrid material was synthesized with the same method of our previous work[27-30]. Other than most Eu/Tb co-doped materials, the hybrid here shows not only the characteristic emissions of Eu3+and Tb3+, but also the blue emission of Eu2+(4f65d-8S7/2transition). In that way,the triple-activator photoluminescence(PL) of this hybrid can be used as excellent self-referencing optical temperature thermometer. The FIR method have been carefully studied based on NTCL of the highly efficient triple-activator PL(5D0-7F2transition of Eu3+and 4f65d-8S7/2transition of Eu2+, and5D0-7F2transition of Eu3+and5D4-7F5transition of Tb3+) in a wider range(298-773 K) than most of the Eu/Tb co-doped materials.
2 Experiment
The synthesis processes of Eu/Tb/SnO2NCs codoped silica glasses were described clearly in our previous works with anin-situmethod followed by a heat treatment[27-30]. EuCl3·6H2O(99.99%), TbCl3·6H2O(99.9%), SnCl4·5H2O(99.995%), and deionized water were used as raw materials. Firstly, mesoporous silica glasses with mesopore size around 5-40 nm were immersed into the solutions(as listed in Tab. S1) for about 24 hours. Secondly, the doped glasses were dried in super-clean air for nearly 2 hours. Finally, the dried glasses were sintered in air to 1 000 ℃.
X-ray diffraction(XRD) patterns and micromorphology of the hybrids were collected using X'Pert PRO with Cu Kα radiation(λ=0.154 nm) at scanning speed of 10 degree per minute in the range from 10° to 70° and Tecnai G20 U-Twin Transmission Electron Microscope(TEM). LabRAM HR800 with a cooled CCD detector(He-Ne laser, 325 nm, 0.3 mW) and Edinburgh FLS980 fluorescence spectrometer were used to characterize the PL spectra and the decay curves.
3 Results and Discussion
Fig. 1(a) and Fig. S1 show the XRD patterns of all the samples named in Tab. S1. In all the samples,the diffraction peaks at two-theta angles of 26.6°,33.9°, 37.9°, 51.8° were clearly shown, which corresponded to the crystal planes(110),(101),(200),and (211), respectively, of the tetragonal structure SnO2(refer to ICDD PDF card No. 41-1445)[31-32].The broad amorphous peak at two-theta angles 15°-25° belongs to silica glass matrix. There is no big difference in the crystal peaks with increasing concentration of Tb3+. As shown in Fig. 1(b), the SnO2NCs in silica glass are mostly oval, with size ranging from 5-30 nm. Fig. 1(c) showed one SnO2NC around 15 nm and its TEM mapping images were shown in Fig. 1(d) (overlay), Fig. 1(e) (Sn), Fig.1(f) (Eu), and Fig. 1(g) (Tb). It is clear that most of Sn was distributed in the SnO2NC, with little in the silica glass matrix. Eu and Tb were homogeneously distributed both in the SnO2NC and silica glass matrix. It indicates that more Eu and Tb were in or near the SnO2NC than in the glass matrix.
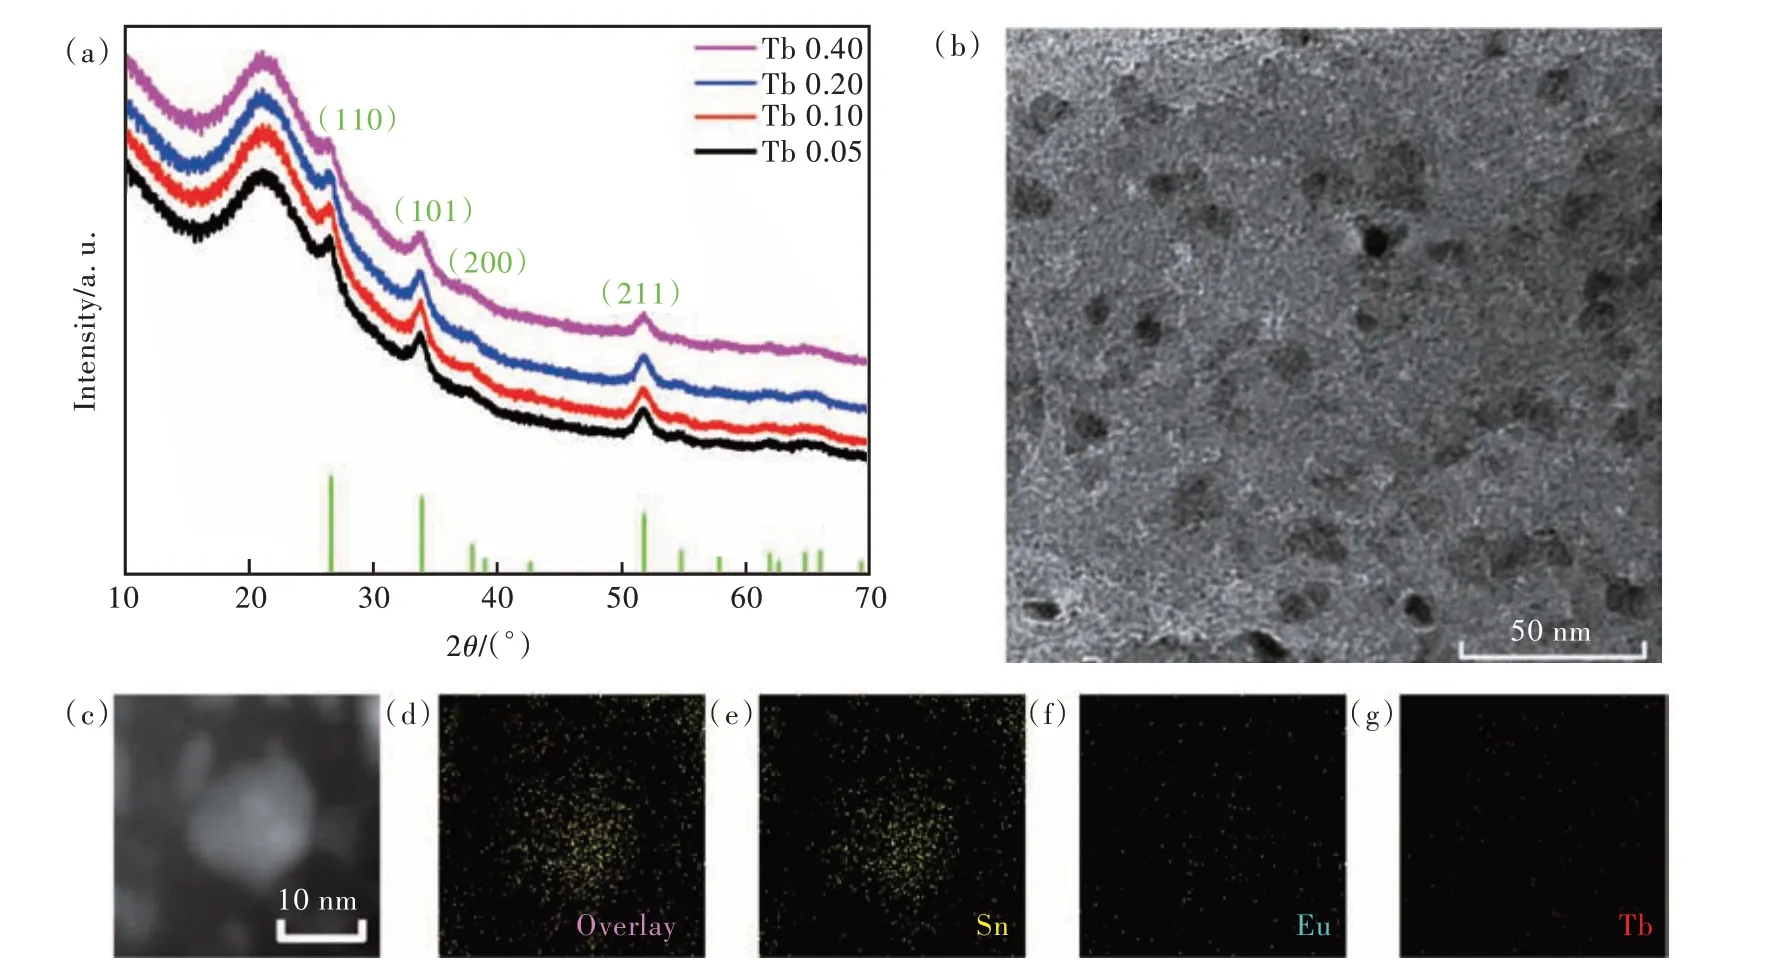
Fig.1 (a)XRD patterns of Eu/Tb/SnO2 NCs co-doped silica glasses with different concentration of Tb3+, named Tb 0.05, Tb 0.10, Tb 0.20, and Tb 0.40, respectively. (b)TEM image of Tb 0.10. (c)-(d)TEM mapping of Tb 0.10(three elements Sn(e), Eu(f), and Tb(g)).
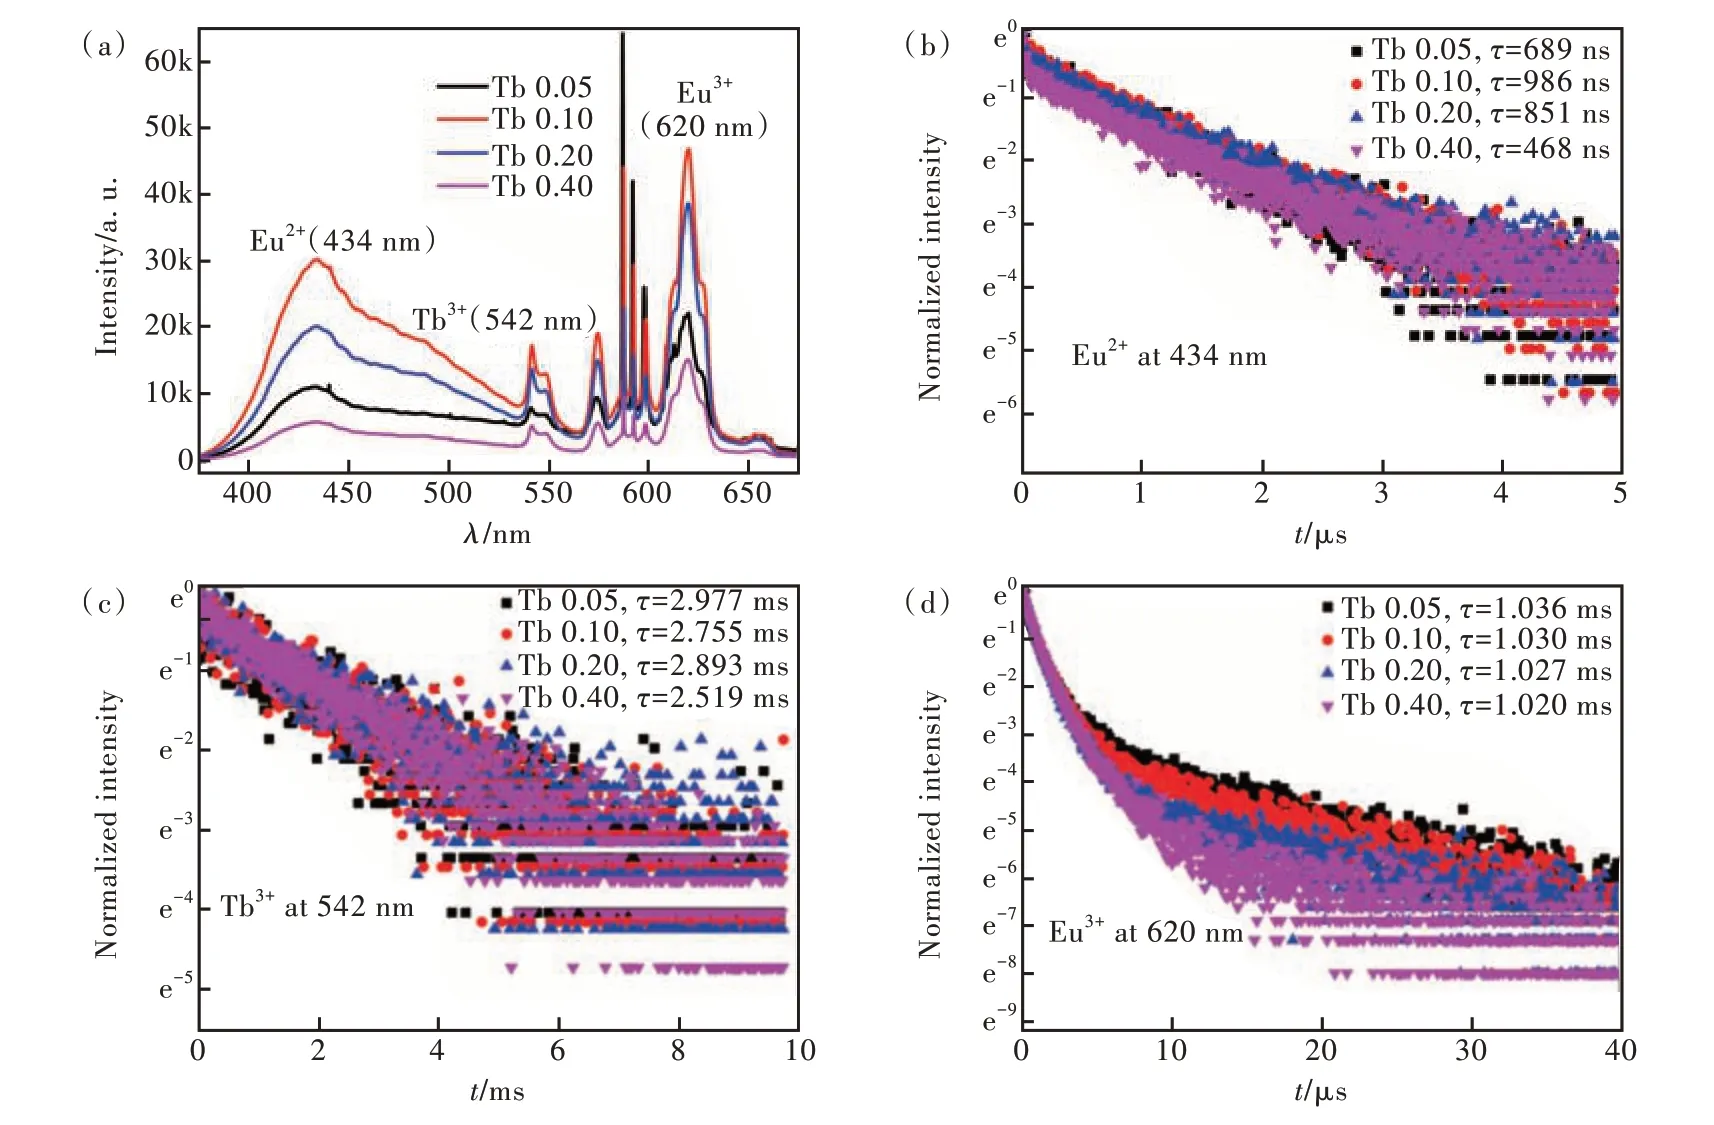
Fig.2 (a)Room temperature PL spectra of Eu/SnO2 NCs co-doped silica glasses with different concentration of Tb3+ excited at 325 nm. PL decay curves of Tb 0.05, Tb 0.10, Tb 0.20, and Tb 0.40 at 434 nm(b), 542 nm(c), and 620 nm(d).
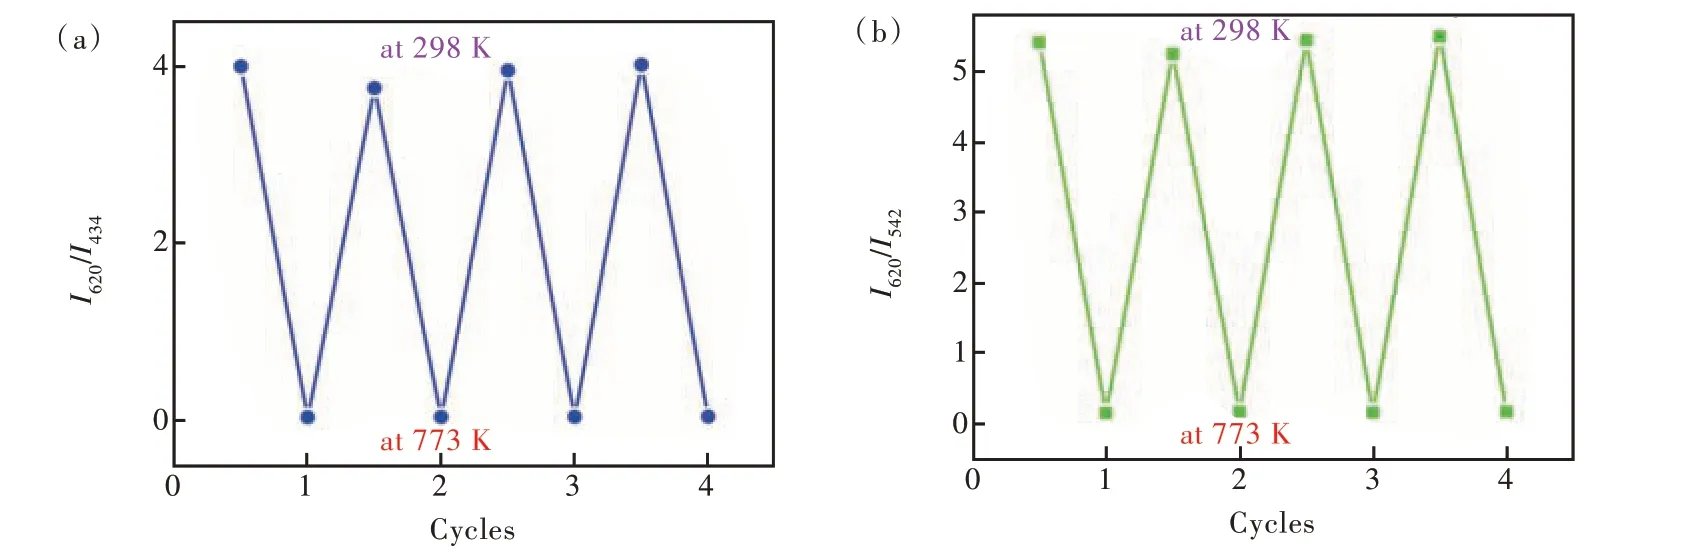
Fig.4 Four cycles of intensity ratio variations measured at 298 K and 773 K of I620/I434(a) and I620/I542(b)
As illustrated in Fig. 2(a), there are several emission peaks centered at 434, 542, 575, 588,620 nm. The emission peaks at 434 nm and 542 nm belong to 4f65d-8S7/2transition of Eu2+and5D4-7F5transition of Tb3+, respectively. The other emission peaks all correspond to Eu3+. From Fig. S2, the emission intensity at 434, 542, 575, 620 nm all increased first and then decreased with the increasing concentration of Tb3+, which reached max at Tb 0.10. The emission intensities of 434, 575, 620 nm increase first because of increased sensitization centers. The emission intensities of 542 nm increase first because of increased luminescent centers. They all decrease with the doping concentration beyond the optimal concentration due to the increase of intra ionic nonradiative relaxation between adjacent RE ions[33].The emission of Eu3+is the strongest while the emission of Tb3+is the weakest in all the samples. Compared to the PL emission spectra of the sample doped without Tb3+in Fig. S3, one can see that the introducing of Tb3+greatly enhanced the emission of Eu2+and decreased the emission of Eu3+at 588,593,598 nm corresponding to5D0-7F1transitions. The strongest peak of Eu3+in silica glasses shifts from5D0-7F1transition to5D0-7F2transition by adding Tb3+.The relative intensities of5D0-7F1and5D0-7F2transitions are typical magnetic and electronic dipole transitions, respectively, which depend strongly on the local symmetry of Eu3+[34].5D0-7F1transition is dominating in a site with inversion symmetry.5D0-7F2transition is the strongest in a site without inversion symmetry. Therefore, the intensities of5D0-7F1transition change with the amount of Tb3+inconsistent with the changes of the peaks at 434, 542, 575, 620 nm might result from the change of the Eu3+site symmetry after co-doping with Tb3+. In Fig. S4, for the sample co-doped with only Tb3+and SnO2NCs, besides the peak at 542 nm, there is also one wide peak centered at 574 nm which belongs to the defect emission of SnO2NCs[28]. From Fig. 2(b), the lifetime of Eu2+at 434 nm followed a similar trend as the PL emission. Compared with Fig. 2(c) and Fig. S5, the lifetime of Tb3+at 542 nm almost followed a decreasing trend with the increasing concentration and the adding of Eu reduced the lifetime of Tb3+from 3.282 ms to 2.755 ms. The lifetime of Eu3+at 620 nm shown in Fig. 2(d) kept almost steady, which is much shorter than the sample doped without Tb3+(2.197 ms)[28].Upon the above results, there might be energy transfer from Tb3+to Eu3+/Eu2+as shown in Fig.S6[35-37].
As there are three different emitters in the Eu/Tb/SnO2NCs co-doped silica glasses, it might be used as self-referencing luminescent thermometer with a FIR method. Therefore, the temperature-dependent PL spectra of Tb 0.10 from 298 K to 773 K were shown in Fig. 3(a). From Fig. S7, the PL intensity at 620 nm diminished quickly with the increase of temperature. The PL intensity at 542 nm also followed a decreasing trend with a much slower speed. While the PL intensity at 434 nm showed slight change in the low temperature range 298-448 K and kept a slow downward trend after 448 K. At 298 K, the intensity of Eu3+is 4 times higher than that of Eu2+, which shows a red colour of the glass.However, the intensity of Eu2+is 22 times more intense than that of Eu3+at 773 K, indicating the dominated emission has shifted from Eu3+to Eu2+in the high temperature range. Besides, the intensity of Tb3+becomes more intense than that of Eu3+after 548 K. It can be seen that Tb 0.10 can be an excellent candidate for ratiometric luminescent thermometers as the intensity shows a T-dependent behaviour and shifts in opposite directions[14]. As shown in Fig. 3(b) and Fig. 3(c), the FIR(RFI) can be concluded as follows[13]:
here theI1andI2are the intensity of PL peak. As a result, the relative thermal sensitivitySrshould be determined as[13]:
the correlation coefficients(R2) of the PL intensity ratios are 99.5% and 99.4% atI620/I434andI620/I542respectively, which indicates that the relationships are well fitted by the functions in the figures inset.TheSris shown in Fig. 3(d), which can be used to evaluate the thermometer’s performance of different materials directly and quantitatively[26,36,38]. TheSrvalues ofI620/I434andI620/I542both increase linearly with temperature and the maximumSrvalues are 2.3%·K-1and 2.1%·K-1at 773 K, respectively.The high maximumSrvalues indicates Tb 0.10 is a potentially excellent luminescent thermometer among inorganic thermometers[15]. Tab.1 shows the overview of the maximalSrof different Eu/Tb co-doped materials, which indicates Tb 0.10 has a wider probing range and higherSrthan most Eu/Tb codoped materials.
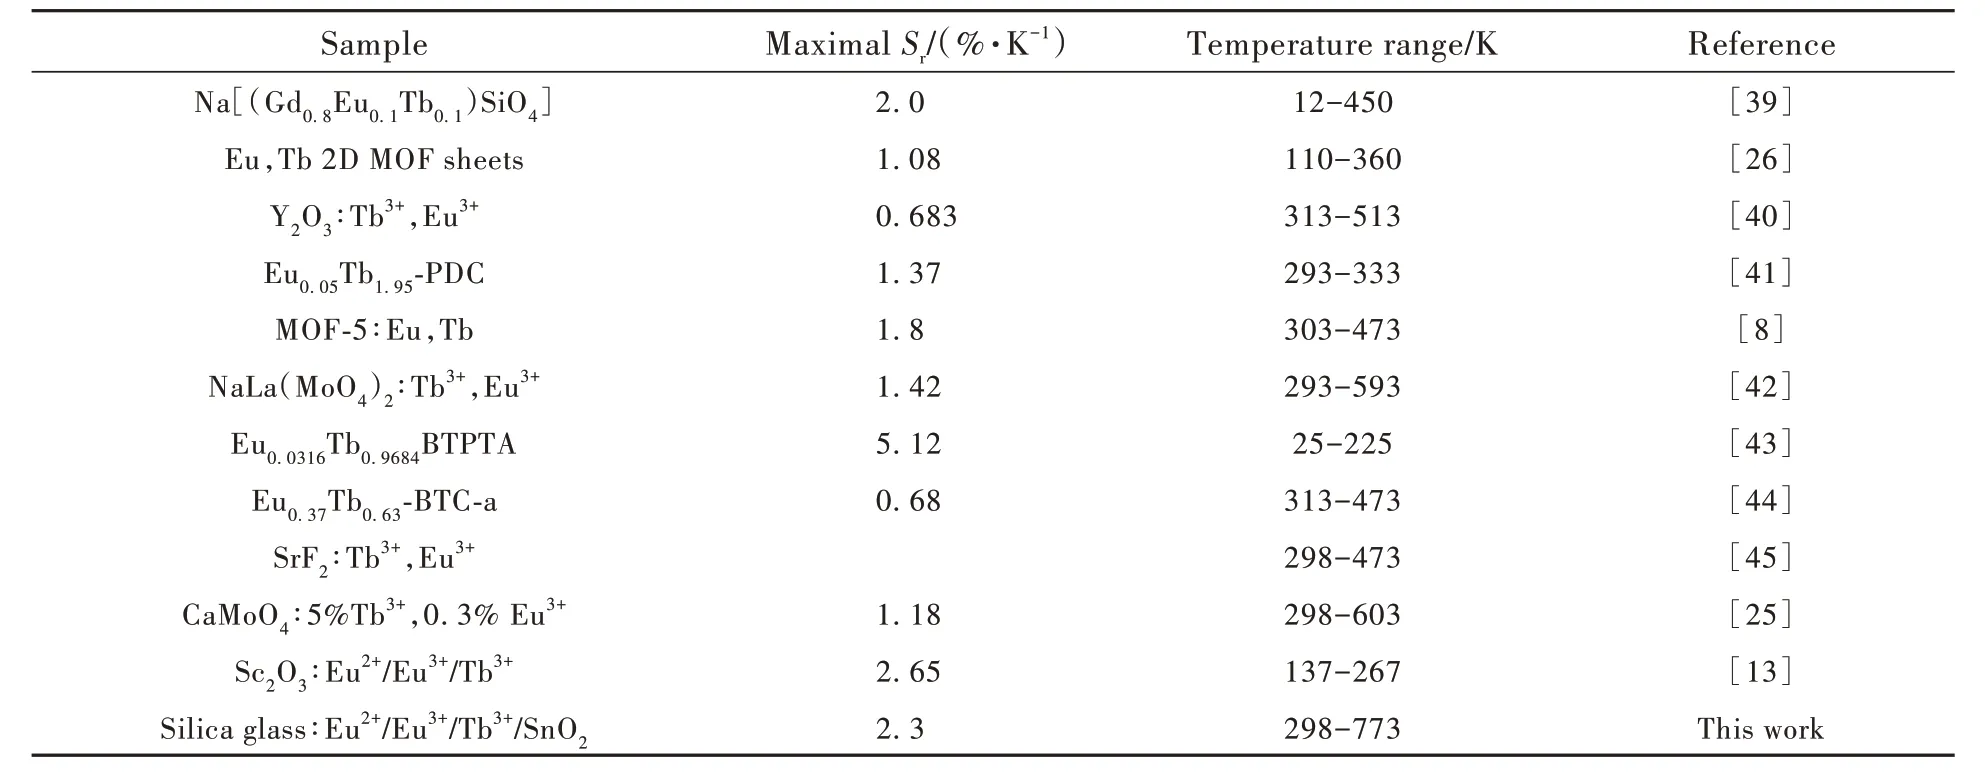
Tab.1 Overview of the maximal Sr of different Eu/Tb co-doped materials
Repeatability is a vital parameter for sensor[13,17].As shown in Fig. 4, the repeatability is 93.90% forI620/I434and 95.18% forI620/I542, which was obtained by heating-cooling four cycles. This suggests Tb 0.10 has good repeatability as luminescent thermometers.
4 Conclusion
In summary, we report the triple-emitting photoluminescence of Eu/Tb/SnO2NCs co-doped silica glasses for self-referencing temperature probing.The temperature dependent FIR of Eu3+/Eu2+and Eu3+/Tb3+were used for measuring temperature in a wide range of 298-773 K. TheSrvalues ofI620/I434andI620/I542both increase linearly with temperature and the maximumSrvalues are 2.3%·K-1and 2.1%·K-1at 773 K, respectively. TheSrvalues are higher than most Eu/Tb co-doped materials, which indicates the potential of this hybrid in self-referencing optical temperature measurement with triple activators.
Supplementary Information and Response Letter are available for this paper at: http://cjl.lightpublishing.cn/thesisDetails#10.37188/CJL.20230212.
猜你喜欢
合肥工业大学学报(社会科学版)(2020年2期)2020-05-14
纺织科学研究(2020年4期)2020-04-30
油田化学(2020年1期)2020-04-07
合肥工业大学学报(自然科学版)(2020年1期)2020-02-24
中西医结合心脑血管病杂志(2016年20期)2016-03-01
中国卫生标准管理(2015年6期)2016-01-14
湖北师范大学学报(自然科学版)(2015年1期)2016-01-10
合肥工业大学学报(自然科学版)(2015年7期)2015-03-17
无机化学学报(2014年4期)2014-02-28