自复位学校建筑抗震韧性区域评估用数字孪生模型
2024-01-12 13:12REZVANPooya张云峰
同济大学学报(自然科学版) 2023年12期
REZVAN Pooya, 张云峰
(马里兰大学 土木与环境工程系,公园市 20742)
One of the leading methodologies for regional loss estimation is developed by the HAZUS program of FEMA[1-3]which provides data, standards, and tools for regional risk assessment due to different natural hazards such as earthquakes, floods, and hurricanes[4]using the capacity response spectrum method and by simulating buildings as single-degreeof-freedom (SDOF) systems[5-8]However, this method is accompanied by several limitations such as considering the velocity-pulse in the ground motion or estimating the loss at different stories[9].The FEMA P-58 methodology[10]is the state-of-the-art component-level method for seismic loss assessment of buildings by implementing the peak structural responses from response history analysis (RHA) as the engineering demand parameters (EDPs).Using the FEMA P-58 method, the damage and loss of the building are calculated by aggregating the damages in the structural and nonstructural components in each story based on the component fragility curves and corresponding consequences provided in the FEMA P-58 database[10-12].One of the challenges of utilizing this methodology on a regional scale is the computing time of a large number of response history analyses required to obtain the EDPs as well as the lack of information for assembling the performance models of the building[9,13].
Zeng et al.[9]proposed an approach for regional seismic loss prediction based on the FEMA P-58 method by utilizing multi-degree-of-freedom(MDOF) lumped-mass stick models of the existing buildings for rapid calculation of the EDPs.Depending on the structural system, they used either the modified-clough, bilinear elastoplastic, or pinching model to simulate the nonlinear story-shear hysteretic behavior of the structure and conducted an intensity-based loss prediction of the campus of Tsinghua University, consisting of 619 buildings.Lu et al.[14]developed an open-source framework for regional seismic loss estimation of existing buildings by performing nonlinear RHA using MDOF shear building models.They simulated a scenario-based earthquake and performed seismic damage and loss assessment for 1.8 million buildings in the San Francisco Bay area.Hu et al.[15]developed a storybased seismic loss prediction model of regional-scale buildings based on a machine learning (ML)approach.They utilized ML models to consider the time-lag effect of cost information and the loss ratio of buildings with different occupancies.You et al.[16]investigated the effect of combining the multilinear-elastic hysteresis representing the self-centering systems with the hysteresis loops of existing buildings on the regional seismic resilience based on the HAZUS methodology.They reported that the smaller residual inter-story drift ratio (IDR) of selfcentering systems can significantly reduce the probability of irreparability which results in a lower seismic loss of self-centering buildings compared to conventional buildings in a city.In many types of selfcentering systems, the plastic deformation of selfcentering structural members such as post-tensioned cables causes the loss of restoring force which might result in a large residual drift in such systems following a strong earthquake.However, they did not consider this restoring force loss behavior in their proposed multi-linear-elastic hysteresis model.
A digital twin (DT) is a virtual (computational)replica of a physical object such as existing buildings,or a virtual replica of a process, such as the construction of a bridge.The underlying concept typically integrates artificial intelligence, ML, and/or software analytics with physics-based modeling, to create a digital simulation model that can mirror the states and behaviors of the physical counterpart of DT[17].Digitalization of civil infrastructures equipped with various sensors and monitoring systems allows the autonomous collection of data during natural hazardous events, which can be utilized to understand the response behaviors, test new technologies, and mitigate risks.Digital twins are gaining unprecedented attention because of their promise in smart cities and industry to optimize operation, health condition monitoring, decision, and policy-making, by comprehensively modeling the physical world as a group of interconnected digital models[18-19].The digital twin technology also has a strong potential in disaster resilience management for civil infrastructures, especially smart buildings equipped with sensors and monitoring systems.
The goal of this research is to develop a digital twin framework with a seamless computational procedure for regional seismic resilience assessment of school buildings with SCMBP systems following the component-level FEMA P-58 methodology.The results of the framework are generated in the context of graphs, tables, and vector shapefiles covering the seismic resilience metrics (repair cost, repair time,probability of irreparability, etc.) and building footprint that could be visualized and symbolized three-dimensionally in geographical information system (GIS) software to provide decision-makers with a more intelligible quantitative evaluation of regional seismic losses.As a case study, the seismic resilience assessment of 1 890 school buildings with portable self-centering steel modular bracing panels(SCMBPs) was comparatively conducted for the San Francisco Bay Area building inventory at nine different intensity measures (IMs).A simplified MDOF lumped-mass stick model with nonlinear spring elements was developed to simulate the flagshaped hysteresis of such SCMBP systems.In the proposed spring model, the partial or total loss of the restoring force due to the yielding of the posttensioned (PT) cables that would cause large residual drift at large IMs was considered.The regional-level and building-specific outputs were generated and multiple samples were presented.Additionally, the effect of the energy dissipation capacity of the SCMBP modular systems on seismic losses was investigated by conducting a parametric study using three different values of the energy dissipation ratio,β.
1 Description of digital twin model framework
The computational framework of the digital twin model for regional seismic resilience assessment of buildings is illustrated in Fig.1 which consists of the following component tasks: ① establishing the building inventory of the selected region containing the basic specifications of buildings (height, plan area, occupancy, and footprint, GPS coordinates,etc.); ② quantifying the seismic design parameters of the sites of buildings; ③ simulation models for predicting the seismic responses of the building inventory; either a finite element model or an ML model can be used for this purpose.ML models usually require a large number of verified data for model training.In this study, the nonlinear MDOF lumped-mas model of the buildings was adopted to demonstrate the concept.④ performing intensitybased RHA; measured sensor data such as ground motion records and structural response data are used as inputs to the simulation model.⑤ post-processing the demands and obtaining the median and dispersion of EDPs; ⑥ identifying seismically vulnerable structural and nonstructural components ;⑦ probabilistic damage and loss assessment of the buildings at each intensity and obtaining the corresponding resilience metrics (repair cost, repair time, etc.); ⑧generating regional and buildingspecific output tables and graphs, as well as vector shapefiles with an attribute table containing the resilience metrics and the building footprints ;⑨ updating the building inventory if repair or replacement action is required for selected seismically deficient buildings.This digital twin framework can be adapted for any specific type of structural system with user-defined story-shear hysteresis characteristics and can also be adapted to other hazards.
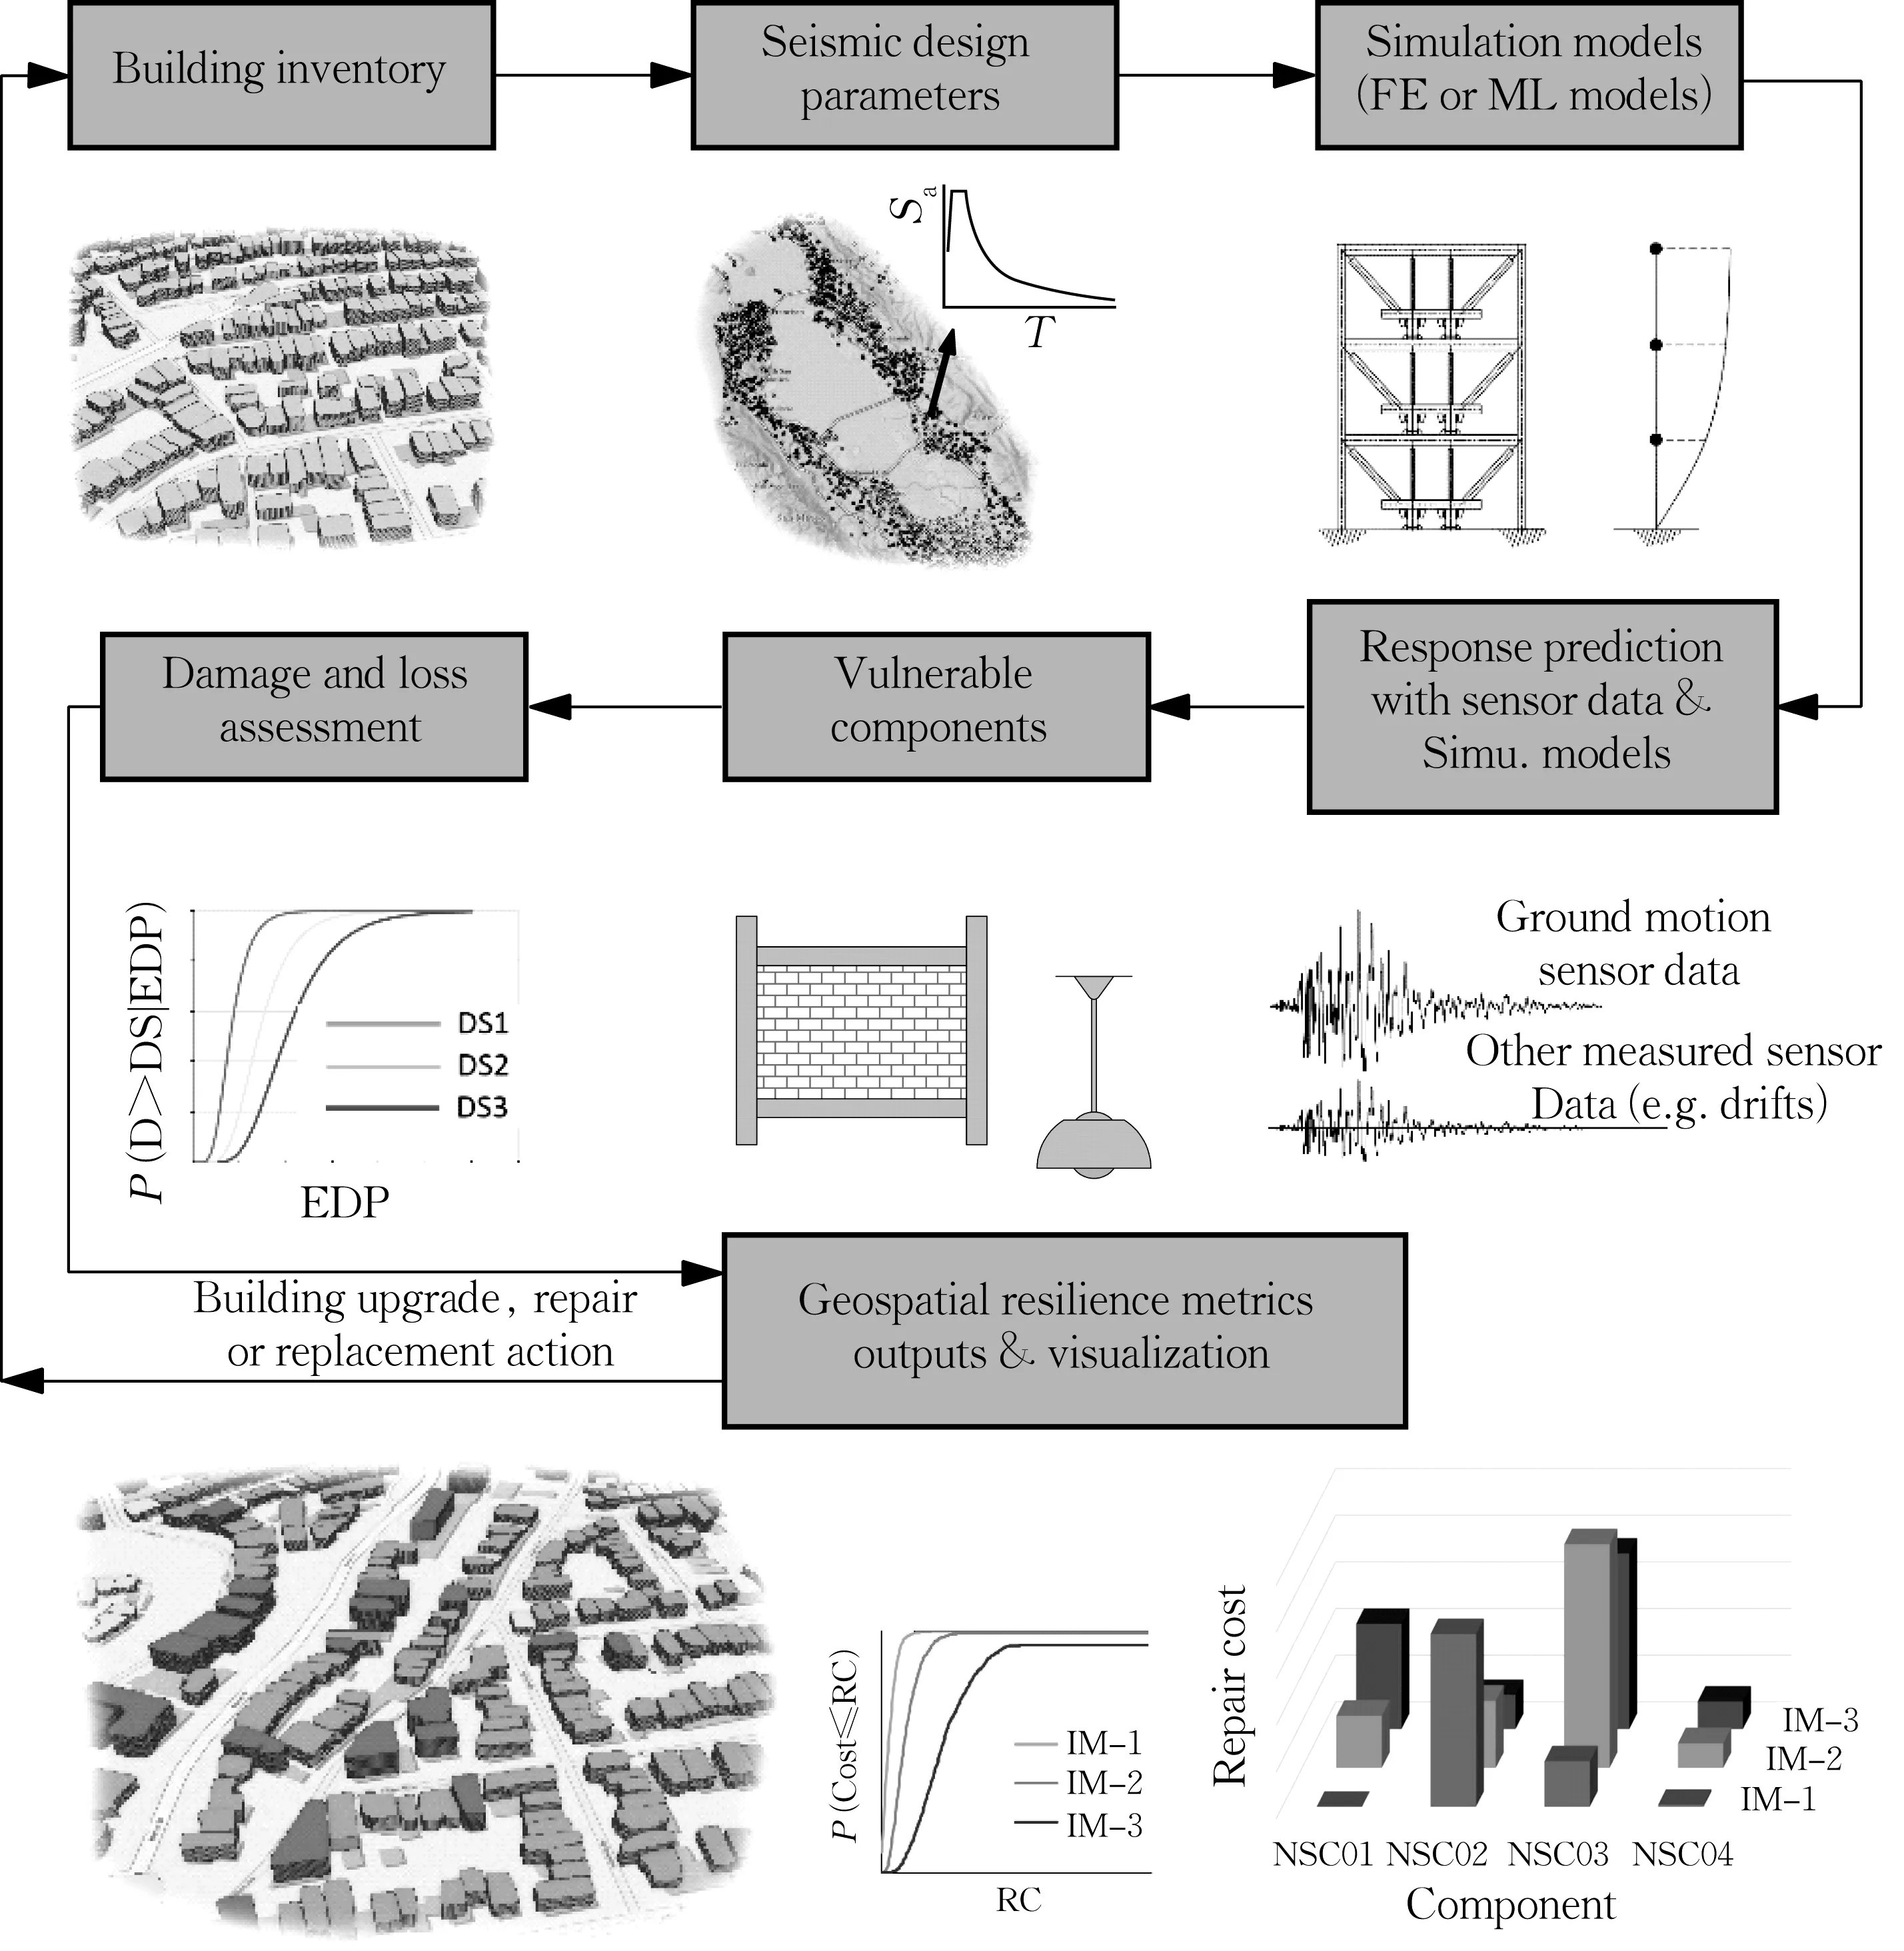
Fig.1 Workflow of digital twin framework for regional seismic resilience assessment of school buildings
To improve computing performance, the parallel processing option has been enabled by utilizing the concurrent.futures Python module.This involved employing a user-defined number of threads, which is applicable to multi-core CPUs.
1.1 Generating building inventory
The input of the framework is a CSV file or an ESRI shapefile covering the basic information of the building (latitude, longitude, height, plan area,occupancy type) such as the ones provided by the FEMA Geospatial Resource Center[20]repository.Nevertheless, in this repository, the occupancy type of the buildings is only defined for a limited number of states as yet which requires obtaining this information from other resources and combining it with the input shapefile using georeferencing functions.Additionally, the height information of some buildings is not provided within the shapefiles which would be obtained by processing the remote sensing data of the region.In the case study, it will be further discussed how to obtain the building height using the digital surface model (DSM) and digital elevation model(DEM) by processing LiDAR point clouds of the region.Using the ArcPy module, a Python package for performing GIS functions available in ArcGIS software[21], the footprints of the buildings are converted into the GeoJSON file format and stored in a CSV file along with other required information of the buildings to be used as the input of the framework.The buildings could be filtered based on desired specifications such as occupancy type or height in case the framework is intended to be performed for buildings with certain properties.Moreover, NHERI SimCenter has recently developed an AI-based Python package[22], for extracting the building information from Google satellite and street-level images.
1.2 Obtaining seismic design parameters
The seismic design parameters (SDS,SD1,T0,TS, andTL) are required to determine the design story strength of the buildings which is later needed to characterize the nonlinear hysteresis behavior of the stories and determine the quantity of the structural components that provide the strength of the system.These parameters are obtained in JSON file format directly by sending a request to the seismic design web services of the US Geological Survey(USGS)[23]using the urllib Python package.
1.3 Generating MDOF lumped-mass model
The numerical models for time history analysis are created using the OpenSeesPy[24]package, a Python interpreter of OpenSees software[25].The EDPs required for damage and loss assessment of the buildings should be obtained by post-processing the results of nonlinear RHA using a suite of ground motions.To reduce the computing time, a simplified MDOF lumped-mass stick modeling approach with nonlinear shear springs representing the story shear hysteresis response is adopted here for performing a large number of RHA.The general concepts of the method proposed by Lu and Guan[26]for modeling the conventional structures on a regional scale using MDOF shear models are adopted with modification of the hysteretic behavior of the stories in which the single pinching parameter hysteretic model[27]is replaced with the user-defined hysteretic model of the system of interest (e.g., flag-shaped hysteresis of SCMBP systems).The fundamental period of the buildings could be estimated using empirical relationships suggested by ASCE 7 seismic provisions for different types of structural systems or by user-defined relationships.In the next section, a simplified MDOF model for characterizing the hysteresis of SCMBP systems is presented which is subsequently used for a case study in this research.The seismic mass lumped to each floor is determined based on the plan area and the occupancy type of the structure.The floor mass, m, and initial stiffness,k0, are assumed to be uniformly distributed along the height of the structure so that the stiffness matrix,[K], and mass matrix, [M], could be constructed and the initial stiffness of the stories is obtained using the following relationships[26]:
where [Φ1] is the mode shape vector of the first vibration mode.It is worth noting that [Φ1] is not dependent on the constant values ofmandk0and can be obtained by performing Eigenvalue analysis by settingm=1 andk0=1.The base shearVy,1is calculated based on ASCE7-16 and the seismic forces are assumed to vary linearly along the height of the structure which could be calculated using the following relationships:
whereVy,iis the story shear in the i-th story, andNis the total number of stories in the building.
1.4 Response history analysis and obtaining EDPs
The seismic damage and loss of each building at the considered intensity measure, IM, is calculated by aggregating the loss in the components of the building that are sensitive to EDPs such as story drift, floor acceleration, floor velocity, and residual drift.The EDPs are obtained by performing nonlinear RHA using a suite of ground motions.According to FEMA P-58, eleven pairs of ground motion records are sufficient for RHA.In this study, the ground motion pairs were selected from the far-field record set from the FEMA P-695[28]database.The Newmark method withβ=0.25 andγ=0.5 was adopted for numerical analysis.The user-defined damping ratio can be based on the building material(i.e., steel, concrete, wood, and masonry) and structural height to obtain the Rayleigh damping coefficients for conducting RHA.
The intensity-based seismic loss assessment based on FEMA P-58 is commonly conducted using spectral acceleration(SA) as IM.However, previous studies suggest using peak ground acceleration(PGA) as IM for regional seismic loss assessment since the fundamental period of the buildings might vary significantly, and scaling the ground motions based on theSAmight lead to ground motions with very different PGA values[29].Nevertheless, both options of PGA-based and SA-based ground motion scaling methods are acceptable and can be selected by the user.
After performing the RHA, the EDPs are obtained in two orthogonal directions by postprocessing the results and obtaining the median and dispersion of the peak values of the inter-story drift,floor acceleration, floor velocity, and residual drift at each story and IM.The output is stored in a compatible format with the Pelicun package for damage and loss assessment.
1.5 Defining vulnerable structural and nonstructural components
Since the FEMA P-58 is a component-level method, the quantity and location of the structural and nonstructural components which are susceptible to seismic damages should be determined.In conventional structures, all the structural members except for the fuse members (such as the link beam in eccentrically braced frames) should remain elastic at the DBE level.For higher levels of shaking, other force-controlled structural members such as beams,columns, or braces might yield which is followed by a large residual drift in the structure.However,according to FEMA P-58, if the residual drift is larger than a certain limit, the structure will be classified as irreparable, and the repair cost and repair time of the building will be set equal to the replacement cost and replacement time of the building.Therefore, based on the component fragility database of FEMA P-58, only the fuse members are considered to be susceptible to seismic damage.The same logic would be adopted to the structural system under investigation.However, the fragility and consequence function of any specific fuse component must be defined by the user.The quantity and size of the fuse members at each story would be obtained based on the design shear force of the corresponding story along with any additional requirement for such components.For example, in the SCMBP systems, replaceable hysteretic damper(RHD) devices are employed as the fuse members,thus their fragility and consequence functions should be defined and appended to the existing database.
To estimate the type and quantity of vulnerable nonstructural components within a building, the normative quantity data (typical quantities) of nonstructural components included in the FEMA P-58 documentation was implemented which is based on a detailed study of nearly 3 000 buildings with different occupancy types.The type of the components depends on the occupancy type, and the quantity of the components is a function of the plan area and the number of stories.
1.6 Seismic resilience assessment
The probabilistic seismic resilience assessment of the buildings is performed by using the Pelicun package[30]which is developed by the NHERI SimCenter for performance-based engineering and regional risk assessment.The Pelicun package provides the required tools in Python for probabilistic seismic damage and loss assessment of buildings based on the FEMA P-58 methodology.The uncertainty in the EDPS, component quantities,damage states, and consequences in each component(repair time, and repair cost) are considered by adopting the Monte-Carlo simulation method for a large number of realizations.Each realization contains a single random combination of possible values of any uncertain factor and corresponds to a potential performance outcome.The damage and loss of the building are calculated by aggregating the damages in the structural and nonstructural components based on the component fragility curves and corresponding consequences provided in the FEMA P-58 database.Repair time is obtained by considering two cases of parallel and sequential working strategies in the stories which can be assumed to be the lower and upper bounds of the repair time in practice.
Fig.2 illustrates the simplified algorithm for damage and loss analysis in each realization adopted within the Pelicun package following the FEMA P-58 methodology in which the environmental impacts,casualties, and red tags are not included.Before starting the damage and loss analysis in each realization, the building should be checked against the collapse and irreparability conditions.If either building collapse or irreparability condition occurs,the repair time and repair cost are set to equal the replacement time and replacement cost, respectively,and the damage and loss analysis of the performance groups will not be performed.
(1) Collapse condition
The collapse condition is defined based on the collapse fragility function of the structural system which should be introduced by the user by providing the median and dispersion of collapse spectral acceleration,SA, at the fundamental period of the building.A collapse case is defined by comparing the probability of collapse at the median spectral acceleration of the suite of ground motions (at the fundamental period of the building) to the random value generated between 0 ~ 100.If the probability of collapse is larger than the random value, the collapse flag will be turned on.
According to FEMA P-58, different methods could be used for obtaining the collapse fragility function.From higher to lower reliability, these methods are incremental dynamic analysis (IDA),FEMA P-695 simplified IDA procedure, pushover analysis for low-rise buildings, and judgment-based target collapse resistance which is inherent in the building codes and can be utilized for buildings that are designed based on the requirements of the recent codes.The user should obtain the median and dispersion of the collapse SAof the system of interest using an appropriate method in a separate study.However, the last method which does not require further finite element analysis is also provided within the framework.
(2) Irreprability condition
If collapse does not occur, the realization will be checked against the irreparable conditions based on the peak residual IDRs and the user-defined building repair fragility.Similar to the collapse condition, a random integer value is generated between 1 and 100 which will be compared to the probability of irreparability at the peak residual IDRs.To define the repair fragility, the suggested values by FEMA P-58 for the median (1.0%) and dispersion (0.3) of the residual drift corresponding to the irreparable damage could be utilized.Utilizing a lower limit of 0.5% was also recommended in other studies[31]stating that for a residual drift larger than 0.5%, building repair might not be economically justifiable.
(3) Damage and loss calculation
For each realization, if neither collapse nor irreparable conditions occur to the building, the damage states of the performance groups should be calculated.The components within the same fragility group that are sensitive to similar EDPs are categorized as performance groups (e.g., the suspended ceiling of the first story).
Additionally, it is possible to define the damages within a performance group to be correlated or uncorrelated.For correlated damages, all the components within the performance group essentially experience the same damage state.
Each damage state within the performance group is accompanied by consequence functions that specify the probabilistic distribution of the losses such as repair time, and repair cost of that damage state.For components that are not defined within the FEMA P-58 database, the fragility and consequence functions should be provided by the user.For each realization,the total loss of the building is calculated by aggregating the losses of all the performance groups within the building.The probabilistic distribution of the building losses is obtained by repeating the steps for a large number of realizations.
1.7 Generation of outputs and visualization of building losses
The result of the regional damage and loss assessment is stored in the context of graphs, tables,and vector shapefiles at each IM.This information includes the regional cumulative distribution function(CDF) of the mean repair cost/time, the regional mean contribution of each component to the total repair cost/time conditioned on repairable cases, the regional contribution of each possible damage scenario(i.e., reparable, irreparable, and collapse) to the mean repair cost/time, regional probability of irreparable damages, the contribution of each floor to the average repair cost/time conditioned on repairable cases.Having the building footprints and resilience metrics of the building at each IM, multiple shapefiles are generated with an attribute table covering the resilience metric (e.g., repair cost, repair time,probability of irreparability, etc.) at different IMs that could be visualized three-dimensionally in a GIS software which provides decision-makers with a better comprehension of the quantitative evaluation of the regional seismic resilience of the building inventory.
2 Case study: regional seismic resilience assessment of school buildings
One of the critical infrastructures that need to be highly resilient is school buildings since education is a critical component of society and disruption in educational systems is undesirable.Furthermore,school buildings can also be utilized for sheltering households who need recovery support after destructive earthquakes.Many existing structures located in seismic regions are seismic deficient according to current seismic design codes.For example, in California alone, it is estimated there are 40000 nonductile reinforced concrete buildings,including schools, commercial buildings, and critical service facilities[32].New trends in seismic design have resulted in proposals of several innovative seismic protection strategies, among which the concept of self-centering systems has received a lot of attention[33-34].Self-centering steel modular bracing panels (SCMBPs) can be utilized as portable modular panels that can be inserted and connected to existing framed structures.The schematic of a portable SCMBP module panel is illustrated in Fig.3.Post-tensioned cables or pre-compressed disc springs can be employed to provide the required recentering capability following a design-level earthquake.Replaceable hysteretic dampers (RHD)in the modular panel provide the primary energy dissipation mechanism for the system while they can be easily replaced after the earthquake.
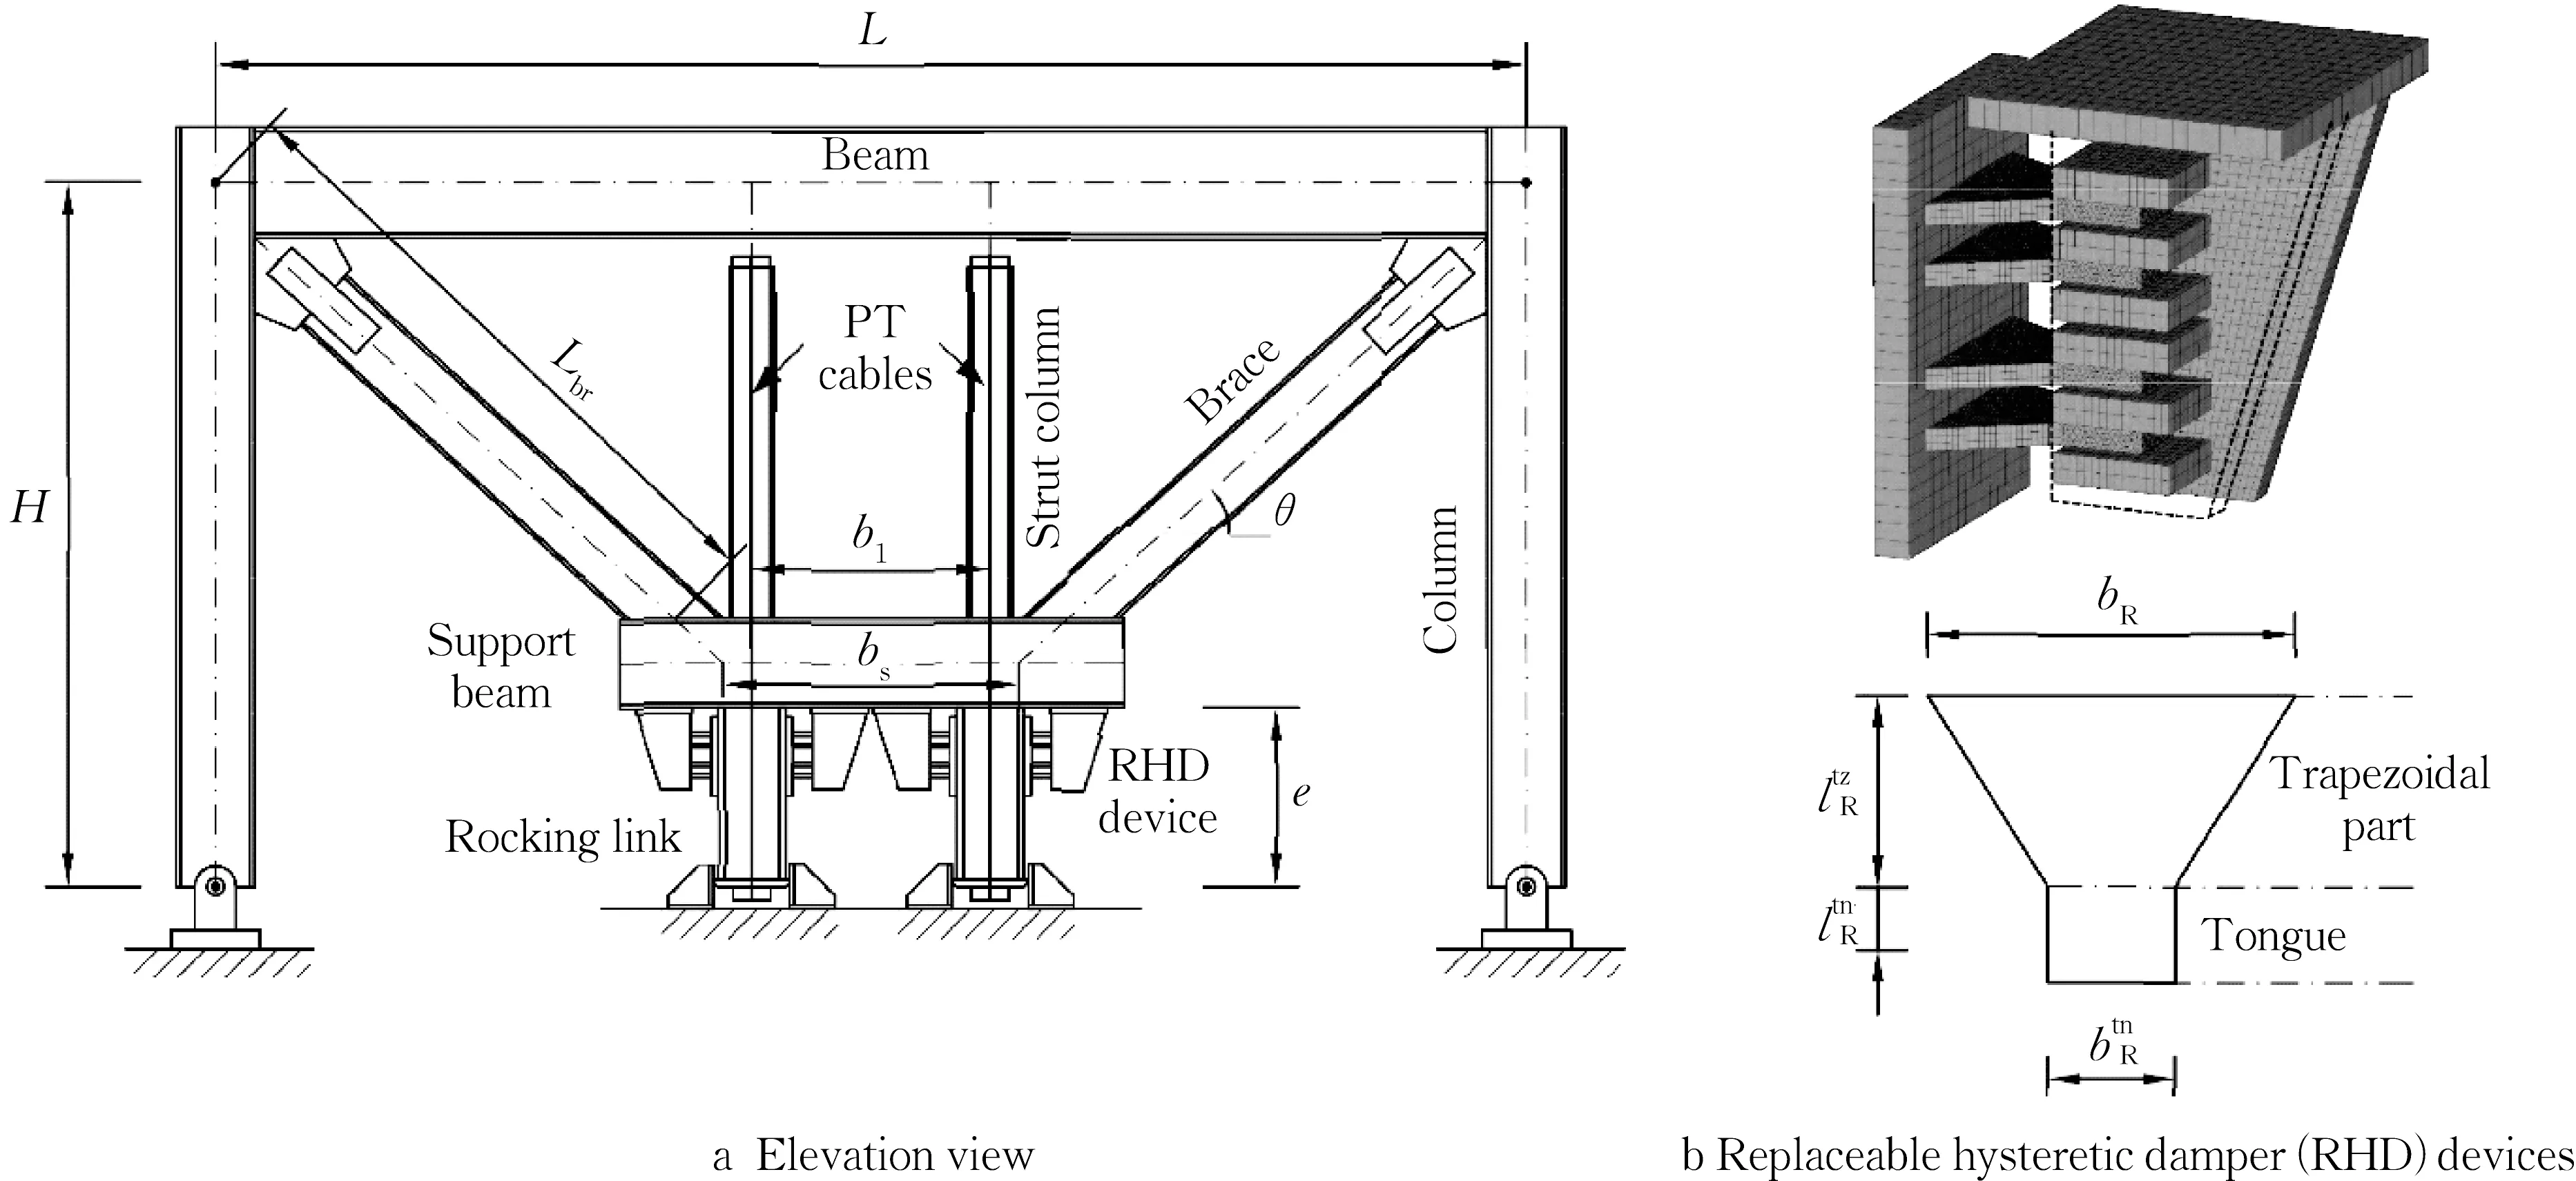
Fig.3 Schematic illustration of self-centering eccentrically braced frame modular panel inserted into a structural frame
Self-centering systems have the ability to control damage and to reduce (or even eliminate) residual structural deformation, after strong earthquakes.According to the definition of resilience as a measure of robustness, redundancy, resourcefulness, and rapidity of a system[35], utilizing such portable seismic resistance modular panels would enhance the resilience of buildings by reducing the recovery(repair) time and increasing the system robustness.By utilizing modular SCMBP systems, those buildings can be immediately occupied after the rapid replacement of the fuse devices following an earthquake.Aiming to quantify the effect of utilizing SCMBP modular systems in enhancing the regional seismic resilience of critical infrastructure, the framework was performed on 1 890 school buildings in the San Francisco Bay Area employing such systems with a flag-shaped hysteresis behavior.
To generate the input CSV file covering the basic information of the school buildings, the shapefile of the building footprints of the selected region provided by the FEMA Geospatial Resource Center[20]was used.The occupancy type of the buildings in California has not been added to the provided shapefile yet.Therefore the site location of the school buildings was obtained from California State Geoportal[36]and used to filter the footprints of the school buildings.Additionally, the height information for some buildings has not been defined in the provided shapefile which could be obtained by processing the LiDAR point clouds of the region(Fig.4a) from the open access database of The National Map Data Download and Visualization Services of USGS[37].The normalized DSM(nDSM) represents the height of features above the ground and is obtained by subtracting DSM which is a digital representation of ground surface topography from DEM which represents the elevation of the features.Both DSM and DEM could be obtained by processing the LiDAR point clouds based on the class codes and return values of such data using the functions provided within the Arcpy package.Fig.4 shows the DEM, DSM, and nDSM of a part of the region of study.
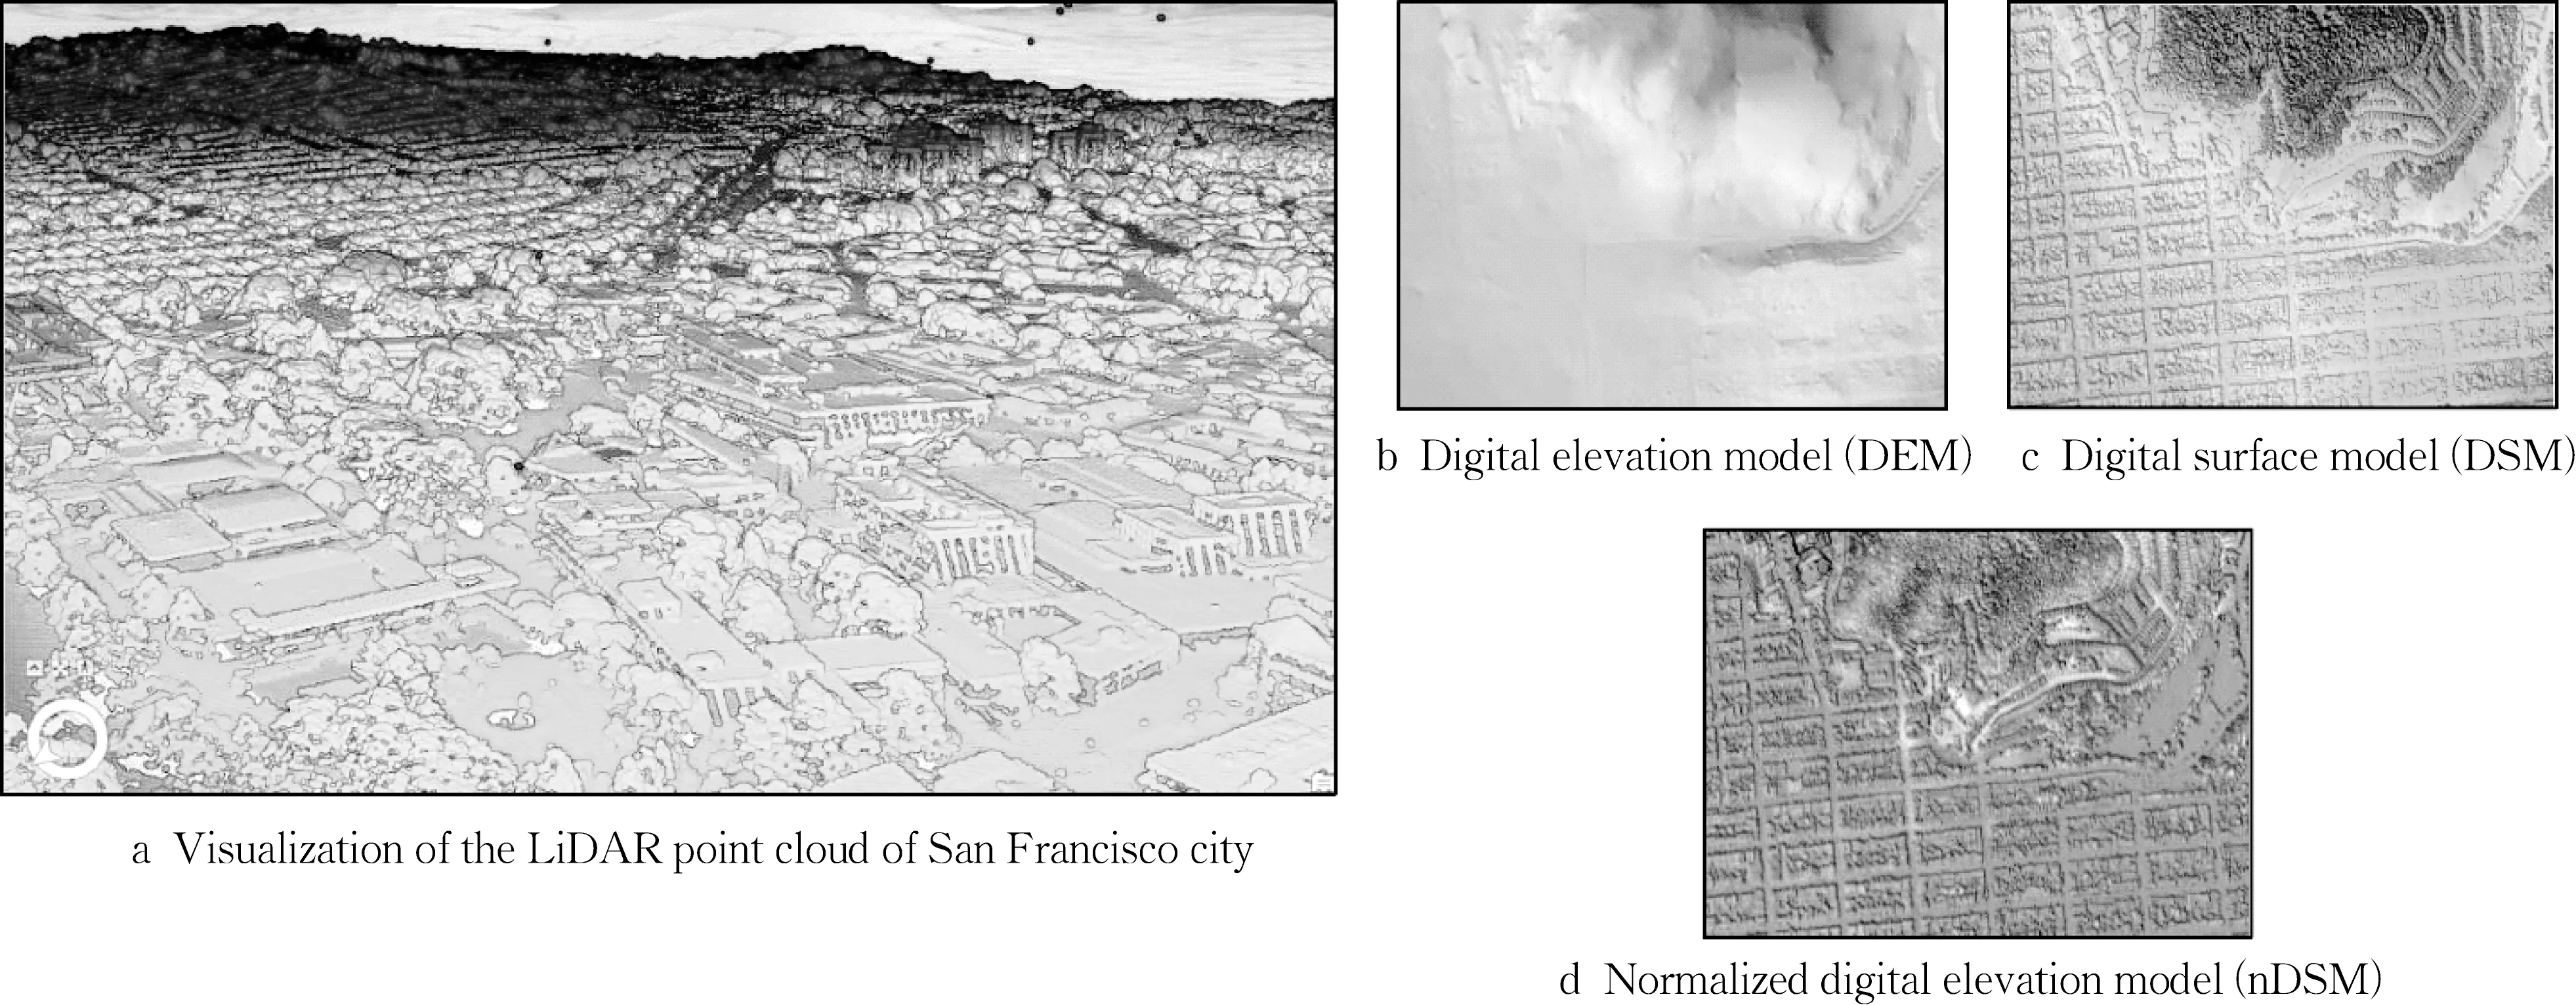
Fig.4 Digital models of study region
The height information of the buildings of interest was extracted from nDSM and combined with the shapefile covering the footprints of the school buildings.The distribution of the school buildings symbolized based on geometric mean PGA at the maximum considered earthquake of their site location along with the histograms of the story numbers and plan area are presented in Fig.5.
(1) Generating numerical models
The flag-shaped hysteresis of the SCMBP systems is shown in Fig.6.The parameters required to characterize the behavior of the system are initial stiffness,K1, post-gap-opening stiffness,K2, postyielding stiffness,K3, gap-opening force,V0, and system capacity,Vy.The superscript “fr” denotes considering the effect of friction force on gap-opening force and system strength.The analytical relationships for calculating the above structural parameters can be found in Rezvan’s work[38].
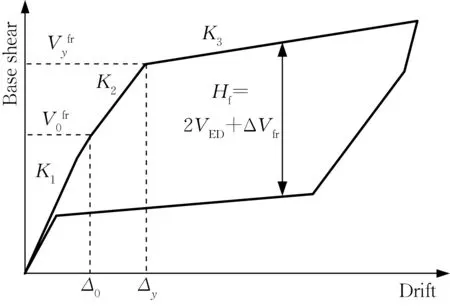
Fig.6 Flag-shaped load-displacement hysteresis curve of SCMBP systems
The natural periods of the buildings were estimated based on the empirical relationship for eccentrically braced frames provided in ASCE7-16 and the base shear and the initial stiffness,K1, were obtained through uniform mass and stiffness distribution assumption along the height of the structure as previously discussed.It is worth noting before gap-opening that the system behavior is similar to conventional EBFs.The energy dissipation capacity of the system is defined by the ratio of the flag height to the system strength,β=HfVfry,which could be adjusted to the desired value by sizing the fuse devices and gap-opening force.Therefore,for any given system strength, it is possible to design the system with different combinations of the fuse devices and the PT cables which would result in different energy dissipation ratios.To study the effect of this ratio on the regional resilience of the buildings employing the SCMBP system, three values, 0.5,1.0, and 1.5, were considered for this parameter.At a static loading, the full self-centering behavior is achieved only ifβ≤1.0.However, under dynamic loading, the system withβ>1.0 might still be able to recenter itself unless the cables lose their initial PT force due to relaxation after yielding.Since generating the PT force is more costly than the fuse devices, the cost-competitive case with a large energy dissipation ratio ofβ=1.5 was also considered in the study.The size and quantity of fuse devices and PT cables of each story were defined based on the corresponding design story shear and by considering general assumptions such as the aspect ratio of the link beam (depth/length) and initial PT level stress in the PT cables.After designing the fuse devices and PT cables for eachβvalue, the post-gap-opening stiffness,K2, and post-RHD-yielding stiffness,K3,were calculated using the analytical relationships[38].
To simulate the flag-shaped hysteresis of SCMBP systems for RHA, an adaptive constitutive spring model consisting of five linear and nonlinear springs was proposed.The load-displacement behavior of the springs is illustrated in Fig.7 where Spring A with rigid bilinear elastic material simulates the gap-opening behavior.Elastic-linear hardening material was utilized for Spring B to simulate the post-RHD-yielding stiffness and nonlinear behavior of the PT cables, and Steel-02 material was assigned to Spring C to capture the system strength and energy dissipation of the system provided by the RHD devices.Spring D with elastic-perfectly plastic material simulates the energy dissipation due to the friction force.Spring F with linear elastic material simulates the initial stiffness of primary structure stories and is connected serially to the parallel combination of other springs as shown in Fig.7.The specifications of the springs at each story should be calculated based on the analytical load-displacement relationships presented in Tab.1.Rezvan and Zhang[39]thoroughly illustrated the definition and calculation of the parameters in the Table.The proposed concept of the spring model could be generalized to other self-centering systems with nearly similar behavior after developing the analytical relationships of the system behavior.
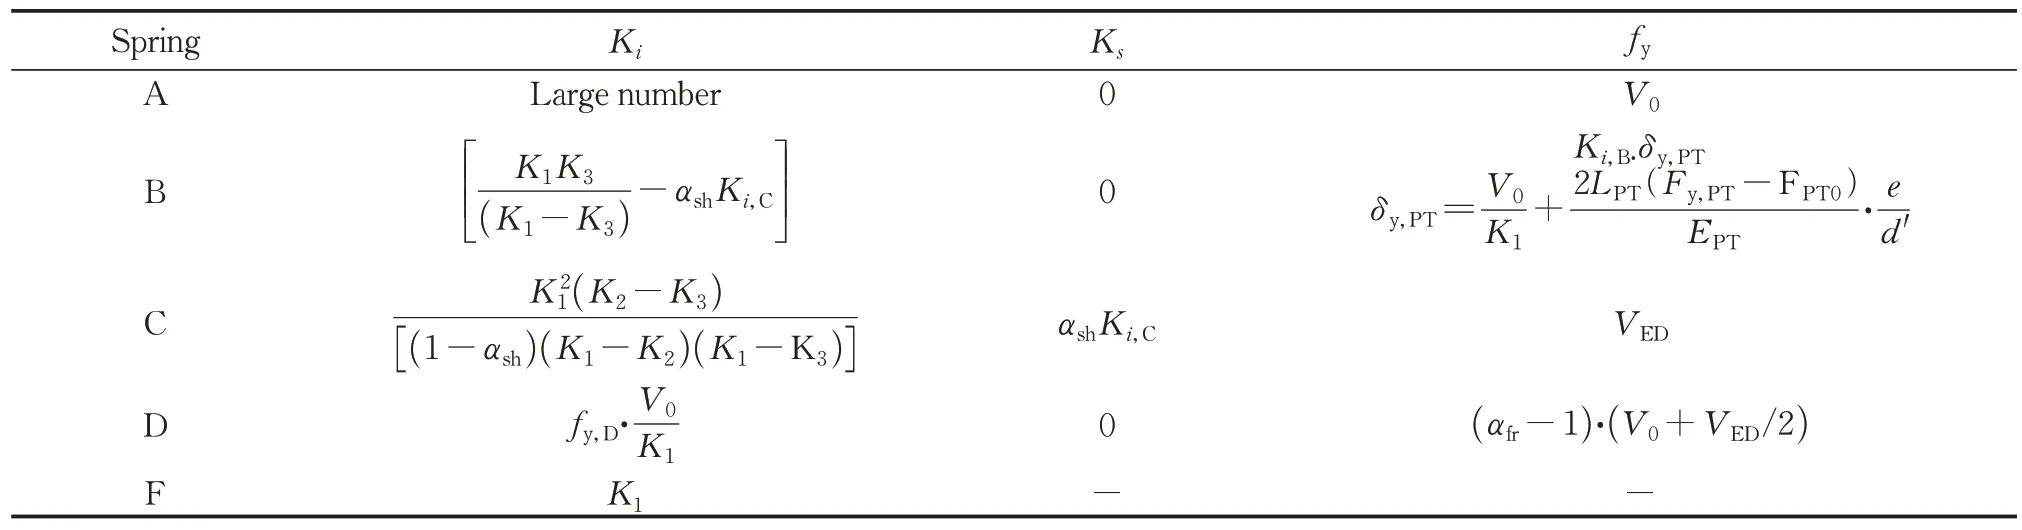
Tab.1 Specifications of constitutive nonlinear spring model

Fig.7 Load-displacement behavior of nonlinear spring model for SCMBP systems
In the SCMBP system, the restoring force is provided by PT cables and the yielding of the PT cable leads to a partial or total loss of the initial PT force which might be followed by a large residual deformation.In the proposed spring model, the gapopening behavior and post-yield stiffness which is mainly contributed by the PT cables have been simulated with two independent springs (Springs A and B).Therefore, the yielding of the PT cables should be reflected in the loss of gap-opening force,V0, simulated by Spring A, and the yield force of Spring B,fy,B, so that the story shear corresponding to the plastic deformation of the cables remains unchanged.Moreover, if the total PT loss occurs,the gap-opening behavior will not happen anymore.In other words, the gap-opening force,V0, will be zero.Depending on the maximum strain in the PT cables, the total PT loss might be followed by cable slacking which should be reflected in Spring B by using gap elements.These consequences have been considered by assigning three parameters to the yield force of Spring A (to update the gap-opening force),the yield force of Spring B (to keep the strength of the system corresponding to the yielding of the PT cables unaffected), and the initial gap in Spring B (to consider any cable slacking).Using the“updateParameter” command in OpenSees, IDRs are checked in each time step of RHA and in case IDRs become larger than the drift limit of the PT cables yielding,δy,PT, the parameters will be updated accordingly.
The RHA was performed at nine IMs for the threeβcategories (a total of 1 122 000 RHA).In this study, the Rayleigh coefficients were obtained by assigning a 5% damping ratio to the first and second modes of all prototype buildings.
(2) Fragility and consequence functions of fuse devices
The fragility and consequences functions of RHD devices should be defined and appended to the FEMA P-58 database provided in the Pelicun package.In this study, the fuse devices are made of low-yield point Q225 steel.The damage in the RHD devices could be quantified with the damage index(DI) derived from low-cycle fatigue development in the fuse plate.The replacement of the fuse devices is conservatively assumed to be necessary once the DI reaches 50% of its life cycle (DIm) during the main event.However, in the simplified MDOF model,the RHD plates are not simulated explicitly and other EDP should be introduced to reflect the fatigue life of the fuse devices.For this reason, the peak rotation angle of the rocking link beam was selected which can be approximated from peak IDR and is closely related to the strain history in the material of the fuse devices.Therefore, in a separate study, the wireframe model of a prototype SCMBP, in which all the members including the fuse devices were modeled explicitly, was subjected to a suite of ground motions.Each ground motion was scaled so that the DI of the fuse devices reached DIm±5% at the end of the ground motion.The low-cycle fatigue of the fuse devices was considered in the numerical model by wrapping the fuse material inside the fatigue material which accounts for the effects of low-cycle fatigue based on the Coffin-Manson relationship and by implementing a rainflow cycle counter.The coefficients of Coffin-Manson relationships were calibrated based on the results of the cyclic loading tests on the Q225 material coupon specimens for the low-cycle fatigue study.The median value of the peak rotation angle of the rocking link beam which corresponds to 50% of the fatigue life of the RHD plates was found to be larger than 0.1 radians.Fig.8 illustrates the rotation angle history of the rocking link beam along with the DI in the fuse devices subjected to a typical ground motion record.The consequence functions of the damaged state of the fuse devices were described as the repair cost and repair time.The replacement of each fuse device, as previously measured by the authors, could be made within 30 minutes which should be converted to 0.0625 worker.day.The repair cost of each device consisting of four trapezoidal fuse plates is categorized into three groups in terms of the thickness of the plates.The fragility of the damaged state of RHD devices and the consequences functions are illustrated in Fig.9.
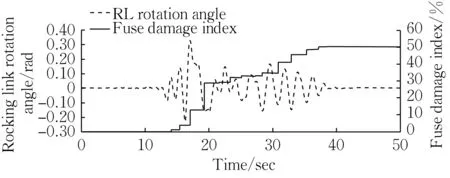
Fig.8 Chord rotation response of rocking link beam and damage index of fuse devices from a typical ground motion case

Fig.9 Fragility and Consequence functions of fuse devices in SCMBP systems
(3) Type and quantity of components
The quantity of the RHD devices at each story and the number of PT cables were calculated based on the design story strength and the energy dissipation ratio of interest.Some assumptions such as the aspect ratio of the rocking link (depth/length) and initial PT stress level in the PT cables (initial stress/yield stress) should be made for designing these components based on the analytical relationships.A practical value appropriate for a wide range of structural configurations should be selected for the required parameters.For example, the aspect ratio of the rocking link beam and the initial PT stress level in the cables were considered to be 0.4 and 0.3,respectively.
The type and quantity of nonstructural components were determined according to the normative quantities for the educational occupancy,story area, and the number of stories.The nonstructural components whose fragility has not been added to the FEMA P-58 yet (such as fixed casework, fume hoods, and lab plumbing fixtures)are not included in the assessment.The list of susceptible nonstructural components with the normative quantities and dispersion is presented in Tab.2.
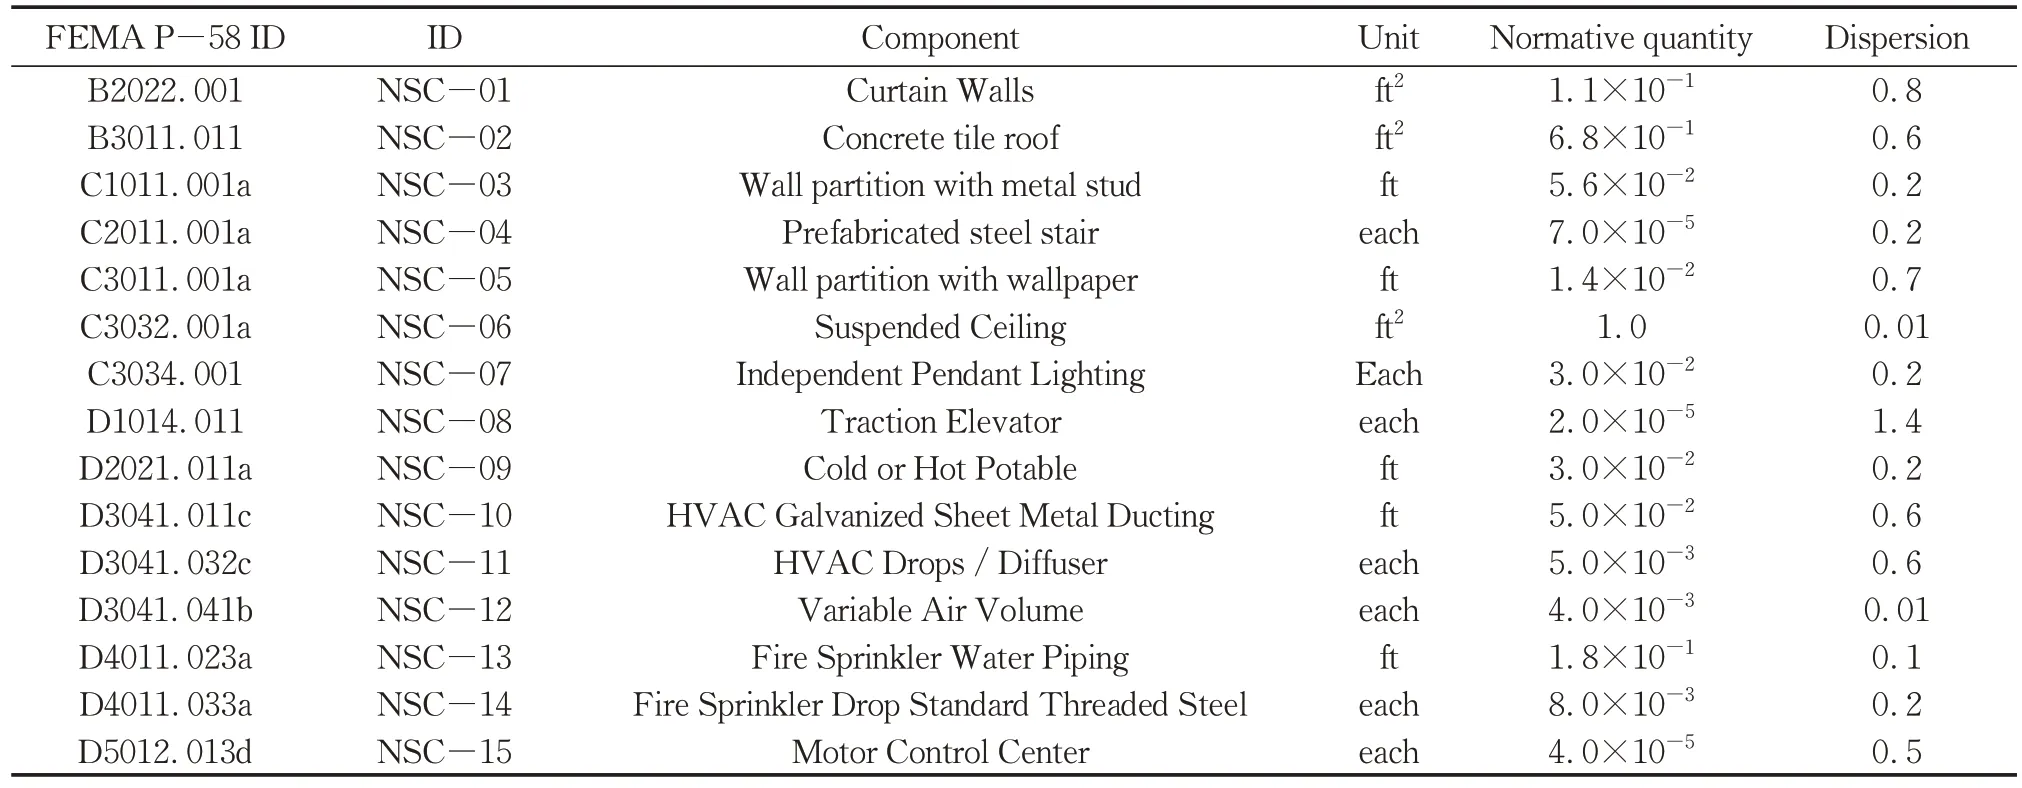
Tab.2 Type and normative quantities of susceptible nonstructural components in educational occupancy buildings (adapted from FEMA P-58)
2.1 Damage and loss assessment
The damage and loss assessment of the buildings was performed at nine different intensities from PGA=0.2gto PGA=1.0gwith 0.1gintervals.It should be noted that the largest intensity of 1.0g PGA almost agrees with the maximum value of MCEGof the area as shown in Fig.6.The probabilistic seismic loss of each building was obtained by performing 1 000 realizations at each intensity.Since the collapse condition of the SCMBP systems requires a separate study, this damage state was not included in the loss assessment.Excluding the collapse case from the analysis will not have a significant impact on the results since it is expected to be a very rare case up to the largest considered intensity for such a high-performance system.The median residual IDR of 1.0% with a dispersion of 0.3 was considered as the fragility of irreparable condition as suggested by FEMA P-58.The entire framework was performed considering three different values for energy dissipation ratio, β, equal to 0.5,1.0, and 1.5 to study the effect of this key parameter of self-centering systems on the regional seismic resilience of the buildings equipped with suchsystems.
The repair cost and repair time resulting from the probabilistic damage and loss assessment were normalized to the building replacement cost (BRC)and replacement time (BRT), respectively.The consequence functions of FEMA P-58 are based on the prices of the Year 2011.Therefore, the replacement cost should be adjusted for the same period.In this study, the unit replacement cost of the buildings was considered to be US$2690 per square meter (US$250 per square foot) which is proposed within the FEMA P-58 documentation.It should be noted that the unit of repair time and building replacement time is worker.day.The building replacement time could be estimated based on the replacement cost by assuming the values of the labor cost percentage (LCP) and worker daily cost(WDC) as BRT= BRC × LCP/WDC.In this study, the LCP and WDC were considered to be 50% and US$680 per worker.day which agrees with the FEMA P-58 background documentation.
2.2 Results and discussion
In this section, the intensity-based probabilistic damage and loss assessment results of 1890 school buildings with portable self-centering EBF modular panels are presented to demonstrate the digital twin model for seismic resilience.Fig.10 shows the regional-level building inventory’ s cumulative distribution function (CDF) of the normalized mean repair cost (NRC) and repair time (NRT) of the regional-level building inventory assuming the parallel strategy for each energy dissipation category at different intensity levels.For all β categories, the uncertainty increases slightly with the intensity level up to IM-6 (PGA = 0.7g) with a median regional NRC and NRT less than 0.1.For higher IMs (IM-7 to IM-9), the large difference between the repair cost of the repairable cases and the BRC of the irreparable cases increases the uncertainty and affects the distribution of the CDF.
The regional median NRC, NRT, and probability of irreparability (PIR) with one standard deviation at different IMs are presented in Fig.11.The least and largest NRC and NRT are related to theβ=1.5 andβ=0.5 categories, respectively.The larger loss ofβ=0.5 category is due to the low energy dissipation which would lead to larger EDPs.Up to IM-7(PGA=0.7g), the regional PIR is less than 1.5% for allβcategories which increases to 18%, 14%, and 13% forβ=0.5, 1.0, and 1.5 categories at the largest intensity (PGA=1.0g),respectively.Up to IM-5, theβ=0.5 andβ=1.0 categories have almost a zero PIR due to large restoring force and lower probability of plastic deformation in the PT cables up to this hazard level,but the PIR ofβ=1.5 category is slightly larger(<0.2%) due to lower restoring force and the fact that the residual drift might be resulted from the plastic deformation of the fuse plates (which might be counteracted after replacing the fuse plates).From IM-5 to IM-9, the PIR increases with different rates,asβ=0.5 has the largest rate,β=1.5 has the least rate and at the largest intensity, theβ=1.5 category has the least PIR due to the lower energy dissipation capacity that results in a larger IDR and correspondingly the larger probability of plastic deformation in the PT cables.Fig.12a shows the regional mean contribution of repairable and irreparable cases to the total repair cost with one standard deviation for theβ=1.0 category.Irreparable cases almost have no contribution to the repair cost up to IM-6 where their contribution starts to increase linearly up to 46% at the largest intensity.For instance, according to Fig.11, the regional NRC ofβ=1.0 category is 21% at IM-9 where 46%of it (9.7% NRC) is the contribution of the irreparable cases, and 54% of it (11.3% NRC) is the contribution of reparable cases.In Fig.12b the contribution of the irreparable cases to the total repair cost of all β categories is compared whereβ=1.5 andβ=1.0 have the largest and the least contribution of the irreparable damages to the total repair cost/time,respectively.It is seen that up to IM-5, irreparable damages almost do not have any contribution to the NRC/NRT forβ=0.5 andβ=1.0 categories; but forβ=1.5, the slight contribution of the irreparable cases is observed, which is mainly resulted from possible residual drifts due to the plastic deformation of the fuse devices for this large energy dissipation category.However, the repair cost/time of this category is less than 4% up to IM-5.
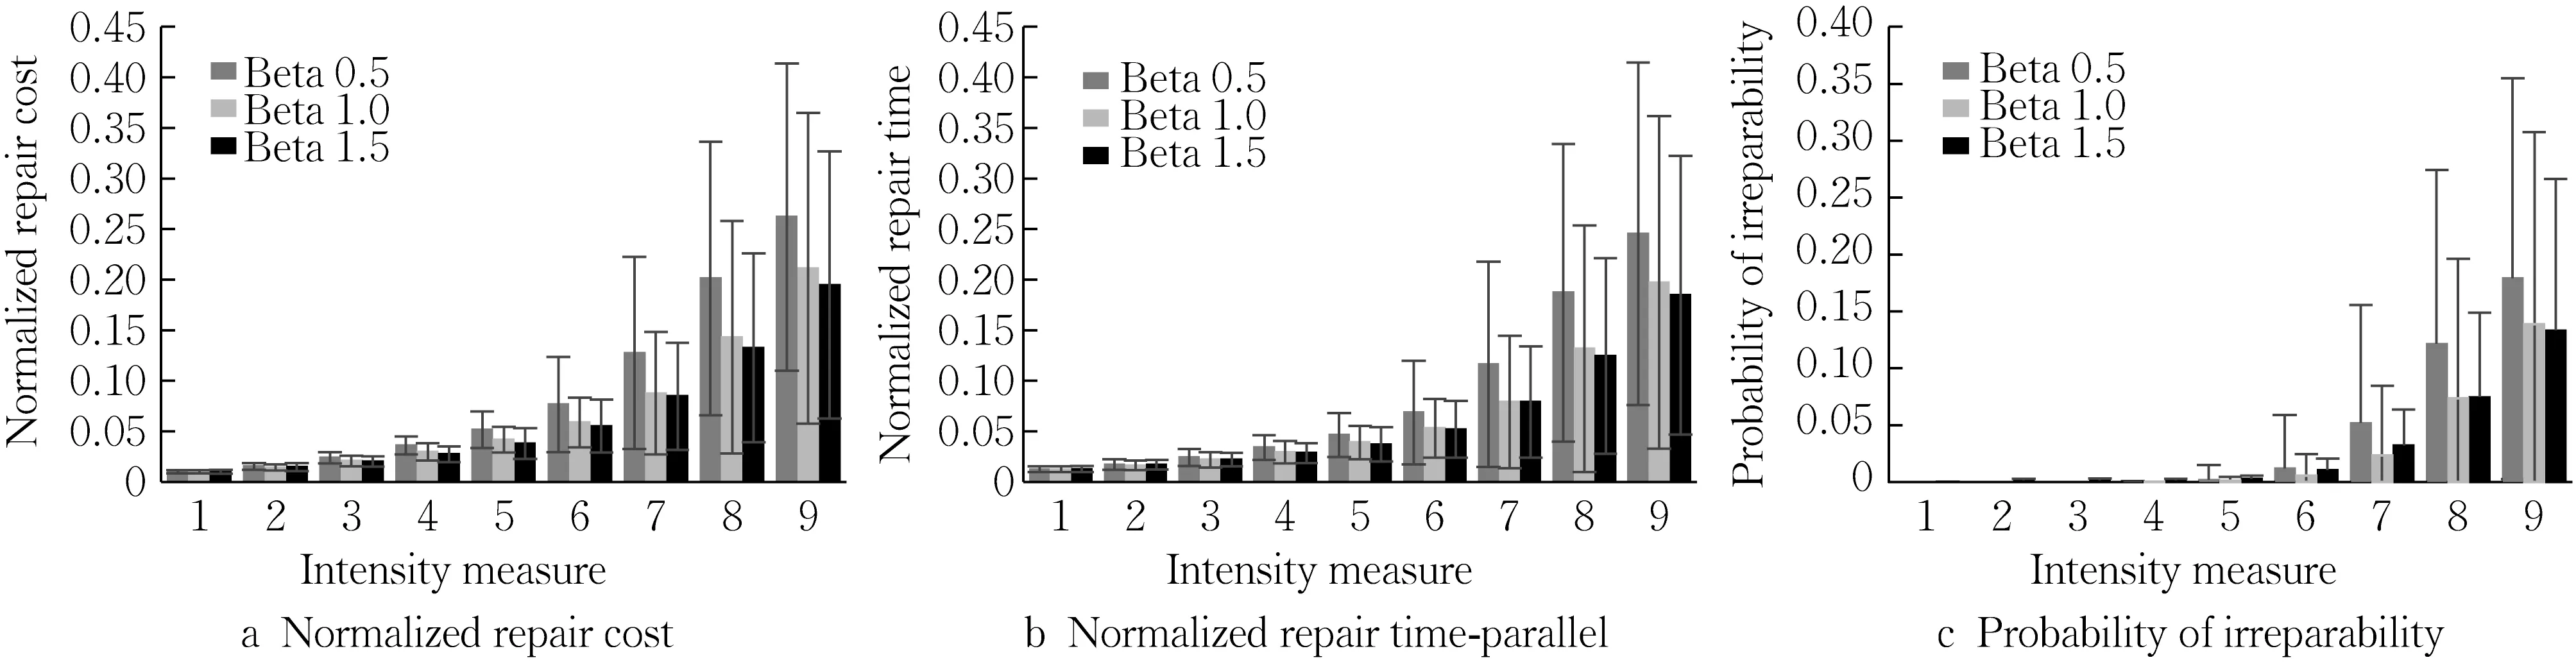
Fig.11 Regional mean value of resilience metrics with one standard deviation at different intensity levels

Fig.12 Regional mean contribution of possible damage scenarios to total repair cost
The regional mean contribution of the components of buildings to the repair cost and repair time (component repair cost/total repair cost)conditioned on the repairable cases are presented in Fig.13.The component NSC03 (wall partition with metal stud) has the largest impact on the regional repair cost.It can be observed that the relative contribution of the components to the regional repair cost and repair time varies with the intensity level.The relative contribution of components NSC01(curtain walls) , NSC04 (wall partition with wallpaper), and NSC06 (cold or hot potable)increase with IM, while the contribution of some other components such as NSC02 (concrete tile roof), NSC05 (suspended Ceiling), and NSC08(HVAC drops/diffuser) are inversely proportional to the IM.For example, component NSC01 (curtain walls) has a negligible contribution up to IM-3 (<0.5%) where its contribution starts to increase up to 26% at IM-9.On the other hand, NSC02(concrete tile roof) has a 33% contribution at IM-1 which reduces to 7% at IM-9.Some components such as NSC07 (HVAC galvanized sheet metal ducting),NSC09 (variable air volume) , and NSC10(independent pendant lighting) have an insignificant contribution regardless of the intensity.Moreover, as expected, the structural component has a negligible contribution to the repair cost of repairable cases since the replacement of the fuse devices is usually needed at large intensities which results in a very large IDR generally followed by a residual drift and irreparability of the building.To provide more comprehensible analysis results, typical visualizations of the damage and loss assessment of the school buildings in the selected study area near San Francisco, California with SCMBP buildings in ArcGIS pro are presented in Fig.14.For theβ=1.0 category the NRT(parallel strategy) at IM-06 and PIR at IM-09 of the school buildings are shown in Fig.14a and b and the 3D visualizations of the buildings symbolized for illustration of NRC at IM-06 and NRT at IM-09 are illustrated in Fig.14c and d.
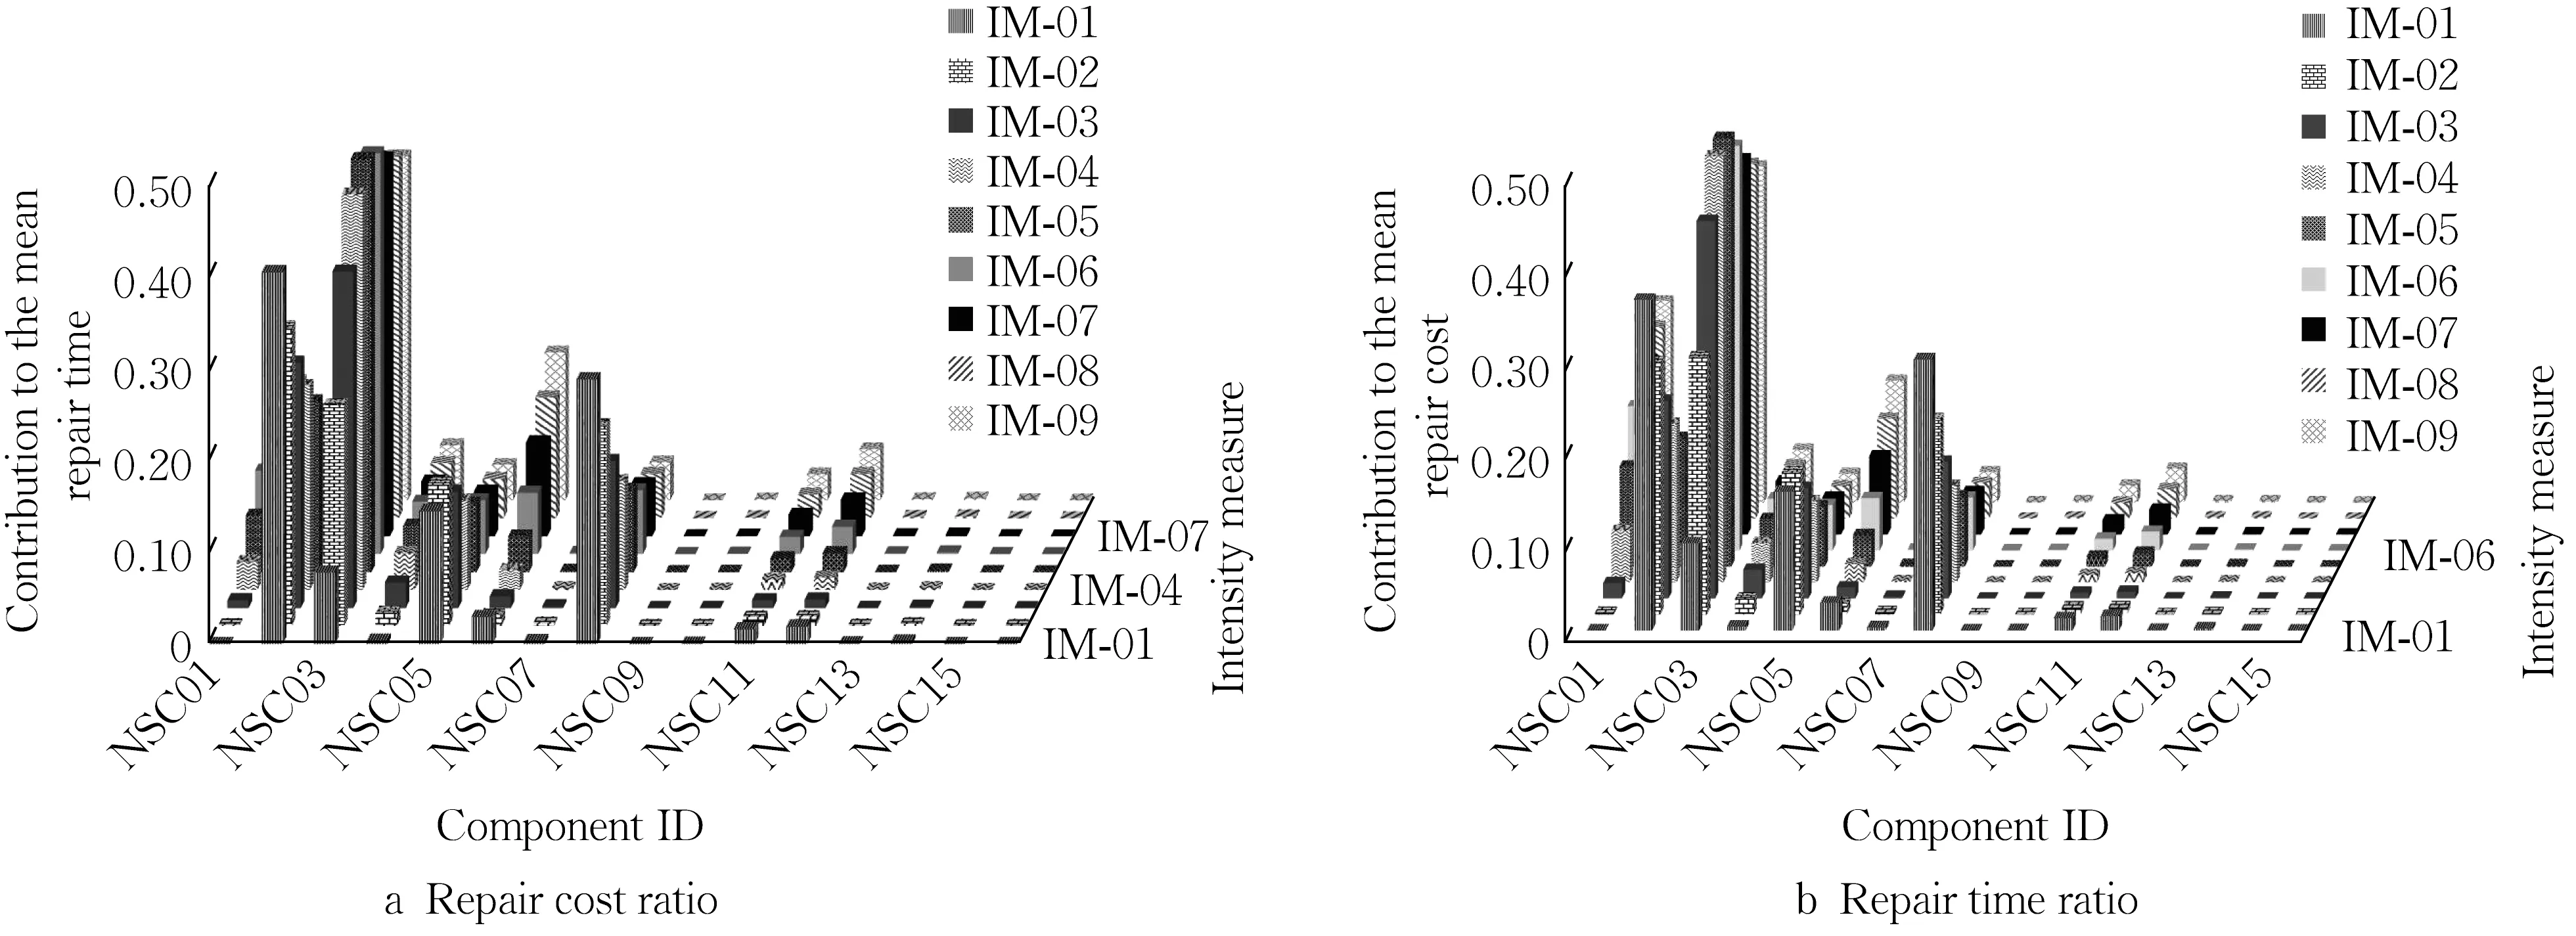
Fig.13 Regional mean contribution of the components of buildings to repair cost/time conditioned on repairable cases
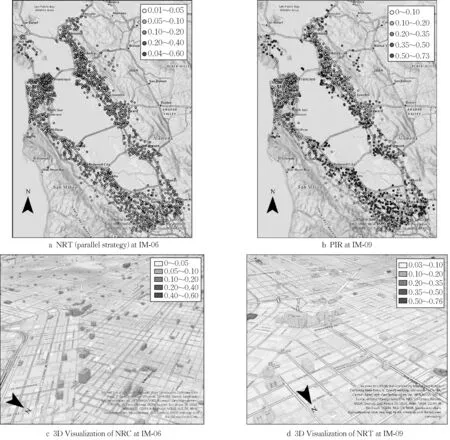
Fig.14 Sample visualization of resilience metrics of β =1.0 category of SCMBP school buildings in ArcGIS Pro
The building-specific outputs of damage and loss assessment were generated and could be accessed for further investigation in the context of tables and graphs.Fig.15 shows the CDF of the seismic losses of a typical individual building at IM-6 (PGA=0.7g)for differentβcategories.Fig.16a presents the probability of each possible damage scenario at different IMs, and Fig.16b illustrates the contribution of each story to the mean repair cost conditioned on repairable cases, and the contribution of the components of the building to the mean repair cost and time at IM-7.

Fig.15 Cumulative distribution function (CDF) of seismic losses of a typical individual building at IM-6(PGA=0.7g)

Fig.16 Simulation outputs of a typical building (β =1.5 category)
3 Conclusion
A digital twin model for intensity-based regional seismic resilience assessment of school buildings was developed in this study.The framework of this digital twin model integrates several Python-written software packages including OpenSeesPy for performing RHA, Pelicun for probabilistic seismic loss assessment, and ArcPy for visualization of the results.The FEMA P-58 methodology was adopted for component-level seismic loss assessment of the buildings.A case study was conducted for a total of 1 890 school buildings in the study area near San Francisco California at nine IMs with such SCMBP systems considering three values, 0.5, 1.0, and 1.5, for energy dissipation ratio,β.To reduce the computing cost of large-scale RHA at the regional level, a nonlinear spring model for simulating the flagshape hysteresis of the SCMBP system was developed which could be generalized to other selfcentering systems with a similar behavior.Partial or total PT loss due to the yielding of the PT cables which might result in a large residual drift was considered in the numerical model.The results were presented in different graphical contexts with the main findings and conclusions as follows:
(1) The least regional seismic loss is related to theβ=1.5 category with NRC= 19.5% and NRT=18.5% at the largest intensity (PGA=1.0g).Almost 46% of this loss is due to the repair cost of the nonstructural components and 54% is the contribution of irreparable cases.The regional NRC and NRT of this category for IMs with PGA ≤ 0.6gis less than 4% which is mainly due to the repair cost of the nonstructural components.
(2) Theβ=0.5 andβ=1.0 categories have almost zero PIR up to PGA ≤ 0.6gdue to a large restoring force and a lower probability of plastic deformation in the PT cables up to this hazard level.For higher IMs, theβ=1.5 category has the least PIR (13% at PGA=1.0g) due to larger energy dissipation that would control large IDRs, and theβ=0.5 category has the largest PIR (18% at PGA=1.0g).
(3) The regional seismic losses are mainly caused by the nonstructural components at IMs with PGA ≤ 0.5gand the contribution of the irreparable cases to the seismic losses is negligible for smaller intensities.At the largest intensity (PGA=1.0g),the irreparable cases also contribute to regional seismic losses.Structural components of such SCMBP systems almost do not contribute to the building losses, since only the replacement of the fuse devices is usually required at very large IDR, at which the building is very likely to have irreparable damage due to an excessively large residual drift.
(4) The relative contribution of each nonstructural component to the total loss of nonstructural components varies with intensity.For some components such as curtain walls, the relative contribution increases with intensity while for some components such as concrete tile roofs, the relative contribution decreases.Some components such as variable air volume have a negligible contribution to the seismic losses.
(5) Considering the results of the regional seismic loss assessment, theβ=1.5 category is the favorable design with the least regional loss and the lowest required restoring force compared to other categories.Theβ=0.5 category has the largest seismic losses and PIR with the largest required restoring force.Therefore, this case is not counted as a good design alternative.Theβ=1.0 category is still a competitive case since it has the least PIR up to IM-8 despite the seismic loss being marginally larger.
(6) The building response dataset created by this study can be used to train a machine learning model and regional resilience can be quickly estimated from such an ML model with measured ground motion data and structural response data.
While the developed digital twin model offers valuable insights into seismic resilience assessment,the results rely on the accuracy and availability of input data, which may vary depending on the level of detail and quality of the available information.In light of the promising results obtained in this study, future work will focus on leveraging ML algorithms to estimate seismic damages by measuring structural responses, such as acceleration response.These advancements will enhance the practicality and applicability of the digital twin model developed in this study, facilitating more accurate predictions and enabling proactive decision-making for enhancing the resilience of existing structures.
作者贡献声明:
REZVAN Pooya: 数字仿真模型建立和运算、数据整理和分析、初稿撰写、仿真结果可视化。
张云峰:理论框架建立、研究方法构思、数字孪生模型建立、论文撰写和修改。
猜你喜欢
高教探索(2020年3期)2020-04-07
课外语文·下(2018年11期)2018-12-16
黑龙江民族职业学院信息(2017年6期)2018-01-03
紫光阁(2017年8期)2017-08-09
关东学刊(2017年11期)2017-05-30
漯河职业技术学院学报(2017年2期)2017-05-18
汉语世界(2017年1期)2017-03-07
苏州工艺美术职业技术学院学报(2016年4期)2016-04-16
中学课程辅导·教师通讯(2014年23期)2015-06-17
———动力工程系
西安航空学院学报(2014年4期)2014-07-13