山东沿海不同工业废水源中微塑料的赋存特征
2024-01-13 05:51李晓亚梁俊华朱明亮李庆洁孙晓霞
海洋科学 2023年10期
李晓亚, 刘 娟, 郑 珊, 梁俊华, 朱明亮, 李庆洁, 孙晓霞
山东沿海不同工业废水源中微塑料的赋存特征
李晓亚1, 刘 娟1, 郑 珊2, 梁俊华2, 朱明亮2, 李庆洁2, 孙晓霞2
(1. 青岛科技大学 环境与安全工程学院, 山东 青岛 201210; 2. 中国科学院海洋研究所 胶州湾国家野外科学观测研究站, 山东 青岛 266071)
微塑料(MPs)作为一种普遍存在的新污染物受到广泛关注, 工业来源被认为是受纳河流和邻近海域中微塑料的重要来源, 但是关于工业来源废水中的微塑料污染情况并不明确。本文系统研究了山东沿海5个行业代表性企业进水和出水中微塑料的赋存特征, 结果表明, 工业废水源内部污水处理系统对微塑料的去除效率较低, 平均去除率仅为59.86%, 沿海工业废水是近海环境中微塑料污染的潜在重要来源。不同类型工业中纺织印染业的进、出水微塑料含量最大, 平均丰度分别为84.8 个/L和19.6 个/L, 纸塑制造厂、化工厂和船舶工业的污水中微塑料丰度相近, 进水中微塑料丰度在32.0~37.2 个/L之间, 出水中微塑料丰度在10.8~14.6 个/L之间, 金矿厂的进水中微塑料丰度最低, 为23.9 个/L, 出水微塑料丰度为17.6 个/L。不同工业源进水中微塑料在形状和成分上相似, 在尺寸和颜色上存在行业差异, 纤维(占比范围61.46%~84.48%)是主要形状, 聚乙烯(PE)(53.48%~76.19%)是主要成分。工业源出水中微塑料主要形状为纤维(61.46%~91.06%), 主要颜色为蓝色(41.67%~58.22%), 主要成分为PE(16.22%~67.83%), 出水中微塑料尺寸存在行业差异, ≤300 μm的微塑料平均占比最高, 为28.67%, 占比范围为23.96%~35.19%。工业出水中微塑料特征与海洋中微塑料特征高度契合, 再次证明了工业污水对海洋微塑料污染的重要贡献。本研究通过揭示典型海湾周边代表性行业的工业污水中微塑料浓度与特征, 为海洋微塑料的源汇特征、迁移与防控研究提供科学依据。
山东沿海; 微塑料; 工业废水; 赋存特征
微塑料是尺寸小于5 mm的微小塑料颗粒[1], 在大气、水体、沉积物等环境介质中均有检出。微塑料能够经过摄食、呼吸、表皮接触等方式进入生物体, 并通过食物链累积, 对生物造成不利影响。微塑料的机械效应会对生物造成物理损伤, 导致消化道堵塞, 苯基乙胺、双酚A、溴化阻燃剂等添加剂的浸出会导致生物的氧化应激反应、代谢紊乱、内分泌失调等风险升高。此外, 微塑料还容易吸附疏水性有机污染物和重金属, 造成复合污染。目前在人类胎盘[2], 肺部样本[3]、血液[4]甚至血栓[5]中都检测出了微塑料, 对人类健康造成隐患。
海湾是海洋的重要组成部分, 由于频繁的人类活动和工业生产, 相比海洋其他区域, 海湾的微塑料污染更易受陆源排放的影响。工业污水是经常被提到的微塑料污染来源, 工业区域内通常含有更高的微塑料水平。例如, Chen等[6]调查了西安市区、杨凌市和咸阳市土壤中微塑料污染情况, 发现土壤中微塑料含量与城市工业化水平呈正相关, Tunali等[7]的研究也显示工业区内土壤中微塑料平均值为4 488 items/kg,高于住宅区微塑料水平, 中国绍兴纺织工业区地表水微塑料丰度范围为2.1~71.0 items/L, 沉积物中微塑料丰度范围为16.7~1 323.3 items/kg dw, Deng等[8]将在工业区内检测到的高水平微塑料污染归因于纺织工业生产和贸易活动, 塑料生产区地表水和沉积物中微塑料污染则更加严重[9]。然而关于沿海地区工业微塑料污染情况的研究非常有限, 部分工业污水会通过污水处理厂进一步处理, 但也有相当一部分工业污水经过工厂内部污水处理系统处理后直接排海, 因此需要对工业来源中微塑料污染情况进行系统研究。为此, 本研究选取了山东沿海5个代表性行业, 揭示典型海湾周边工业污水来源的微塑料浓度与特征, 比较不同行业微塑料排放的异同, 为海洋微塑料的源汇特征、迁移与防控研究提供科学依据。
1 材料和方法
1.1 采样点
根据GESAMP发布的微塑料污染行业(表1), 初步判定海湾微塑料污染的重点行业可能为污水处理厂、纺织行业、塑料加工制造业、食品饮料行业等, 基于对山东省微塑料污染主要行业来源的认知基础, 参考山东省重点行业技术发展白皮书系列、地理信息公开服务平台资料以及水环境重点排污单位信息, 筛选了莱州湾、胶州湾沿岸5个纺织印染厂(TP&D)、3个纸塑制造厂(P&PM)、1个金矿厂(GM)、1个化工厂(CP)和1个船舶工厂(SI)为研究对象, 检测企业废水处理过程中微塑料的丰度、组成与分布, 企业相关信息见表2。
1.2 样本采集
2020年3月在每个企业收集废水, 在企业污水处理系统的进水口和出水口分别采样。采样方法选择易于操作、对环境污染小的人工直接采样法, 现场使用不锈钢铁桶在样品池中采集水样, 置于1 L玻璃采样瓶中, 使用无水乙醇固定, 每个采样点采集3个平行样, 带回实验室进行后续处理。
表1 微塑料污染来源行业(修自GESAMP, 2016)
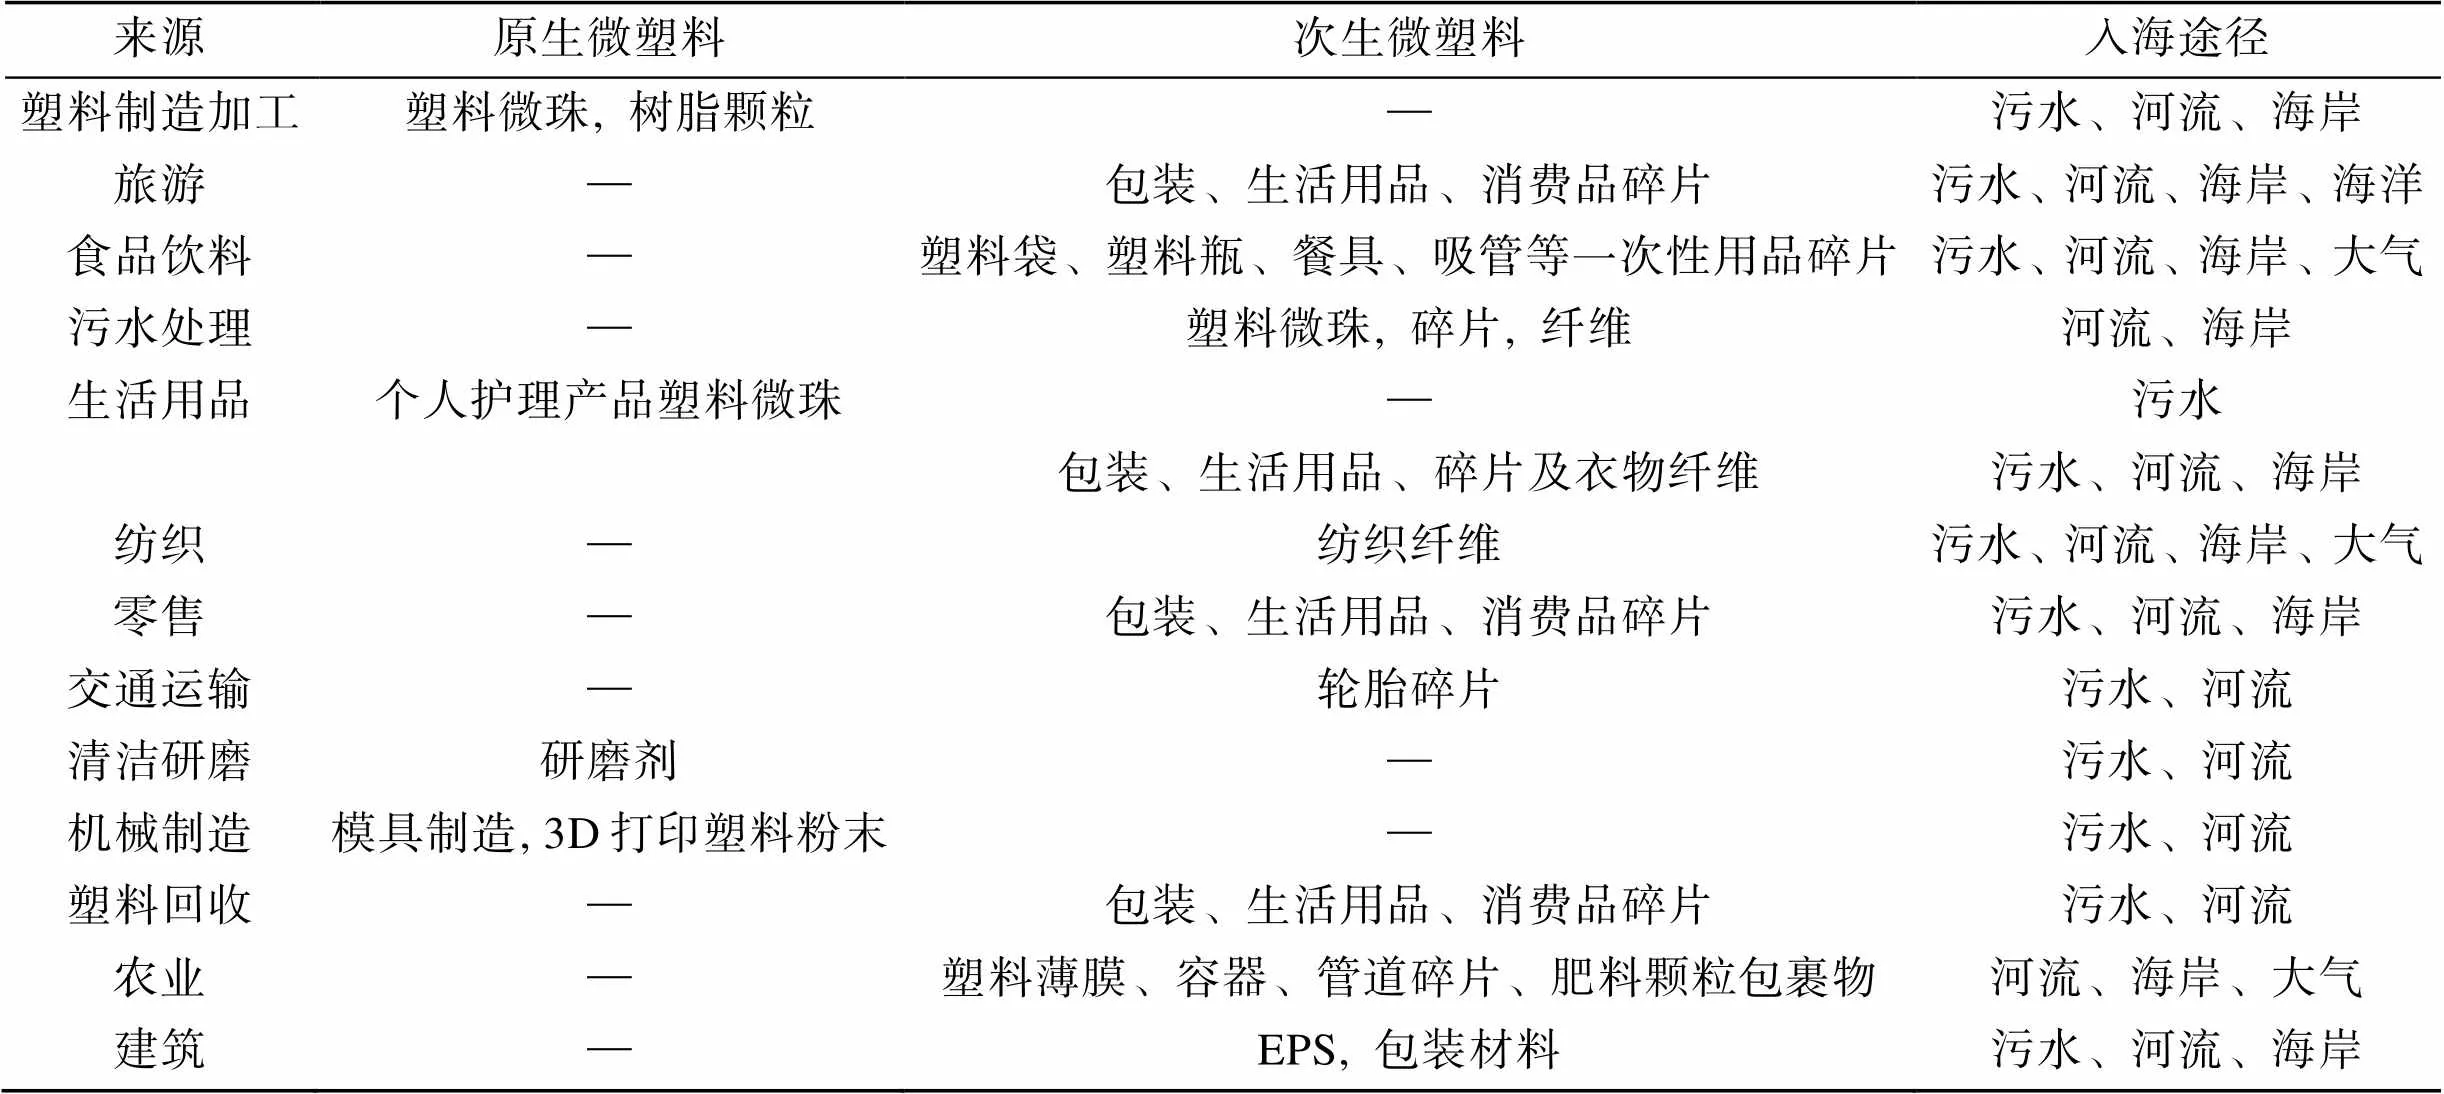
Tab.1 Industries contributing to microplastic pollution (revised from GESAMP, 2016)

表2 企业相关信息
1.3 预处理
根据Naji等[10]和Zhang等[11]对废水的处理方法, 使用碱消解法处理样品, 将微塑料从污水杂质中分离出来。首先量取1 L水样, 依次通过500 μm和20 μm的不锈钢分层网筛, 使用纯水冲洗容器3次, 保证样品全部转移至筛网, 将20 μm筛网上截留物质转移到50 mL具塞锥形瓶, 加入10% KOH溶液, 在60 ℃恒温条件下消解24 h。然后将消解后的溶液转移到20 μm的不锈钢网筛, 使用纯水冲洗样品, 去除碱液, 将筛网上的截留物质全部转移至500 mL烧杯中。最后, 使用饱和氯化钠溶液浮选[12], 静置过夜后, 上清液使用GF/C滤膜过滤, 多次浮选保证塑料颗粒全部分离出来, 将滤膜置于洁净的玻璃培养皿, 自然晾干。
1.4 观察和鉴定
将样品置于体式显微镜(Stemi SV11, Zeiss, Shanghai, China)下对微塑料进行识别、计数、筛选和拍照, 将所有疑似微塑料拍照, 根据颜色和形态进行计数和分类, 利用拍照软件(Carl Zeiss Axio Vision4.9.1SP2)测量微塑料尺寸, 根据Sol等[13]统计的污水处理厂中微塑料尺寸的划分标准, 将微塑料尺寸划分为6个等级, 分别为≤300 μm、300~500 μm、500~1 000 μm、1 000~2 000 μm、2 000~5 000 μm、>5 000 μm。
使用显微傅里叶变换红外光谱仪(μFTIR, PerkinElmer Spectrum Spotlight 400, PerkinElmer Inc., USA)检测样品的化学成分, 分辨率为16 cm–1, 光谱范围设置为657~4 000 cm–1, 所得图谱与标准塑料光谱对比分析, 确定微塑料成分。共鉴定了1 362个疑似微塑料样品, 占所挑选的疑似微塑料总数的58.27%。
1.5 质量控制
为了避免外来微塑料污染样品, 尽量使用玻璃、金属器材, 实验设备在使用前用蒸馏水清洗, 试剂在使用前用GF/C滤膜过滤并用锡箔纸覆盖。在镜检过程中, 门窗关闭, 操作人员穿戴棉质实验服和无尘手套, 尽量减少移动, 避免扰动气流引起外来微塑料干扰[14]。
1.6 统计分析
使用SPSS.26软件进行数据分析, 不同行业污水中微塑料丰度和特征的对比采用Kruskal-Wallis test, 检验的显著性水平为=0.05。使用Origin.2022软件作图。
2 结果
2.1 不同工业废水源中微塑料丰度
图1展示了显微镜下微塑料的图像, 根据微塑料形状分为纤维、碎片和小球。对不同企业废水进行微塑料检测, 结果显示废水中微塑料检出率为100%, 如图2所示, 纺织印染厂进水中微塑料丰度范围为37.0~222.7 个/L平均值为84.8 个/L, 出水中微塑料丰度范围为13.0~33.0 个/L, 平均值为19.6 个/L, 微塑料去除率在34.10%到85.18%之间, 平均去除率为59.86%。纸塑制造业进水中微塑料丰度范围为10.3~61.3 个/L, 出水中微塑料丰度范围为2.7~18.0 个/L, 平均值为10.8 个/L, 微塑料去除率范围为58.18%~73.64%, 平均去除率为67.49%。金矿厂进水微塑料丰度为23.9 个/L, 出水微塑料丰度为17.6 个/L, 微塑料去除效率为26.24%。化工厂进水微塑料丰度为37.2 个/L, 出水微塑料丰度为14.6 个/L, 微塑料去除效率为60.85%。船舶工厂污水进水微塑料丰度为32.0 个/L, 船舶废水不经过处理直接排放。
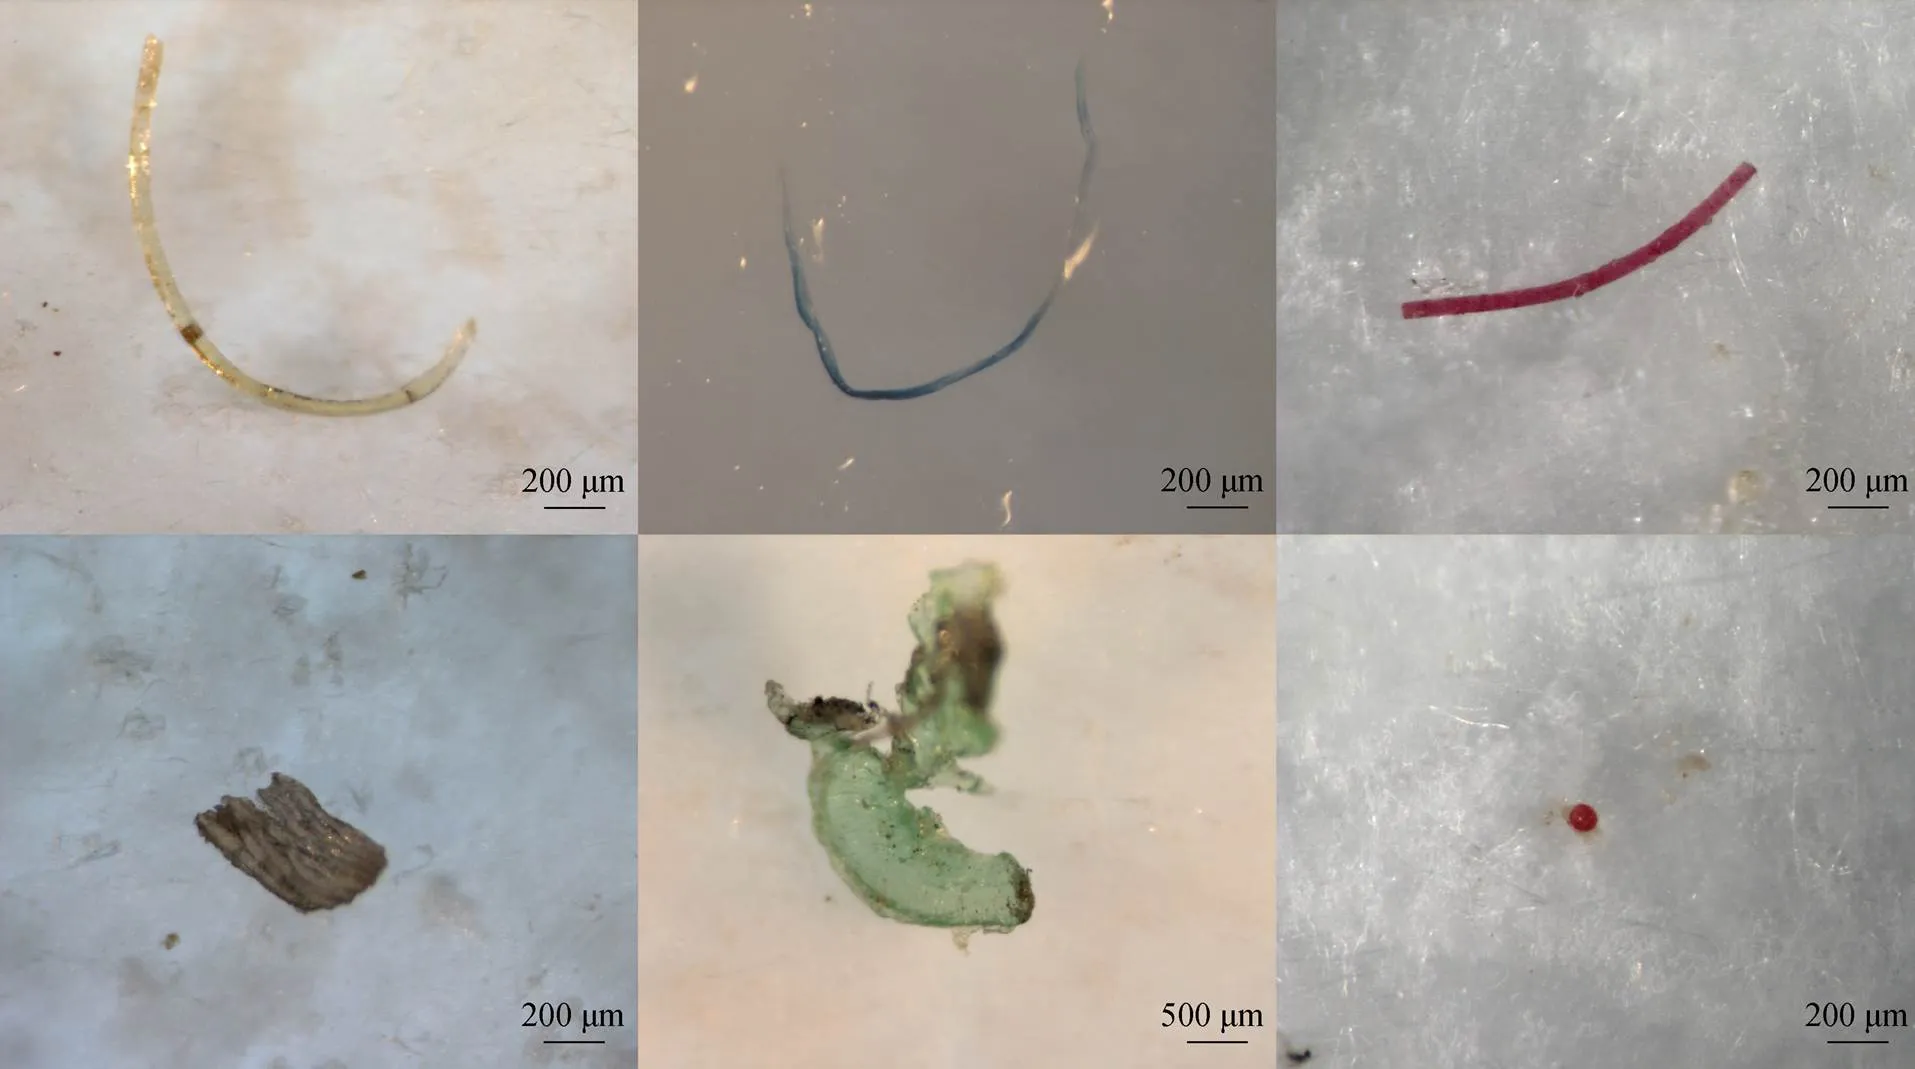
图1 工业污水中微塑料的显微图像
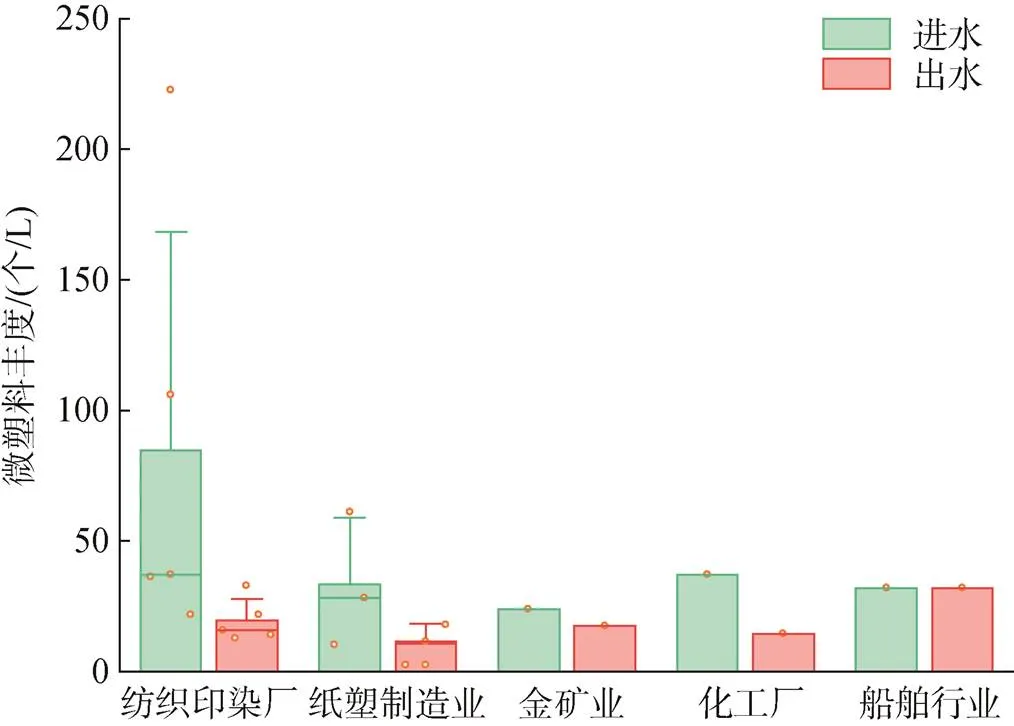
图2 不同工业废水源污水中微塑料丰度
2.2 不同工业废水源中微塑料特征
不同工业废水源进水和出水中微塑料的形状、尺寸、颜色和成分特征如图3所示, 不同工业污水中微塑料均以纤维状为主, 纤维状微塑料占比范围为61.46%~84.48%, 纺织印染厂污水中纤维状微塑料含量最高, 其次是碎片状, 小球最少。所调查企业污水中共检测出7种颜色的微塑料, 其中纺织印染厂、化工行业和船舶工业以蓝色为主, 进水占比分别为59.21%、32.33%和41.67%, 纸塑制造业和金矿业则以绿色为主, 进水中绿色微塑料占比分别为37.92%和41.30%。在大小组成上, 化工行业进水中1 000~ 2 000 μm尺寸范围的微塑料占主导地位, 占比35.34%, 船舶工业污水中500~1 000 μm的微塑料含量最高, 占比26.04%, 其他行业以≤300 μm为主, 占比范围为31.87%~39.74%。通过使用μFTIR鉴定疑似微塑料成分, 检出不同行业中微塑料主要成分为PE, 占比范围为53.48%~76.19%, 其次为PET, 占比范围为0.00%~37.58%。工业出水中微塑料形状、聚合物类型、大小和颜色分布, 与进水特征分布相似。在形状上出水中微塑料以纤维为主, 占比范围为61.46%~91.06%, 平均占比82.11%。在颜色上均以蓝色为主, 占比范围为41.67%~58.22%, 平均比例为49.30%。出水中微塑料在大小组成上存在行业差异, 纺织印染厂和化工厂以≤300 μm为主, 占比分别为32.60%和35.19%。纸塑制造业出水中微塑料以500~ 100 μm为主, 金矿业出水中微塑料以300~500 μm为主, 总体上, ≤300 μm的微塑料平均占比最高, 为28.67%, 占比范围23.96%~35.19%。在成分上, 出水中微塑料成分以PE为主, 占比范围为16.22%~ 67.83%, 平均占比50.95%, 其次为PET, 占比范围为0.00%~47.06%, 平均占比为28.81%。值得注意的是, 金矿行业出水中聚丙烯占比最大, 但是在进水中并未检测出聚丙烯, 这可能是由于污水处理过程中存在微塑料的输入, 比如构筑物塑料制品的老化磨损, 污水处理中经常用到聚丙烯等材质的塑料填料用于挂膜、沉淀和吹脱, 曝气器通常也是塑料材质, 而且金矿污水中泥沙等杂质含量高, 对装置的摩擦严重, 增加了出水中的聚丙烯的比例。
3 讨论
3.1 不同工业废水源中微塑料丰度
本研究调查了纺织印染厂、纸塑制造厂、金矿厂、化工厂和船舶工厂污水中微塑料的污染情况, 发现山东沿海工业废水出水中微塑料丰度范围为2.7~ 33.0 个/L, 平均丰度为17.7 个/L, 与表3中污水处理厂的出水浓度相比, 工厂出水中微塑料丰度中等偏高, 是微塑料的潜在重要来源。根据自然资源部发布的《2021年中国海洋生态环境状况公报》[15]显示, 2021年全国458个日排污水量大于100吨的直排海污染源, 污水排放总量为72.8亿吨, 综合排污口污水排放量最大, 其次为工业源, 生活污染源排放量最小, 工业源污水对海洋微塑料污染有重要贡献。工厂出水中较高的微塑料丰度可能是由于工业内部污水处理系统的低去除效率导致的, 工厂平均去除效率仅59.86%, 远低于表3中污水处理厂的去除效率, 未来需要进一步采取相应的措施和应对策略, 提高工业内部污水处理系统去除微塑料的能力。

图3 不同工业废水源进水和出水中微塑料的形状、尺寸、颜色和成分分布特征
注: TP&D表示纺织印染厂, P&PM表示纸塑制造厂, GM表示金矿厂, CP表示化工厂, SI表示船舶工厂

表3 污水处理厂中微塑料污染相关研究数据
通过比较纺织印染厂、纸塑制造厂、金矿厂、化工厂和船舶工厂污水中微塑料的污染情况, 发现纺织印染业是产生微塑料最多的行业, 进水中平均微塑料丰度为84.8 个/L, 是其他行业的2.3~3.4倍, 出水中平均微塑料丰度为19.6 个/L, 是其他行业的1.1~1.8倍, 这主要是由于纺织品全生命周期都会释放微塑料, 包括转杯纺纱、裁剪、烧毛、退浆等过程, 而且纺织印染行业是全球耗水量第二的行业, 废水产生量占全球废水的20%, 需要对纺织印染厂污水中微塑料进行重点防控。除纺织印染厂外, 化工厂污水中微塑料含量也较高, 塑料是石油化工产品, 化工厂微塑料可能来自塑料生产过程, Wang等[36]的研究也显示化工行业污水中微塑料水平显著高于电镀行业, 化工厂中微塑料可能来自化工厂原料。纸塑制造行业和船舶行业进水中微塑料水平与化工厂相近, 纸塑制造原料和产品表面修饰, 可能是纸塑行业污水中微塑料的来源[37], 船舶工业中建造、清洁和修理船舶的污水含有大量油漆、涂料、防滑粉和研磨材料, 这可能是船舶废水中微塑料的来源[38]。金矿行业微塑料水平最低, 为23.9 个/L, 甚至低于雨水中微塑料水平[39], 采矿区微塑料来源并不明确, 污水中微塑料可能来自雨水、大气沉降和其他矿区作业, 比如矿物提取中冷却和通风过程导致塑料管道磨损产生微塑料[40], 但是金矿行业内部污水处理系统对微塑料的去除效率低, 为26.24%, 导致金矿行业出水中微塑料水平高。
3.2 不同工业废水源中微塑料污染特征差异
样品中发现了不同形状和颜色的微塑料如图1所示, 纤维是各工业污水中含量最高的形状, 纤维状微塑料含量均大于60%, 自然环境中通常也以纤维状微塑料为主。不同来源污水中微塑料在尺寸上存在差异, 化工厂和船舶工厂微塑料尺寸更大, 以300~500 μm和500~1 000 μm为主, 可能与产品生产使用的原始粒料特征和船体表面修饰有关。工业污水中微塑料以蓝色或绿色为主, 蓝色和绿色微塑料占比之和在53.38%到73.87%之间, 彩色微塑料占比均超过70%, 颜色表示原材料生产中使用了相关的化学药品, 这些化学物质会在生产、使用和磨损过程中释放, 产生安全隐患[41]。污水中微塑料聚合物类型以PE和PET为主, PE用于制造塑料袋、清洁及沐浴产品容器、塑料膜等, 需求量大且使用周期短, 据统计, 2017年全球塑料产量高达3.48亿吨, 其中PE生产量占29.8%。PET纤维是使用最广泛的合成纤维, 非纤维PET也广泛应用于包装行业, 两种塑料的多功能性可能导致其在各行业污水中广泛检出, 纺织厂中通常以PET纤维为主要成分[42-43], Dalla等[44]研究发现缝纫过程释放的纤维以PET和尼龙为主, 纺织工业区水体和沉积物中主要微塑料类型为彩色PET纤维[8], 而本研究的纺织厂中PET成分平均比例仅为28.02%, 因为本研究中纺织印染厂以棉等自然纤维为主, 纺织印染业中TP&D-1原料含有混纺化纤织物, 所以TP&D-1进水中PET纤维含量最高, 微塑料丰度也最大。在印染过程会使用大量染料和洗涤剂, 而洗涤剂中含有大量PE微塑料, 导致纺织印染厂进水中微塑料平均丰度最高。
工业污水出水中微塑料主要特征与海域微塑料特征高度契合, 排放的工业污水主要形状为纤维(平均比例为82.11%), 主要尺寸为≤300 μm(28.67%), 主要颜色为蓝色(49.30%), 主要成分为PE(50.95%)和PET(28.81%)。纤维是海洋环境中最主要的微塑料形状, 占黄海微塑料颗粒总量的40%以上[45], Kannankai等[46]对183篇海洋微塑料监测文献进行了荟萃分析, 结果显示PE(79.9%)是全球海洋环境和海洋水生生物中含量最丰富的聚合物。颜色会影响物质的光吸收率和紫外线透过率, 从而影响塑料的光降解, 与红色、黄色等颜色相比, 蓝色塑料吸收可见光能更强, 导致蓝色塑料更易破碎, 形成次生微塑料, 因此在环境中经常发现高比例的蓝色微塑料[47], Ugwu等[48]对132篇关于海洋脊椎动物摄入微塑料的文章进行了汇总分析, 结果显示主要微塑料类型为纤维(67.3%)、PE(27.3%)、蓝色(32.9%), <2 000 μm(73.6%), 这与工业排放污水中微塑料特征具有极高的相似性, 再次证明了工业污水对海洋微塑料污染具有重要贡献。
4 结论
微塑料污染分布广泛, 对海洋生物健康造成隐患, 工业污水是经常被提及但很少有研究的海洋微塑料污染来源。本研究系统地揭示了山东典型海湾沿岸5种类型工业污水中微塑料污染情况, 为海湾微塑料污染的工业来源提供基本依据。
(1)工业生产过程产生的大量微塑料进入工业污水, 由于工业内部污水处理系统对微塑料的去除能力普遍较低, 平均去除率仅为59.86%, 导致工业出水中微塑料含量丰富, 沿海工业废水源是海洋环境微塑料污染的重要贡献者, 从微塑料防控角度, 建议提高工业内部污水处理系统去除微塑料的能力, 从工业源头降低微塑料的释放。
(2)不同工业类型中, 纺织印染厂是微塑料污染最严重的行业, 出水中微塑料丰度是其他行业的1.1~ 1.8倍, 纺织印染行业废水产生量占全球废水量的20%, 加强对纺织印染业中微塑料污染的控制, 能够有效降低海洋环境中微塑料丰度。
(3)工业出水中纤维(82.11%)是最普遍的微塑料形状, 蓝色(49.30%)、≤300 μm(28.67%)是主要颜色和尺寸特征, PE(50.95%)是主要成分, 与近海环境中微塑料赋存特征高度契合, 再次印证工业废水源是海洋环境微塑料的重要来源。建议进一步加强工业污水排放微塑料与海域微塑料的源汇关系研究, 为微塑料的精准防控提供决策依据。
[1] THOMPSON R C, OLSEN Y, MITCHELL R P, et al. Lost at sea: where is all the plastic?[J]. Science, 2004, 304(5672): 838.
[2] RAGUSA A, SVELATO A, SANTACROCE C, et al. Plasticenta: First evidence of microplastics in human placenta[J]. Environment International, 2021, 146: 106274.
[3] JENNER L C, ROTCHELL J M, BENNETT R T, et al. Detection of microplastics in human lung tissue using μFTIR spectroscopy[J]. Science of The Total Environment, 2022, 831: 154907.
[4] Leslie H A, van Velzen M J M, Brandsma S H, et al. Discovery and quantification of plastic particle pollution in human blood[J]. Environment International, 2022, 163: 107199.
[5] WU D, FENG Y D, WANG R, et al. Pigment microparticles and microplastics found in human thrombi based on Raman spectral evidence[J]. Journal of Advanced Research, 2023, 49: 141-150.
[6] CHEN H, CHEN Y H, XU Y B, et al. Different functional areas and human activities significantly affect the occurrence and characteristics of microplastics in soils of the Xi'an metropolitan area[J]. Science of The Total Environment, 2022, 852: 158581.
[7] TUNALI M M, MYRONYUK O, TUNALI M, et al. Microplastic abundance in human-influenced soils in recreational, residential, and industrial areas[J]. Water, Air, & Soil Pollution, 2022, 233(11): 433.
[8] DENG H, WEI R, LUO W Y, et al. Microplastic pollution in water and sediment in a textile industrial area[J]. Environmental Pollution, 2020, 258: 113658.
[9] LI B W, SU L, ZHANG H B, et al. Microplastics in fishes and their living environments surrounding a plastic production area[J]. Science of The Total Environment, 2020, 727: 138662.
[10] NAJI A, AZADKHAH S, FARAHANI H, et al. Microplastics in wastewater outlets of Bandar Abbas city (Iran): A potential point source of microplastics into the Persian Gulf[J]. Chemosphere, 2021, 262: 128039.
[11] ZHANG D D, FRASER M A, HUANG W, et al. Microplastic pollution in water, sediment, and specific tissues of crayfish () within two different breeding modes in Jianli, Hubei province, China[J]. Environmental Pollution, 2021, 272: 115939.
[12] SUN J, DAI X H, WANG Q L, et al. Microplastics in wastewater treatment plants: Detection, occurrence and removal[J]. Water Research, 2019, 152: 21-37.
[13] SOL D, LACA A, LACA A, et al. Approaching the environmental problem of microplastics: Importance of WWTP treatments[J]. Science of The Total Environment, 2020, 740: 140016.
[14] MURPHY F, EWINS C, CARBONNIER F, et al. Wastewater treatment works (WwTW) as a source of microplastics in the aquatic environment[J]. Environmental Science & Technology, 2016, 50(11): 5800-5808.
[15] 中华人民共和国生态环境部. 2021年中国海洋生态环境状况公报[R]. [2022-05-22]. Ministry of Ecology and Environment of the People’s Republic of China. Bulletin on the State of China’s Marine Ecological Environment in 2021[R]. [2022-05-22].
[16] XU X, ZHANG L, JIAN Y, et al. Influence of wastewater treatment process on pollution characteristics and fate of microplastics[J]. Marine Pollution Bulletin, 2021, 169: 112448.
[17] JIANG J H, WANG X W, REN H Y, et al. Investigation and fate of microplastics in wastewater and sludge filter cake from a wastewater treatment plant in China[J]. Science of the Total Environment, 2020, 746: 141378.
[18] TANG N, LIU X N, XING W. Microplastics in wastewater treatment plants of Wuhan, Central China: Abundance, removal, and potential source in household wastewater[J]. Science of the Total Environment, 2020, 745: 141026.
[19] LONG Z X, PAN Z, WANG W L, et al. Microplastic abundance, characteristics, and removal in wastewater treatment plants in a coastal city of China[J]. Water Research, 2019, 155: 255-265.
[20] LV X M, DONG Q, ZUO Z Q, et al. Microplastics in a municipal wastewater treatment plant: Fate, dynamic distribution, removal efficiencies, and control strategies[J]. Journal of Cleaner Production, 2019, 225: 579-586.
[21] LONG Y N, ZHOU Z Y, YIN L S, et al. Microplastics removal and characteristics of constructed wetlands WWTPs in rural area of Changsha, China: A different situation from urban WWTPs[J]. Science of The Total Environment, 2022, 811: 152352.
[22] YANG Z Y, LI S X, MA S R, et al. Characteristics and removal efficiency of microplastics in sewage treatment plant of Xi'an City, northwest China[J]. Science of the Total Environment, 2021, 771: 145377.
[23] RUAN Y F, ZHANG K, WU C X, et al. A preliminary screening of HBCD enantiomers transported by microplastics in wastewater treatment plants[J]. Science of The Total Environment, 2019, 674: 171-178.
[24] ZHANG L S, LIU J Y, XIE Y S, et al. Occurrence and removal of microplastics from wastewater treatment plants in a typical tourist city in China[J]. Journal of Cleaner Production, 2021, 291: 125968.
[25] ZOU Y H, YE C L, PAN Y Z. Abundance and characteristics of microplastics in municipal wastewater treatment plant effluent: a case study of Guangzhou, China[J]. Environmental Science and Pollution Research, 2021, 28(9): 11572-11585.
[26] YANG L B, LI K X, CUI S, et al. Removal of microplastics in municipal sewage from China’s largest water reclamation plant[J]. Water Research, 2019, 155: 175-181.
[27] SHEN M C, ZHANG Y X, ALMATRAFI E, et al. Efficient removal of microplastics from wastewater by an electrocoagulation process[J]. Chemical Engineering Journal, 2022, 428: 131161.
[28] FRANCO A A, ARELLANO J M, ALBENDIN G, et al. Microplastic pollution in wastewater treatment plants in the city of Cádiz: Abundance, removal efficiency and presence in receiving water body[J]. Science of the Total Environment, 2021, 776: 145795.
[29] HIDAYATURRAHMAN H, LEE T G. A study on characteristics of microplastic in wastewater of South Korea: Identification, quantification, and fate of microplastics during treatment process[J]. Marine Pollution Bulletin, 2019, 146: 696-702.
[30] EDO C, GONZÁLEZ-PLEITER M, LEGANéS F, et al. Fate of microplastics in wastewater treatment plants and their environmental dispersion with effluent and sludge[J]. Environmental Pollution, 2019, 259: 113837.
[31] DRIS R, GASPERI J, TASSIN B. Sources and fate of microplastics in urban areas: A focus on Paris Megacity[J]. Freshwater Microplastics, 2018, 58: 69-83.
[32] GIES E A, LENOBLE J L, NOëL M, et al. Retention of microplastics in a major secondary wastewater treatment plant in Vancouver, Canada[J]. Marine Pollution Bulletin, 2018, 133: 553-561.
[33] LESLIE H, BRANDSMA S, VAN VELZEN M, et al. Microplastics en route: Field measurements in the Dutch river delta and Amsterdam canals, wastewater treatment plants, North Sea sediments and biota[J]. Environment International, 2017, 101: 133-142.
[34] MAGNI S, BINELLI A, PITTURA L, et al. The fate of microplastics in an Italian Wastewater Treatment Plant[J]. Science of the Total Environment, 2019, 652: 602-610.
[35] ZIAJAHROMI S, NEALE P A, SILVEIRA I T, et al. An audit of microplastic abundance throughout three Australian wastewater treatment plants[J]. Chemosphere, 2020, 263: 128294.
[36] WANG F, WANG B, DUAN L, et al. Occurrence and distribution of microplastics in domestic, industrial, agricultural and aquacultural wastewater sources: A case study in Changzhou, China[J]. Water Research, 2020, 182: 115956.
[37] LECHNER A, RAMLER D. The discharge of certain amounts of industrial microplastic from a production plant into the River Danube is permitted by the Austrian legislation[J]. Environmental Pollution, 2015, 200: 159-160.
[38] FRANCO A A, ARELLANO J M, ALBENDíN G, et al. Mapping microplastics in Cadiz (Spain): Occurrence of microplastics in municipal and industrial wastewaters[J]. Journal of Water Process Engineering, 2020, 38: 101596.
[39] ZHANG K, XU S P, CAO Y R, et al. A systematic study of microplastic occurrence in urban water networks of a metropolis[J]. Water Research, 2022, 223: 118992.
[40] CORRADINI F, CASADO F, LEIVA V, et al. Microplastics occurrence and frequency in soils under different land uses on a regional scale[J]. Science of the Total Environment, 2021, 752: 141917.
[41] CESA F S, TURRA A, BARUQUE-RAMOS J. Synthetic fibers as microplastics in the marine environment: A review from textile perspective with a focus on domestic washings[J]. Science of the Total Environment, 2017, 598: 1116-1129.
[42] PINLOVA B, HUFENUS R, NOWACK B. Systematic study of the presence of microplastic fibers during polyester yarn production[J]. Journal of Cleaner Production, 2022, 363: 132247.
[43] XU C Y, ZHOU G, LU J W, et al. Spatio-vertical distribution of riverine microplastics: Impact of the textile industry[J]. Environmental Research, 2022, 211: 112789.
[44] DALLA Fontana G, MOSSOTTI R, MONTARSOLO A. Influence of sewing on microplastic release from textiles during washing[J]. Water, Air, & Soil Pollution, 2021, 232(2): 50.
[45] WANG J, WANG M X, RU S G, et al. High levels of microplastic pollution in the sediments and benthic organisms of the South Yellow Sea, China[J]. Science of The Total Environment, 2019, 651(Part 2): 1661-1669.
[46] KANNANKAI M P, BABU A J, RADHAKRISHNAN A, et al. Machine learning aided meta-analysis of microplastic polymer composition in global marine environment[J]. Journal of Hazardous Materials, 2022, 440: 129801.
[47] ZHAO X L, WANG J Y, LEUNG K M Y, et al. Color: An important but overlooked factor for plastic photoaging and microplastic formation[J]. Environmental Science & Technology, 2022, 56(13): 9161-9163.
[48] UGWU K, HERRERA A, GóMEZ M. Microplastics in marine biota: A review[J]. Marine Pollution Bulletin, 2021, 169: 11254.
Characteristics of microplastic in different industrial wastewater sources along the coast of Shandong Province
LI Xiao-ya1, LIU Juan1, ZHENG Shan2, LIANG Jun-hua2, ZHU Ming-liang2, LI Qing-jie2, SUN Xiao-xia2
(1. College of Environment and Safety Engineering, Qingdao University Of Science & Technology, Qingdao 201210, China; 2. Jiaozhou Bay Marine Ecosystem Research Station, Institute of Oceanology, Chinese Academy of Sciences, Qingdao 266071, China)
Microplastics (MPs) have attracted widespread attention as emerging and pervasive contaminants, and the scientific community is increasingly recognizing industrial sources as significant contributors to MP pollution in rivers and adjacent seas. However, the extent of this pollution in wastewater from industrial sources remains unclear. In this study, we examined MP characteristics in the influent and effluent of representative enterprises from five coastal industries in Shandong Province. Our findings revealed that internal wastewater treatment systems within industrial wastewater sources exhibited a relatively low removal efficiency for MPs, with an average removal rate of only 59.86%. Consequently, a substantial quantity of MPs was discharged from coastal industrial wastewater sources, representing a significant source of microplastic pollution in the offshore environment. Among these industries, the textile printing and dyeing sector exhibited the highest MP content in the influent and effluent, with average abundances of 84.8 and 19.6 pieces/L, respectively. The paper and plastic manufacturing plants, chemical plants, and shipbuilding industries displayed comparable MP abundances in wastewater, ranging from 32.0 to 37.2 pieces/L in effluent and 10.8 to 14.6 pieces/L in effluent. Gold mining plants demonstrated the lowest MP abundance, with 23.9 pieces/L in the influent and 17.6 pieces/L in the effluent. The MPs influent from various industrial sources exhibited similar shapes and compositions, characterized by fibers (comprising 61.46%–84.48%) and demonstrated by polyethylene (PE) (constituting 53.48%–76.19%). In industrial source effluents, MPs predominantly took the form of fibers (61.46%–91.06%), were primarily blue (41.67%–58.22%), and were composed mainly of PE (16.22%–67.83%). Moreover, we observed industry-specific variations in MP size within the effluent, where the highest average proportion of MPs ≤300 μm reached 28.67%, spanning from 23.96% to 35.19%. The characteristics of MPs in industrial effluents closely resemble those found in the ocean, underscoring the significant contribution of industrial discharges to marine MP pollution. This study provides a scientific foundation for researching source-sink dynamics, migration patterns, and strategies for preventing and controlling marine MPs by elucidating MP concentrations and traits in industrial effluents across representative industries near typical bays.
coastal of Shandong; microplastics; industrial wastewater; characteristic
Mar. 2, 2023
[The National Natural Science Foundation of China, No. U2006206; The International Science Partnership Program of the Chinese Academy of Sciences, No. 133137KYSB20200002; The National Natural Science Foundation of China, No. 42006118; The International Science Partnership Program of the Chinese Academy of Sciences, No. 121311KYSB20190029; The Strategic Priority Research Program of the Chinese Academy of Sciences, No. XDA23050303]
X703
A
1000-3096(2023)10-0043-09
10.11759/hykx20230302002
2023-03-02;
2023-04-11
国家自然科学基金委员会联合基金重点支持项目(U2006206); 中国科学院国际合作伙伴计划对外合作重点项目(133137KYSB20200002); 国家自然科学基金委员会项目(42006118); 中国科学院国际大科学计划培育项目(121311KYSB20190029); 中国科学院战略性先导科技专项(A类)子课题(XDA23050303)
李晓亚(1998—), 女, 山东省泰安人, 硕士研究生, 主要从事污水中微塑料研究, E-mail: 2832822062@qq.com; 孙晓霞(1974—),通信作者, 女, 博士生导师, 研究员, 研究方向: 海洋生态学, E-mail: xsun@qdio.ac.cn
(本文编辑: 赵卫红)
猜你喜欢
环境卫生工程(2021年5期)2021-11-20
作文成功之路·小学版(2020年3期)2020-04-21
皮革制作与环保科技(2020年14期)2020-03-17
石家庄铁路职业技术学院学报(2018年1期)2018-05-09
中国篆刻(2017年6期)2017-07-18
Coco薇(2016年8期)2016-10-09
中国资源综合利用(2016年11期)2016-01-22
少儿科学周刊·少年版(2015年3期)2015-07-07
声学技术(2014年2期)2014-06-21
现代防御技术(2014年6期)2014-02-28