
Detection Capability Evaluation of Lunar Mineralogical Spectrometer:Results from Ground Experimental Data
2024-01-16 12:10FangGaoBinLiuXinRenDaWeiLiuandChunLaiLi
Fang Gao, Bin Liu, Xin Ren, Da-Wei Liu, and Chun-Lai Li
1 Key Laboratory of Lunar and Deep Space Exploration, Chinese Academy of Sciences, Beijing 100101, China; liub@nao.cas.cn 2 National Astronomical Observatories, Chinese Academy of Sciences, Beijing 100101, China 3University of Chinese Academy of Sciences, Beijing 100049, China Received 2023 July 5; revised 2023 September 11; accepted 2023 September 20; published 2023 October 31
Abstract The Chang’E-6 mission will first land on the far side of the moon and bring lunar samples back.As a hyperspectral imager aboard the Chang’E-6 lander, the Lunar Mineralogical Spectrometer (LMS), will achieve the goal of spectral detection and mineral composition analysis in the sampling area, and the data of LMS will also be compared with the results of the returned sample laboratory measurements.Visible and near-infrared hyperspectral remote sensing is an effective tool for lunar minerals identification and quantification.The ground validation experiment can be used to evaluate the detection ability of the LMS.According to the modal abundances of lunar minerals and glasses of APOLLO samples, binary mixed samples, ternary mixed samples, and seven-membered mixed samples were prepared.The samples were ground and stirred homogeneous to about 200 mesh (median particle size about 75 μm), to simulate the soil state of the lunar surface.Under the laboratory ambient condition,the 480–3200 nm spectral data of the samples were acquired using the Engineering Qualification Model(EQM)of Chang’E-5 LMS, the performance of which is consistent with the flight model of Chang’E-6 LMS.By fitting the mixed samples’spectral data of the EQM using the Modified Gaussian Methods,the following conclusions can be drawn:The subtle spectral changes of mixed samples can be detected.The modal abundance of low-Ca pyroxene,high-Ca pyroxene, and plagioclase can be derived based on the spectral parameters such as absorption position,depth or width of the mixed samples, and the correlation coefficients R2 are better than 82%, indicating that the LMS has good quantitative detection capability.
Key words: methods: data analysis – techniques: spectroscopic – Moon
1.Introduction
With the successful implementation of the Chang’E-5 mission, the Chang’E-6 probe will be launched in 2024.The Chang’E-6 mission will achieve the goal of first landing and samples return on the farside of the Moon.As one of the scientific payloads of Chang’E-6 probe, the Lunar Mineralogical Spectrometer(LMS)will be responsible for the visible and near-infrared spectral detection of the landing area,mineral types, and their distribution survey.Besides, the data of LMS will also be compared with the sample laboratory measurement results.
The composition and distribution of the materials on the lunar surface are important to study the origin and evolution of the moon (Pieters et al.1993; Williams et al.1995; Tompkins& Pieters 1999; Jolliff et al.2000; Elkins Tanton et al.2002;Cahill et al.2009;Karthi et al.2022;Wang et al.2022).It has been a very effective tool to use visible and near-infrared spectroscopy technology to derive the surface material composition and distribution.It can not only obtain the content and distribution of some useful elements, such as Fe, Ti, Mg,and Al (Lucey et al.1998, 2000; Ling et al.2011a, 2011b;Wu et al.2012; Yan et al.2012; Lu et al.2021) but also the content and distribution of some composed minerals, such as pyroxene, plagioclase, olivine and ilmenite (sunshine &Pieters 1993; Pieters 2002; Shkuratov 2003; Shuai et al.2013).However, there are still many uncertainties in the identification and quantification of the minerals on lunar surface.For example,the detection and identification of olivine will be mainly influenced by the spectral characteristics of pyroxene in the lunar soil(Singer 1981;Cloutis et al.1986;De León et al.2006).Besides, Mg-olivine (forsterite) and Faolivine (fayalite) have quite different spectra with different peak positions of three major bands, so they can be clearly distinguished.But when we are talking about the highresolution distinction of Mg#, it may be highly uncertain(Clark et al.2007).
To ensure that the payload can work properly and return high-quality scientific data,the LMS needs to calibrate and go through the ground validation experiment before launching.The spectral quality of the LMS has been evaluated in previous investigations (Cai et al.2019).In this paper, binary mixed samples,ternary mixed samples,and seven-component mixed samples were prepared respectively according to the distribution characteristics of typical mineral components on the lunar surface.By measuring the samples’ spectra and fitting the data using the Modified Gaussian Model (MGM),the minerals’ quantification capabilities of LMS were analyzed.

Figure 1.The mineral composition of the two pyroxenes.
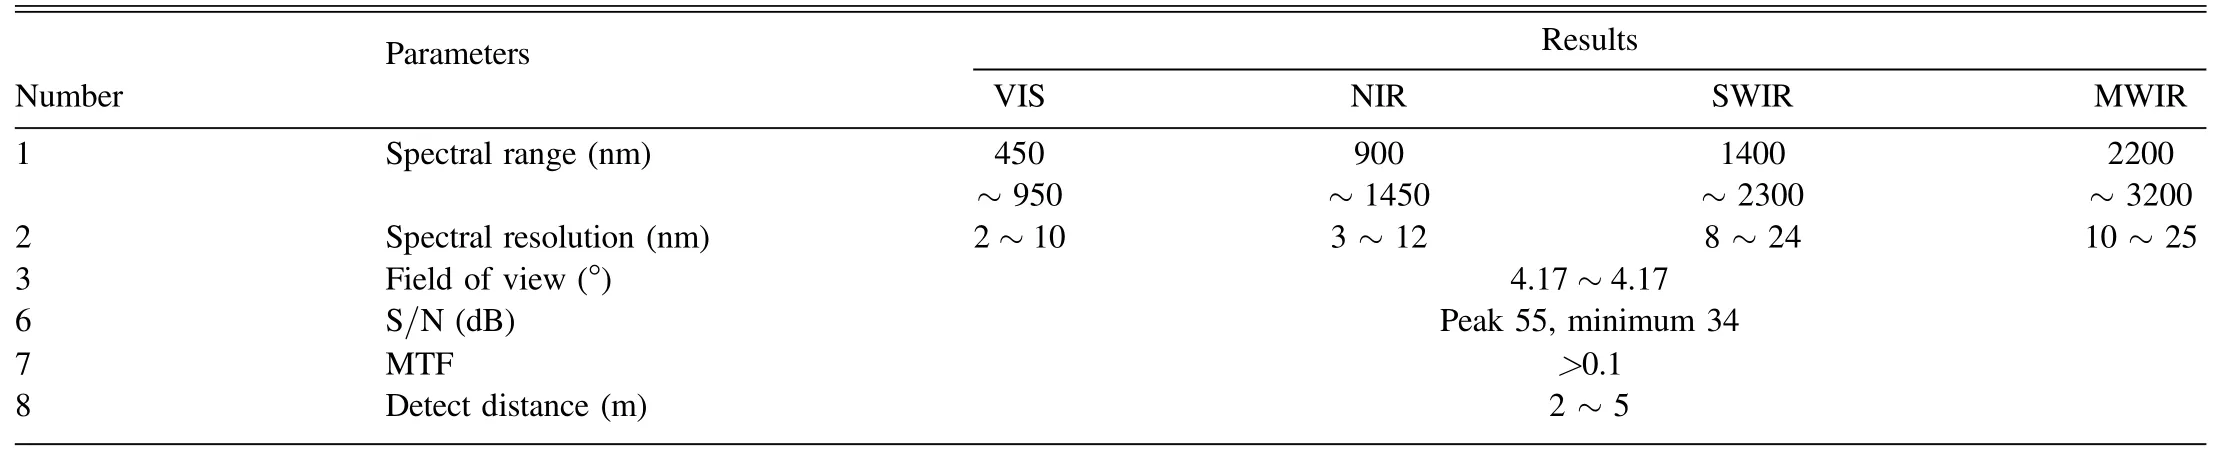
Table 1 The Main Characters of LMS

Table 2 Modal Abundance of Different Mineral Samples in Simulated Glass Preparation
2.Instrument Overview
LMS is composed of a two-dimensional scanning motor and a spectrometer(Liu et al.2022).The spectrometer consists of a Visible and near-infrared imaging detector (VIS, 480–950 nm)and three infrared single-point detectors (NIR, 900–1450 nm;SWIR, 1400–2300 nm; MWIR, 2200–3200 nm).The main characteristics of LMS are listed in Table 1.
LMS carries a calibration target to perform in situ radiometric calibration.The calibration target is embedded in the inner side of the dust cover.When the lander lands on the Moon,the dust cover is opened and fixed at an angle of 70°,then the calibration target is exposed to the sunlight at that angle.LMS detects the landing area by adjusting the observation angle using the twodimensional pointing mechanism,and also achieves the field of view alignment with the calibration target, to complete in situ radiometric calibration.
3.Laboratory Spectral Measurements
3.1.Experimental Samples

Figure 2.The mineral composition of the plagioclase.
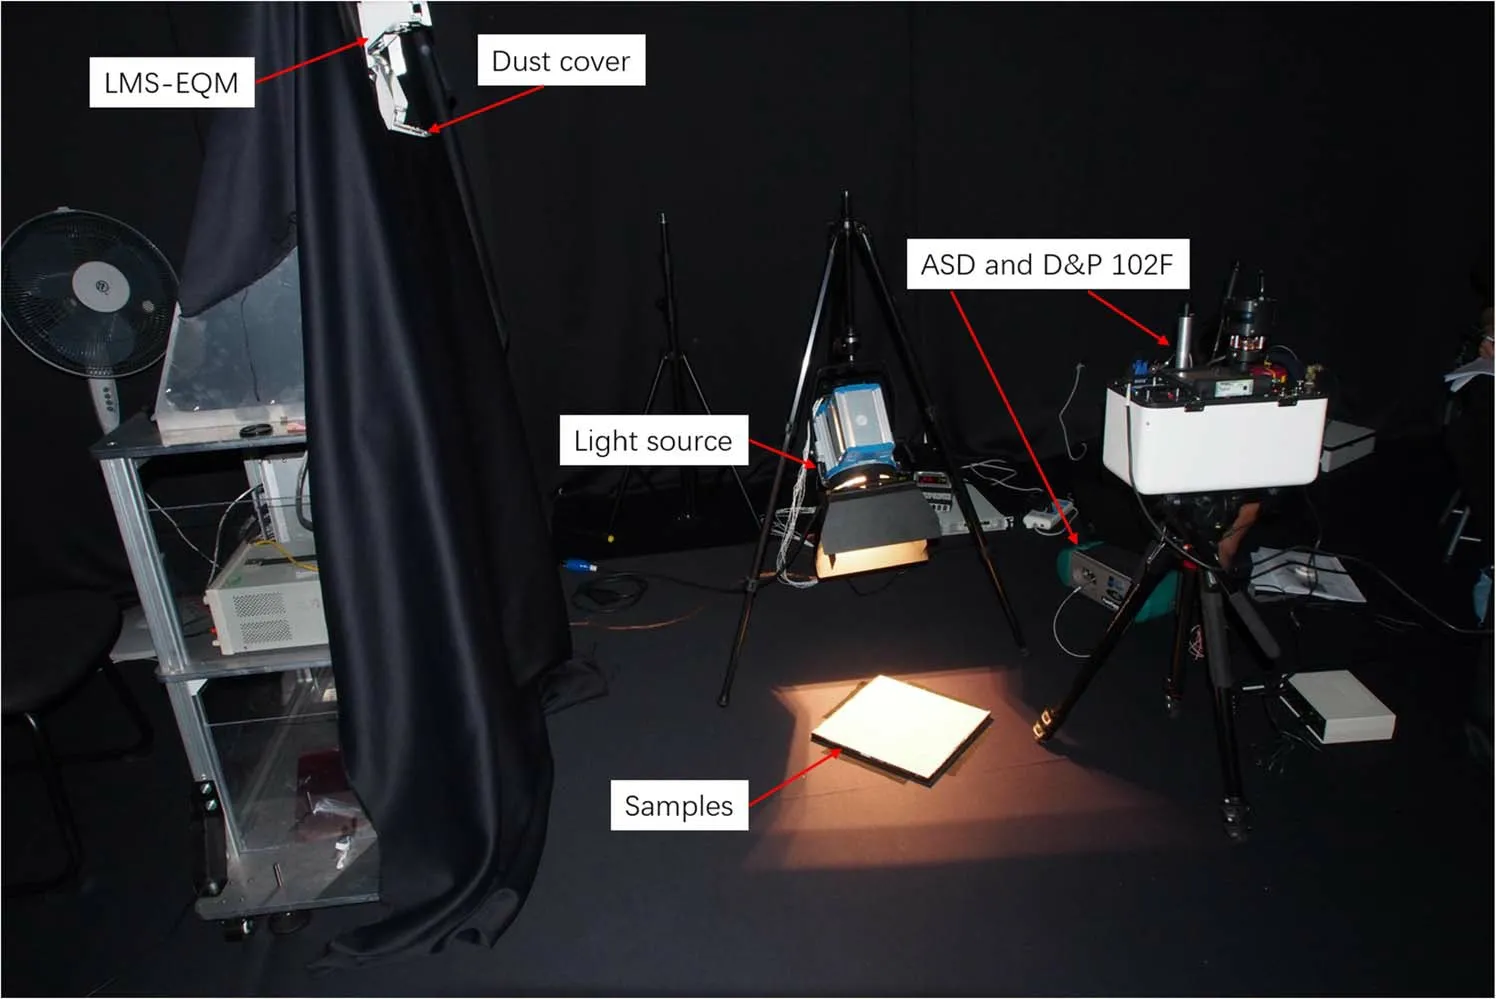
Figure 3.The experimental environment.The “solar-like” lamp can adjust the incident angle of light, and the sample in the container is smoothed and covers the LMS’field of view.The EQM of LMS is fixed to the simulated lander on the left side,the standard spectrometers(ASD and DP102F)are mounted to the simulated lander on the right side, which is mounted in a symmetrical position to the EQM of LMS.
According to the typical minerals and glasses of the lunar surface, six mineral samples and one simulated glass sample were prepared, the mineral samples included clinopyroxene(augite), Orthopyroxene (hypersthene), olivine, ilmenite, apatite, and plagioclase.All mineral samples (except plagioclase)are ground to 200 mesh (about 75 μm), which is similar to the median particle size of lunar soil (40–130 μm).Pure plagioclase samples are obtained by crushing and grounding gabbro to 40 mesh (∼420 μm) first and then removing the magnetic minerals with a magnetic separator.The simulated glass samples are prepared as follows: different mineral samples were mixed first according to the modal abundances in Table 2,and then the mixed samples were sintered at high temperature(1150°, three hours), quenched, and then ground to 200 mesh to obtain simulated glass samples.
All mineral and glass samples have been analyzed for chemical composition using the sequential X-ray fluorescencespectrometer, and the results are shown in Table 3 and Figures 1 and 2.To simulate the mineral composition of the lunar soils, binary mixed samples, ternary mixed samples, and seven-members mixed samples were prepared.The sample description and experimental purpose are shown in Tables 4–7.The spectra of all the minerals and mixed samples in the 480–3200 nm were measured and displayed in our previous paper (Cai et al.2019).
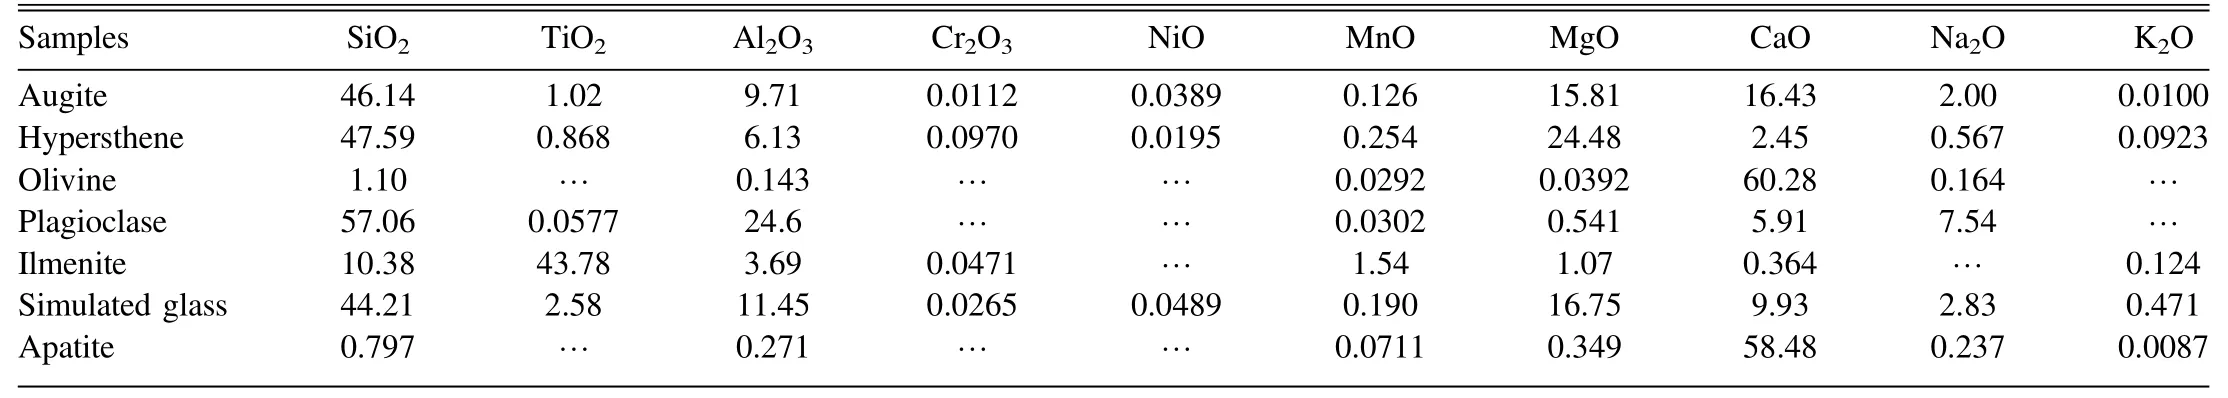
Table 3Results of Chemical Composition Analysis of the Mineral Samples

Table 4The Experimental Purpose and the Mixture Samples Used
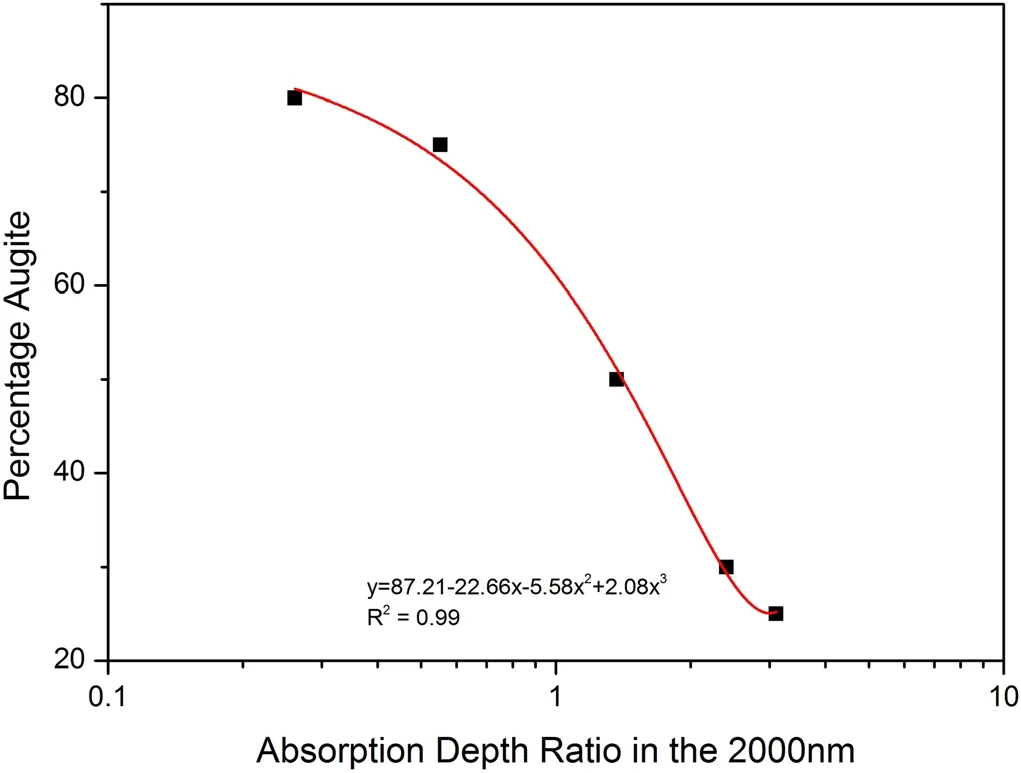
Figure 4.The fitted model for the modal abundances of augite in the binary mixed samples.
3.2.Experimental Environment and Process
The experiment is implemented in a dark room, and the environment is shown in Figure 3.The spectral data acquisition of seven mineral samples and 18 mixed samples were completed sequentially using the Engineering Qualification Model (EQM) of LMS and the standard spectrometers (ASD and DP102F).The full spectral data of the calibration targets(an aluminum panel and a gold panel)were also acquired at the same time.After reflectance data calculation, the spectral parameters of absorption centers, depths, and widths are also derived.
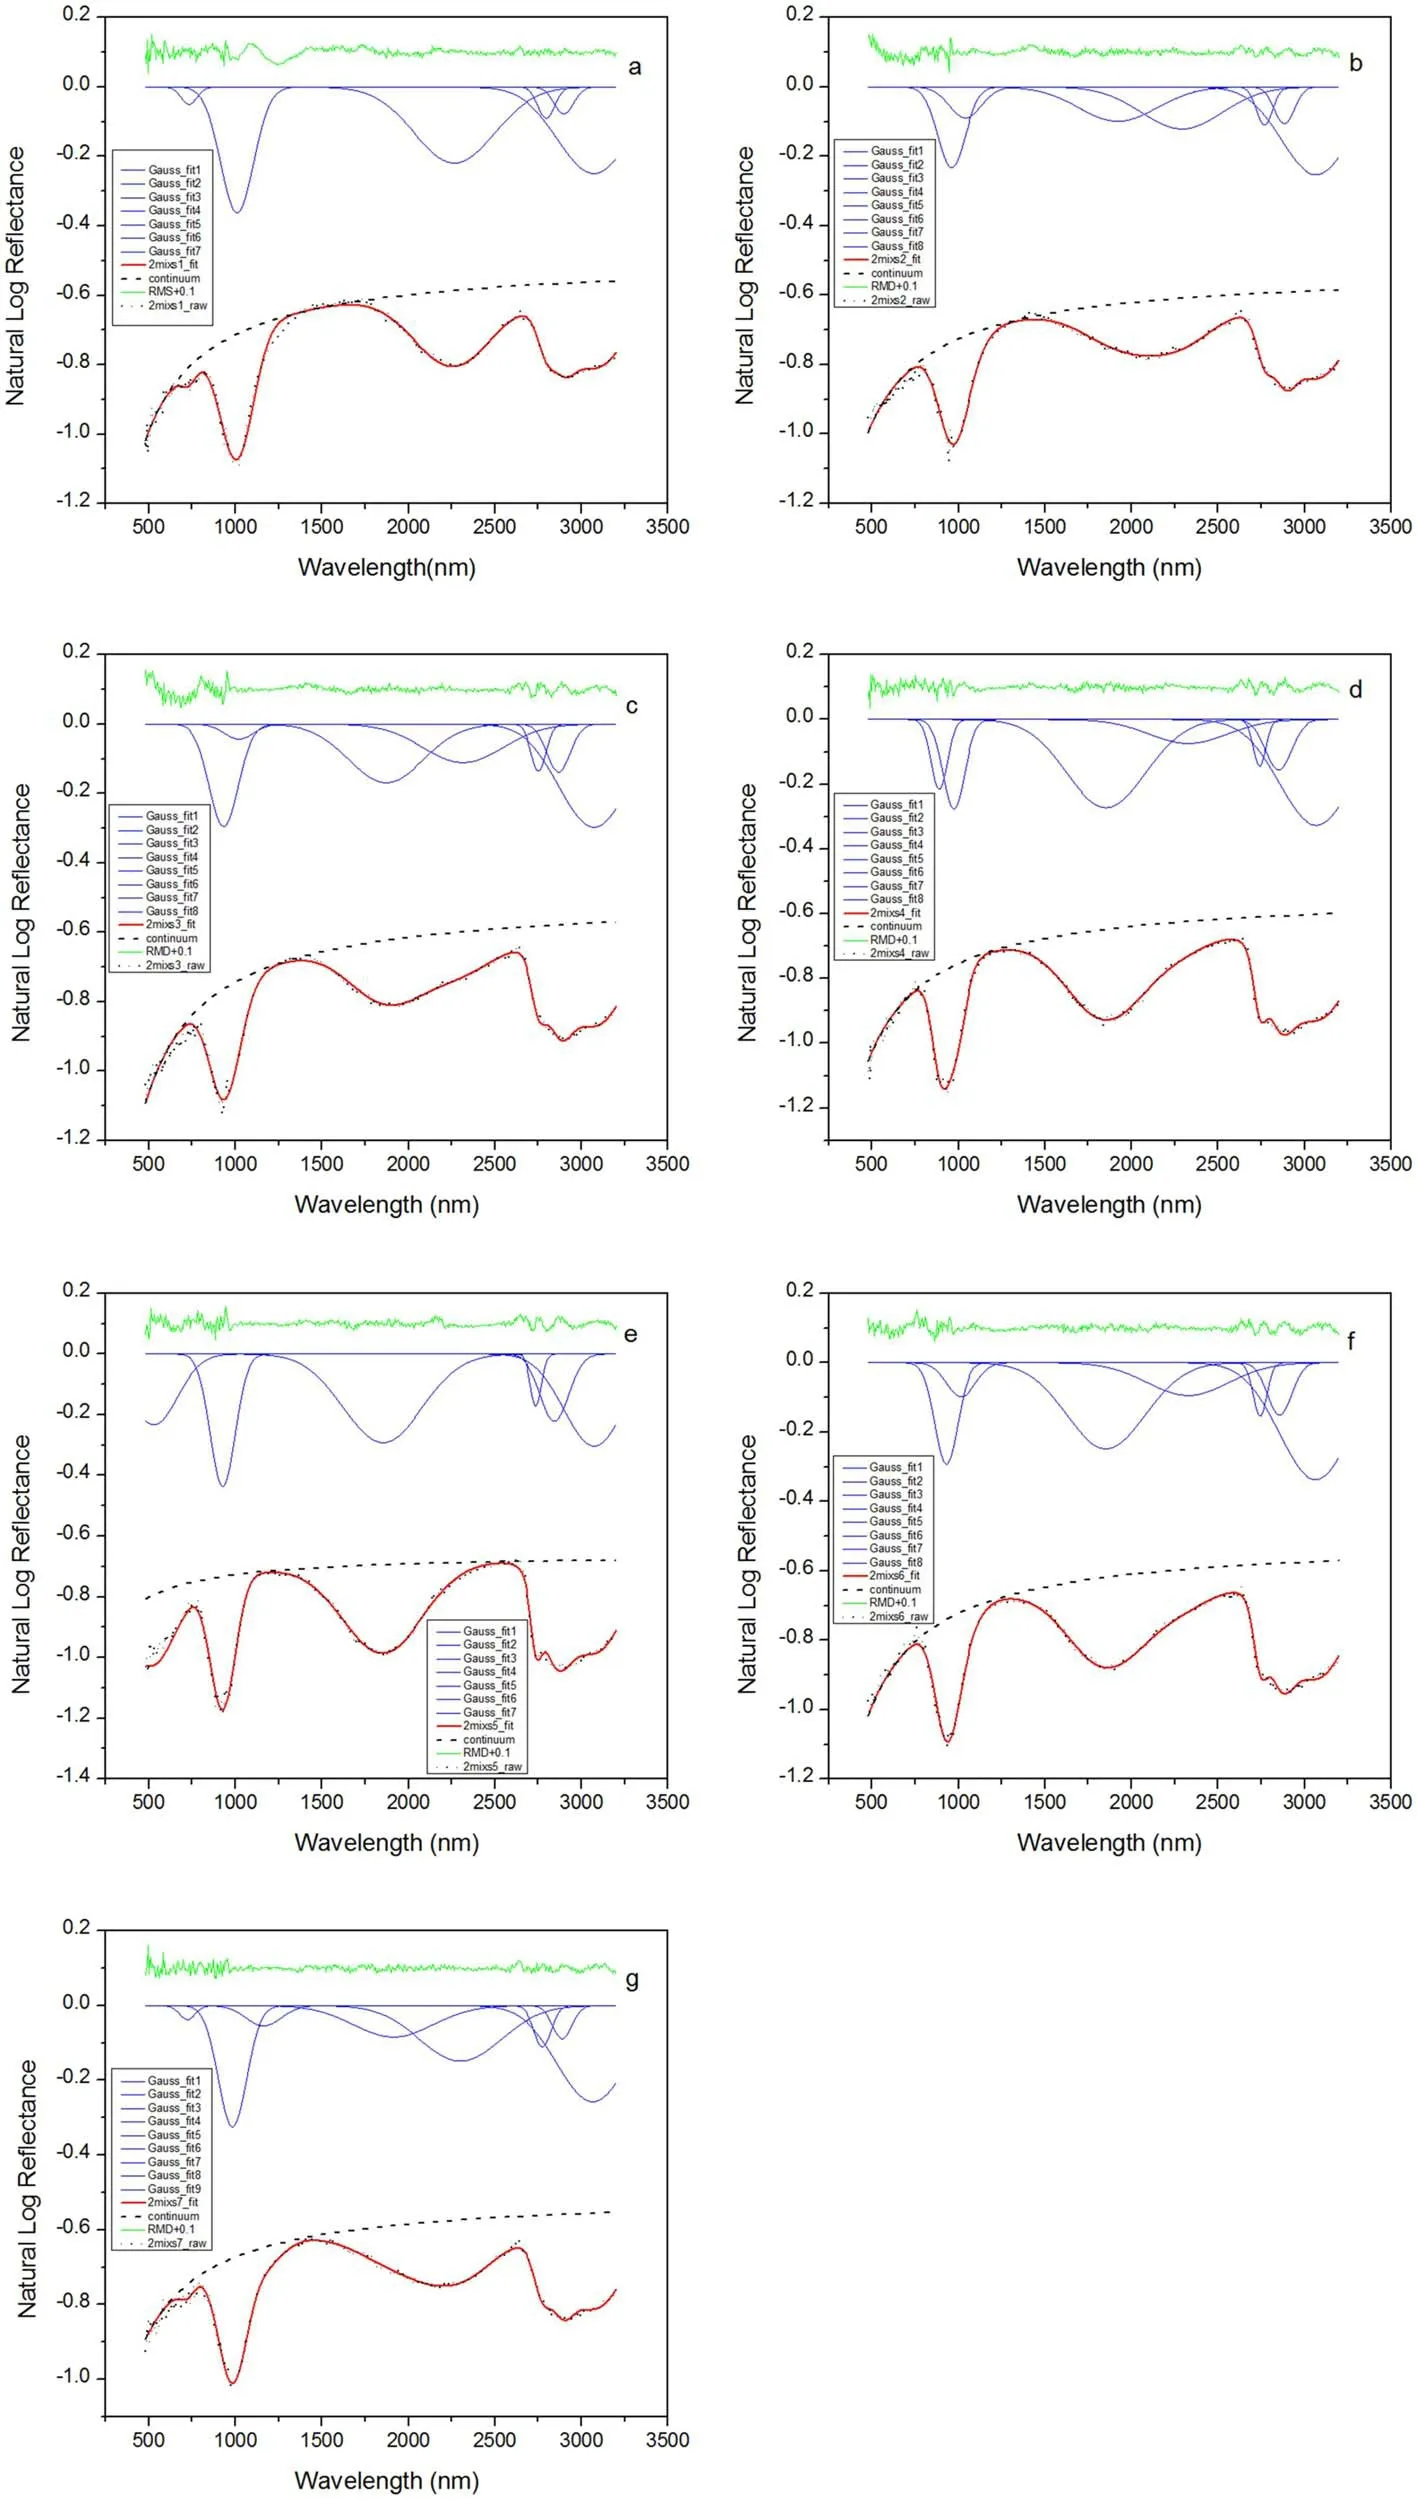
Figure 5.The MGM fitting results of the binary mixed samples’ spectra obtained by the EQM of LMS.
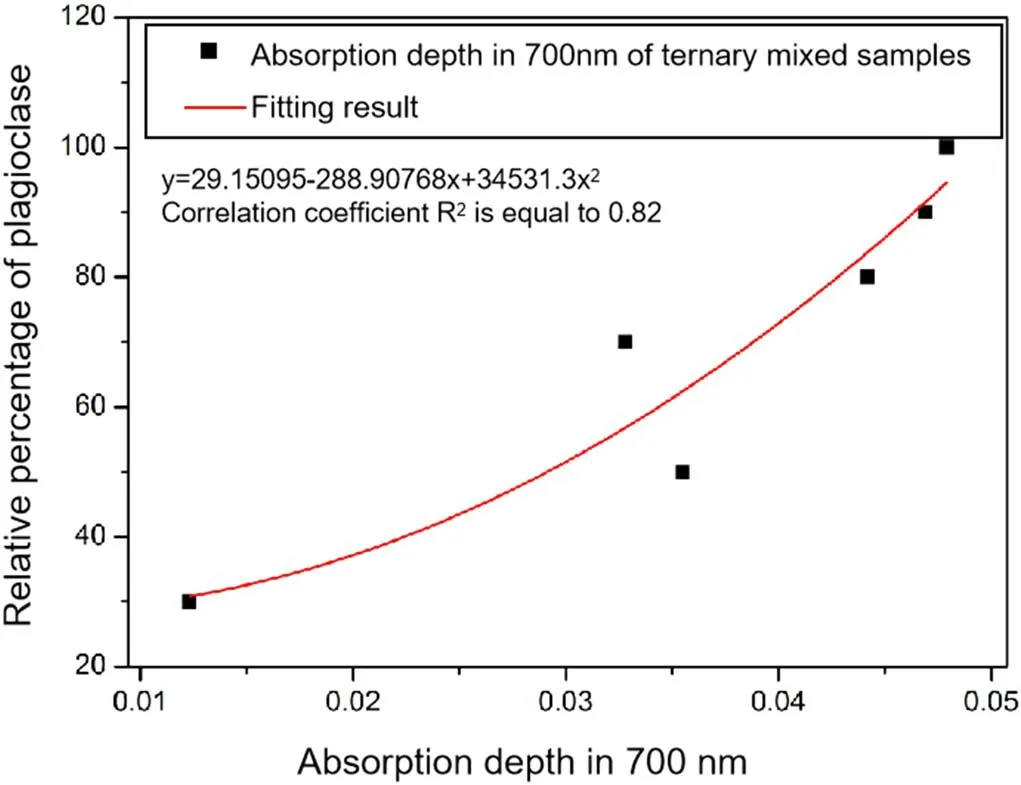
Figure 6.The fitted model for the modal abundances of plagioclase in the ternary mixed samples.
4.Detection Capability Evaluation
4.1.Detection Capability Evaluation of the Binary Mixed Samples
Binary mixed samples were prepared by mixing augite and hypersthene in different proportions (Table 5).We acquired spectra of binary mixed samples, analyzed the subtle spectral changes with mineral contents, and evaluated the ability of LMS to quantify the composed minerals.
With the composition of the binary mixed samples changed,the absorption centers and depths of the samples changed regularly.The MGM is used to fit the spectra and the functional relationship can be found between the modal abundance of augite and the absorption depth ratio in the 2000 nm, which is defined as the absorption strength ofhyperthene component divided by the absorption strength of augite component.The fitting result shows that with the increase of the modal abundance of augite, the absorption depth ratio of augite in the 2000 nm decreases gradually(Figure 4),and the polynomial fitting coefficient R2is equal to 0.99.Figure 5 demonstrates the MGM results of the binary mixed samples.As shown in Figure 5, the hydration bands near 3 μm are fitted by three Gaussians to beyond the data noise level (Hiroi et al.2021).

Table 6 The Mineral Composition of Ternary Mixed Samples (Serventi et al.2013)
4.2.Detection Capability Evaluation of the Ternary Mixed Samples
The ternary mixed samples were prepared by mixing hypersthene, olivine, and plagioclase, in which the ratio of hypersthene to olivine remained unchanged, but the content of plagioclase is changed.We acquired spectra of the ternary mixed samples, analyzed the spectral changes, and evaluated the detection capability of LMS for plagioclase quantification.

Figure 7.The MGM results of the ternary mixed samples’ spectra obtained by the EQM of LMS.

Figure 8.The fitted model for the modal abundances of the orthopyroxene in the seven-membered mixed samples.

Table 7The Minerals and Glass Composition of the Seven-membered Mixed Samples
With the increasing of the plagioclase content, the amplitudes of reflectance are getting higher,and the plagioclase absorption peak depth near 700 nm, which is defined as the strength of the Gaussian around 700 nm fitted by the MGM,are much more obvious,but the absorptions of pyroxene near 1000 and 2000 nm are gradually weakened.The MGM is used to fit the spectra and the functional relationship is established between the modal abundance of plagioclase and the absorption depth in the 700 nm.The fitting result shows that the higher the plagioclase content, the deeper the absorption peak depth in the 700 nm (Figure 6), and the polynomial fitting coefficient R2is equal to 0.82.Figure 7 shows the MGM results of the ternary mixed samples.
4.3.Detection Capability Evaluation of the Sevenmembers Mixed Sample
The seven-members mixed samples are mixtures of augite,hypersthene, olivine, plagioclase, ilmenite, apatite, and simulated glass according to the contents of minerals in the APOLLO lunar soil samples.We acquire spectra of the sevenmembers mixed samples and analyze the relationship between the variation of the spectral characteristics with the content of each mineral, to evaluate the ability of LMS for various minerals quantification.

Figure 9.The fitted model for the modal abundances of clinopyroxene in the seven-membered mixed samples.
With the change in the mineral contents,the characteristics of absorptions and the reflectance amplitude of the sevenmembered mixed samples were both changed.The MGM is also used to fit the spectra and the functional relationship is established between the absorption width of the hypersthene in 1000 nm and the modal abundances of the hypersthene,and the functional relationship is also established between and the absorption positions of augite in 1000 nm and the modal abundance of the augite.The fitting results are shown in the following Figures 8 and 9.The correlation coefficients are R2=0.91 and R2=0.62.We also try to find the relationships between the modal abundances of other kinds of minerals in the seven-membered mixed sample and the MGM spectral parameters,but no good fitting results are found.Figure 10 shows the MGM fitting results of the seven-membered mixed samples.
5.Conclusion and Discussion
5.1.Conclusion
The ground validation experiment is conducted in the laboratory for the EQM of LMS, spectral data acquisition,and MGM modeling were performed on the binary mixed samples,ternary mixed samples and the seven-members mixed samples.It can be concluded that LMS can effectively detect the subtle spectral variations in the mixed samples.The quantification model of the binary mixed samples can correctly reflect the relationship between the modal abundance of augite and the absorption depth ratio in 2000 nm,with the correlation coefficient R2=0.99.The quantification model of the ternary mixed samples can also properly reflect the relationship between the modal abundances of plagioclase and the absorption band depths in 700 nm, with the correlation coefficient R2=0.82.In addition, The quantification models of the augite and the hyperthene in the seven-members mixed samples are also established, with the correlation coefficients R2=0.91 and R2=0.62.The results demonstrate that LMS has good spectral identification and quantification ability.
5.2.Discussion
The quantification models for plagioclase, olivine, ilmenite,simulated glass,and apatite were not built in the seven-members mixed samples.The possible reasons are as follows: First,MGM allows spectra to be analyzed directly,without using endmember spectra.But this model could only quantify modal abundances of minerals with absorption features.Apatite,with a very low content,has no obvious absorption features except for the structural waterʼs absorption near 2.7 μm,so it is difficult to be identified and quantification.Besides, the low content of olivine in the seven-members mixed samples makes that it cannot be quantified from the mixture spectra, although it has obvious absorption features near 1 m.The characteristic of the low albedo and low contents of Ilmenite in the mixed samples also make it hard to identify and quantify.In addition,although plagioclase and simulated glass have relatively high modal abundances, their contents vary in a narrow range, so the spectral variations are still not obvious.For example,the modal abundance of plagioclase only varies from 14.3% to 17.2%.Previous studies by Pieters et al.(2014) indicate that the absorption features of plagioclase are suppressed by that of pyroxene when plagioclase is mixed with pyroxene.The plagioclase can be only identified and quantified when the contents of plagioclase in the mixture reach above 80%.
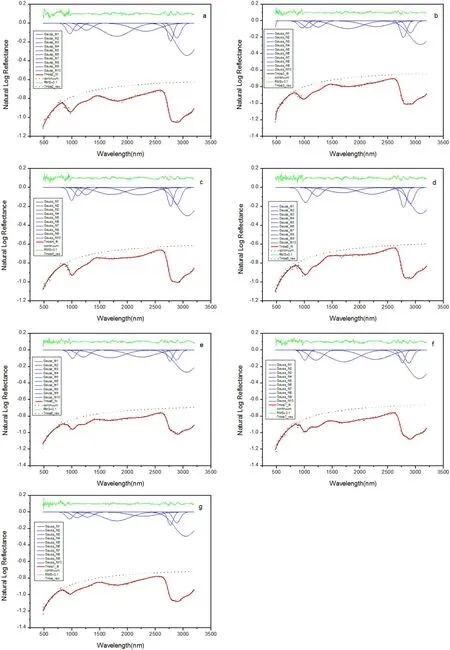
Figure 10.The MGM fitting results of the seven-membered mixed samples obtained by the EQM of LMS.
 Research in Astronomy and Astrophysics2023年12期
- Research in Astronomy and Astrophysics的其它文章
- Large-scale Dynamics of Line-driven Winds with the Re-radiation Effect
- A Study of Elemental Abundance Pattern of the r-II Star HD 222925
- Preliminary Study of Photometric Redshifts Based on the Wide Field Survey Telescope
- Solar Observation with the Fourier Transform Spectrometer.II.Preliminary Results of Solar Spectrum near the CO 4.66μm and MgI 12.32μm
- Density Functional Theory Calculations on the Interstellar Formation of Biomolecules
- A Comparison of Co-temporal Vector Magnetograms Obtained with HMI/SDO and SP/Hinode