
Solar Observation with the Fourier Transform Spectrometer.II.Preliminary Results of Solar Spectrum near the CO 4.66μm and MgI 12.32μm
2024-01-16 12:09XianyongBaiZhiweiFengZhiyongZhangYuanyongDengXiaomingZhuKaifanJiSongFengXiaoYangandYongliangSong
Xianyong Bai, Zhiwei Feng, Zhiyong Zhang, Yuanyong Deng, Xiaoming Zhu, Kaifan Ji, Song Feng,Xiao Yang, and Yongliang Song
1 National Astronomical Observatories, Chinese Academy of Sciences, Beijing 100101, China; xybai@bao.ac.cn
2 School of Astronomy and Space Science, University of Chinese Academy of Sciences, Beijing 101408, China
3 Yunnan Observatories, Chinese Academy of Sciences, Kunming 650011, China
4 Faculty of Information Engineering and Automation/Yunnan Key Laboratory of Computer Technology Application, Kunming University of Science and Technology, Kunming 650500, China
Received 2023 February 3; revised 2023 June 29; accepted 2023 July 18; published 2023 October 31
Abstract An infrared solar spectrum observed by ground-based telescopes is seriously affected by the background radiation both from the telescope and sky,relative to the visible wavelengths.Its accuracy is also influenced by the spectral resolution of the Fourier transform spectrometer.In the paper,we developed a CO2 gas cell and installed it in the sample compartment to calibrate the spectral resolution of the Bruker IFS-125HR at infrared wavelengths.The measured spectral resolution is 0.00342 ± 0.00086 cm−1 and 0.0059 ± 0.00024 cm−1 at the wavenumbers of 798 cm−1 and 2136 cm−1, respectively.We also updated a fully reflective sunlight feeding system to observe the solar spectrum near CO 4.66 μm and Mg I 12.32 μm.By quickly pointing the sunlight feeding system about 1 degree away from the solar disk center,we are able to measure the background radiation from the telescope and the sky at Huairou Solar Observing Station.After removing the background radiation,our observed solar spectrum at CO 4.66 μm is consistent with that from the National Solar Observatory.The Mg I 12.32 μm working line selected by the Accurate Infrared Magnetic Field Measurements of the Sun(AIMS)project is also identified.Our method is helpful not only for the spectral resolution calibration and background radiation correction of AIMS but also for other infrared astronomical telescopes.
Key words: Sun: infrared – methods: observational – instrumentation: interferometers
1.Introduction
With the rapid development of infrared detection technology and urgent scientific requirements, most new-generation solar telescopes are equipped with infrared post-focus instruments(Penn 2014).Recently, the solar spectrum near CO 4.66 μm gained extensive attention due to its unique role in probing the chromosphere, such as cold bubbles in the low solar chromosphere(Ayres 2003;Penn et al.2011;Loukitcheva et al.2019;Li et al.2020;Song et al.2023).Both the 4 m Daniel K.Inouye Solar Telescope(DKIST)and the 1.6 m Goode Solar Telescope(GST) are equipped with fully cryogenic instruments to cover the CO lines and have the ability to take observation with subarcsecond spatial resolution thanks to the large aperture(Cao et al.2010; Fehlmann et al.2016; Rimmele et al.2020;Yang et al.2020).Regarding longer wavelengths, DKIST is designed to cover wavelengths as far as 28 μm(Rimmele et al.2014).The Accurate Infrared Magnetic Field Measurements of the Sun (AIMS), which is the first mid-infrared astronomical telescope in China and is going to obtain its first light in 2023,is designed to observe the solar spectrum from 10 to 13 μm.The Mg I 12.32 μm line is selected as its main working line to accurately measure the solar magnetic field thanks to its high magnetic field sensitivity(Deng et al.2016).Meanwhile,it also incorporates a broadband imager at 8–10 μm.
A Fourier transform spectrometer (FTS) is generally employed to realize high-resolution spectroscopic observations in the mid-infrared.For example, the ground-based McMath−Pierce Solar Telescope (MPST) administered by National Solar Observatory in the United States (Brault 1972, 1978;Chang & Noyes 1983), the spaceborne Atmospheric Trace Molecule Spectroscopy(ATMOS)onboard Spacelab 3 and the Atmospheric Chemistry Experiment (ACE) onboard the Canadian SCISAT-1 satellite all rely on an FTS to observe the solar spectrum in the near- and mid-infrared wavelengths(Farmer et al.1989; Farmer 1994; Hase et al.2010).The FTS in these telescopes observes a point on the solar disk in a single observation since the detector has one single-pixel.In order to cover the two-dimensional solar disk region,we need to scan in two orthogonal directions, resulting in a low cadence or temporal resolution.To increase the temporal resolution, the FTS of AIMS has a 64×2 array detector.

Bai et al.(2021) built an experimental system, consisting of a Newtonian telescope, an optical fiber, and a newly installed FTS, Bruker IFS-125HR, at Huairou Solar Observing Station(HSOS).An inversion algorithm was developed and finally a solar spectrum at 0.4–2.2 μm was obtained from the original interferograms taken by the FTS.Due to limitations imposed by the transmitted wavelengths in the optical fiber, the midinfrared solar observation near Mg I 12.32 and CO 4.66 μm could not be done.Hence, the method to measure and correct the background radiation could not be developed.Also, the instrumental width of the FTS was not calibrated,which is one of the most important parameters to evaluate the performance of an FTS and is needed both in the operation of AIMS to ensure data quality and in the Stokes inversion of solar magnetic fields.
Keeping these questions in mind, we updated the experimental system and present new results in the paper.The method to calibrate the instrumental width of the FTS is described in Section 2.The obtained mid-infrared solar spectrum, the background spectrum as well as the background corrected spectrum with our proposed method near CO 4.66 μm and Mg I 12.32 μm are presented in Section 3,followed by the conclusion and future perspectives.
2.Calibration of the Instrumental Spectral Resolution of the Bruker IFS-125HR
2.1.Principle of the Calibration Method with a Gas Cell
A series of target spectral lines with line width much narrower than the spectral resolution of the FTS is needed to measure its instrumental spectral resolution.CO2has many absorption lines near CO 4.66 μm and Mg I 12.32 μm (or at wavenumber numbers near 2145 and 811 cm−1) (Hinkle et al.2003).The line width of a spectral line is mainly determined by the Doppler and pressure broadening.The line width of the gas molecules in the case of pressure broadening can be calculated with the following approximate formula
where M is the molecular weight and ν0is wavenumber value of the target line.If the temperature of the gas is lower,the line width is narrower.Based on the above equations,we are able to control the line width by injecting the gas into a gas cell with specific temperature and pressure.If the pressure P of the gas is 1.8×10⁻³atm(or 180 Pa)and T is 295 K (typical temperature in our laboratory), the corresponding line widthδvprescaused by pressure broadening is 0.00018 cm−1.For CO2, its molecular weight is 44 and the Doppler broadening δνdopis 0.0037 and 0.00138 cm−1at wavenumbers 2136 cm−1and 798 cm−1, respectively.The line width considering both pressure and Doppler broadening is
δν becomes 0.00371 cm−1and 0.00139 cm−1at the wavenumbers of 2136 cm−1and 798 cm−1, respectively.Compared with the pressure broadening, the Doppler broadening dominates if the pressure is very low in the gas cell.For our Bruker IFS-125HR, its maximum optical path difference(OPD) is 258 cm and the ideal spectral resolution is 0.0035 cm−1if the triangular apodization function is employed.The value will be larger in the near-infrared and visible wavelengths due to the larger influence of aberration.So, the CO2gas cell can be used to calibrate the instrument resolution of our FTS because its line width is much less than that of the FTS.
Then the instrument resolution δνinsequals
whereδvl2ineis the measured line width of the CO2gas cell with the FTS.
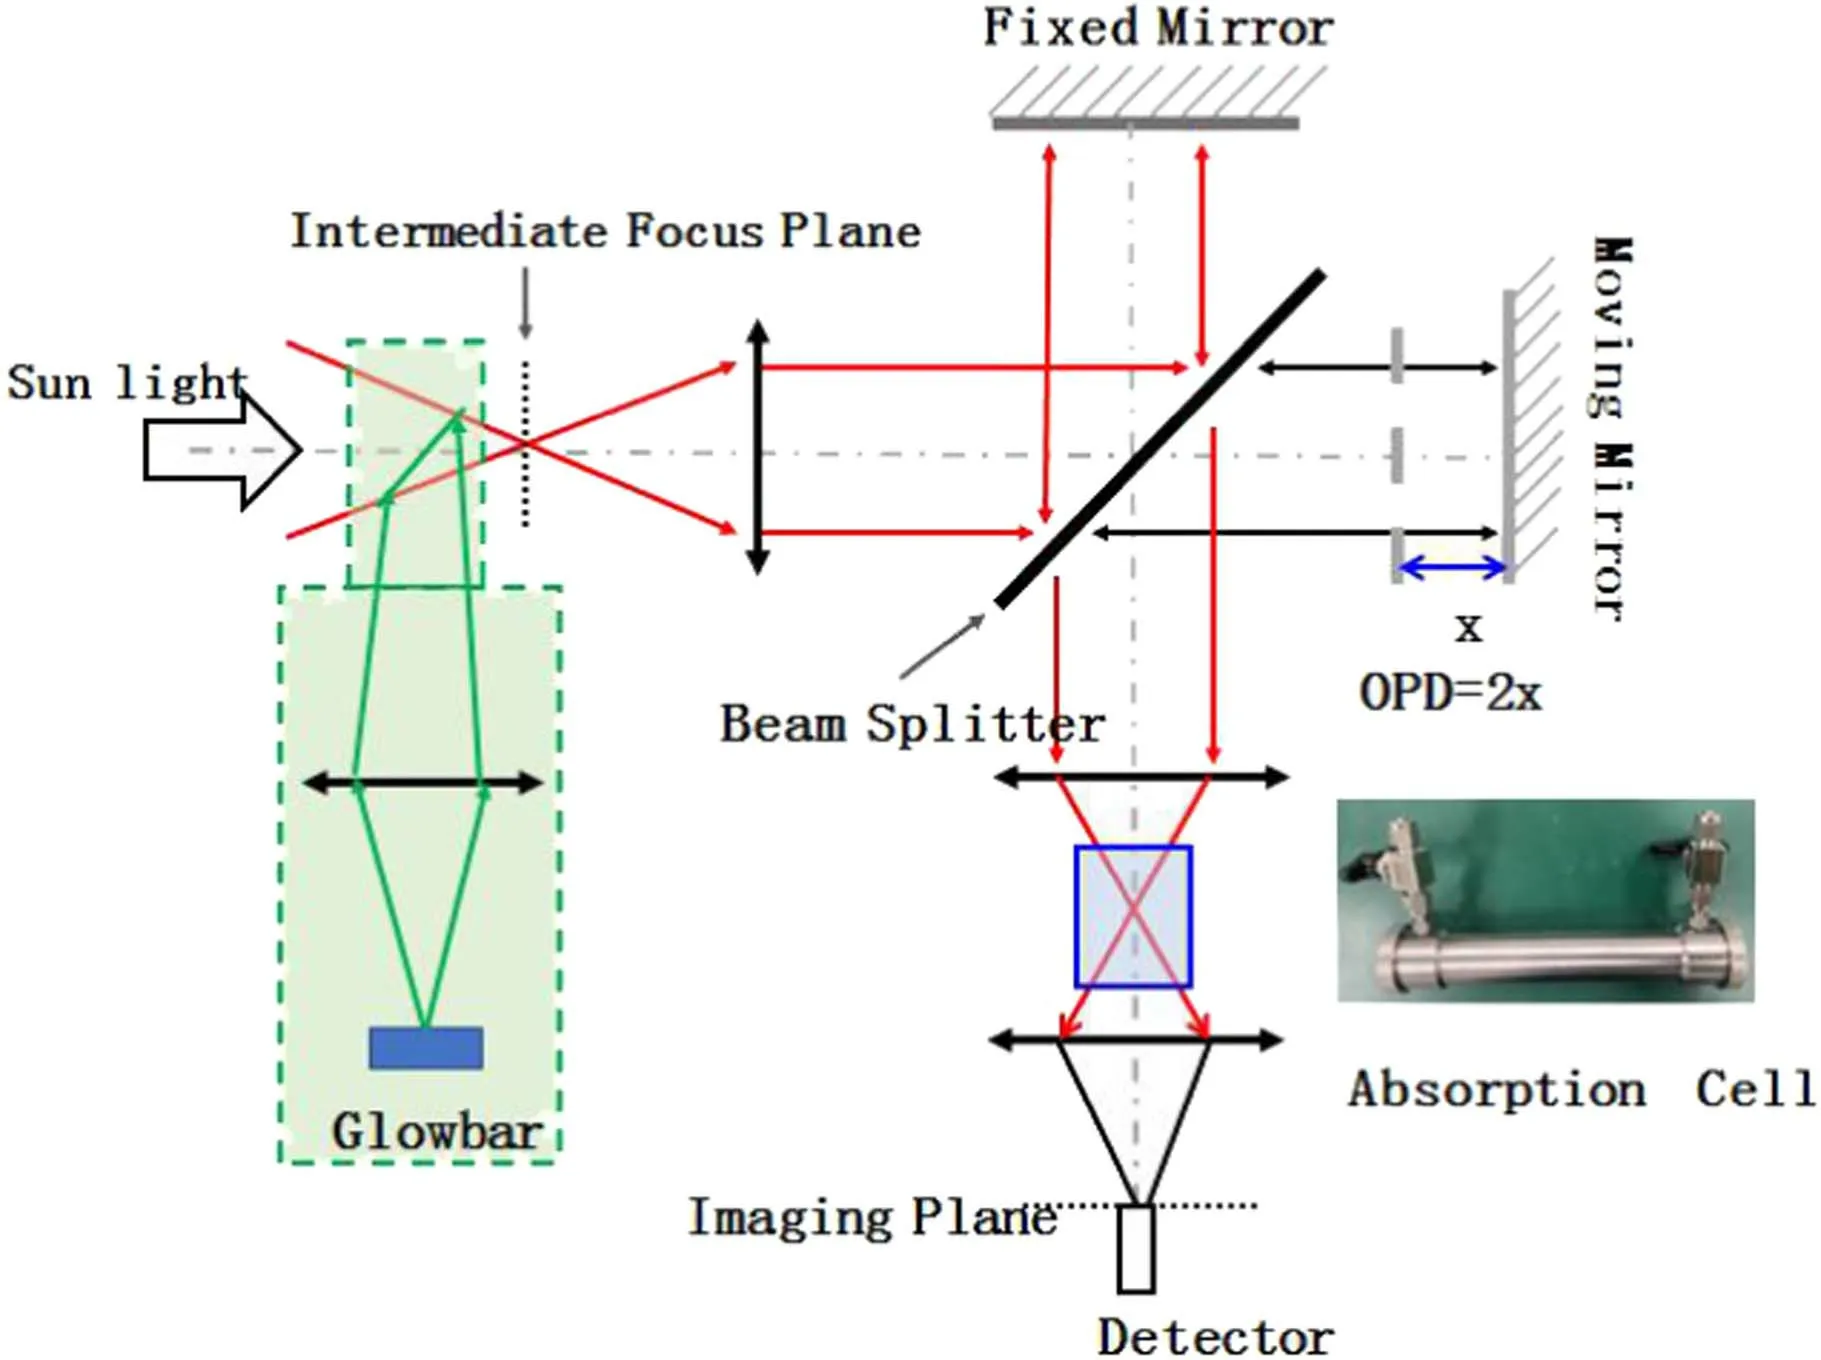
Figure 1.Schematic diagram of the calibration unit to calibrate the spectral resolution of the time-modulated Bruker IFS-125HR.During the calibration, radiation from the glowbar is directed into the FTS instead of exposing the instrument to sunlight.Meanwhile,we also need to put the gas cell into its sampling compartment in front of the detector.
2.2.Calibration Unit and Result
Figure 1 is a schematic diagram of our calibration unit attached to the FTS Bruker IFS-125HR.We customized a CO2gas cell with pressure of 1.8×10⁻³atm(or 180 Pa) and put it into the sample compartment of the Bruker IFS-125HR.The length of the cell is 20 cm to realize a larger absorption depth of the observed lines.During the calibration, we use the built-in glowbar to provide infrared continuum radiation.Moreover,the FTS is evacuated to 69.2 Pa to reduce the influence of molecules in the air.The OPD of the FTS is set to be 258 cm.The recorded interferogram is presented in Figure 2(a).The inversion algorithm proposed by Bai et al.(2021) is employed to invert the spectrum.The inverted CO2spectrum in the gas cell from 600 to 2000 cm−1is shown in Figure 2(b).We can see many CO2absorption lines in the two wavenumber regions,one from 600 to 800 cm−1and the other from 1200 to 2000 cm−1.
Two spectral lines near 798 and 2136 cm−1,which are close to our target solar Mg I 12.32 μm(811 cm−1)and CO 4.66 μm(2142 cm−1)lines,are used to evaluate the instrumental width,and the inverted results (red line with asterisk symbols) are arranged in Figure 3.We apply a single Gaussian function(blue plus symbols)to fit the two lines.The fitted full width at half maximum(FWHM)is 0.0037±0.0008 cm−1at 798 cm−1and 0.007 ±0.00028 cm−1at 2136 cm−1.The fitting error is mainly from the limited S/N of the inversed lines.Uncertainty in the pressure and Doppler broadening also influences the instrumental width of an FTS.The error is 0.00018 cm−1assuming the uncertainty of pressure in the gas cell is 180 Pa,which is the upper limit of a cell with a reasonable leaking rate.The FTS and the gas cell are arranged in the laboratory with constant temperature working at 295±3 K.Errors from the uncertainty in temperature are 0.00005 cm−1and 0.000134 cm−1at wavenumbers of 798 cm−1and 2136 cm−1,respectively, even if we assume that the temperature ranges from 285 K to 305 K.The corresponding instrumental widths are 0.00342 ±0.00086 cm−1and 0.0059 ±0.00024 cm−1after considering the above-mentioned errors according to Equation (4) at the wavenumbers of 798 cm−1and 2136 cm−1, respectively.The resolution at larger wavenumber(shorter wavelength)is worse due to its more serious influence from optical aberrations and adjustment errors.
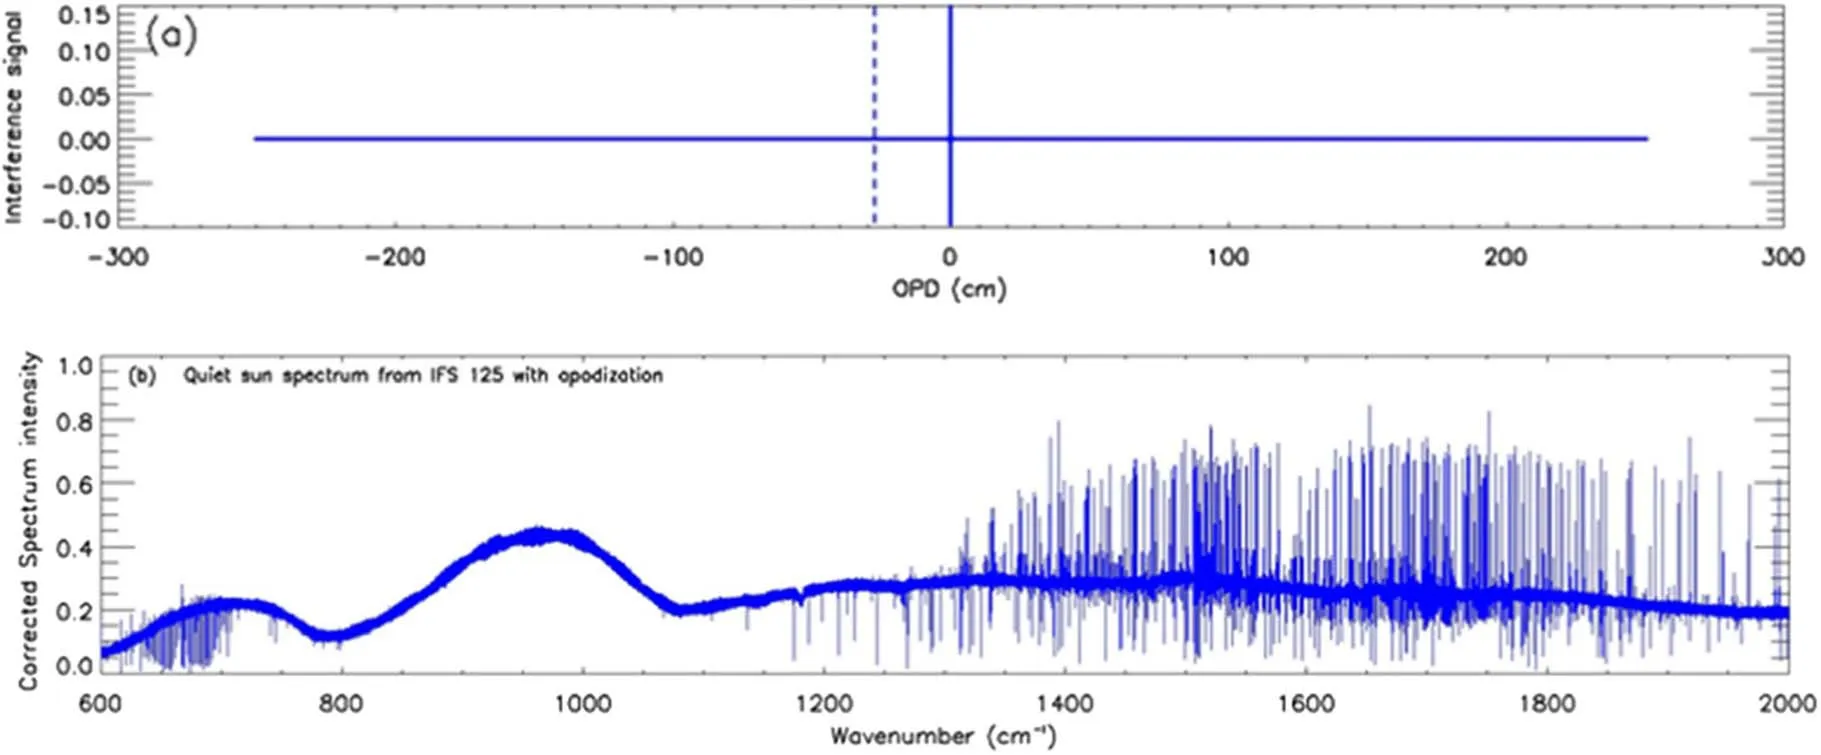
Figure 2.Panel (a): Interferogram taken with the glowbar and the CO2 gas cell inside the Bruker IFS-125HR.Panel (b): The corresponding broadband spectrum.
3.Measurement and Correction of the Background Radiation from the Observed Solar Spectrum
3.1.Brief Introduction of the Updated Sunlight Feeding Experimental System
The maximum wavenumber taken by the sunlight feeding experimental system in Bai et al.(2021) is about 4545 cm−1and the other part of the solar spectrum is cut off by the optical fiber.Moreover, the collecting area of the telescope is small since the diameter of the primary mirror is 10 cm.So, we update the sunlight feeding experimental system and present its optical diagram in Figure 4.The main differences from Bai et al.(2021) are:
1.All of the optical elements are reflecting mirrors so as to cover a broad wavelength range from visible to midinfrared.
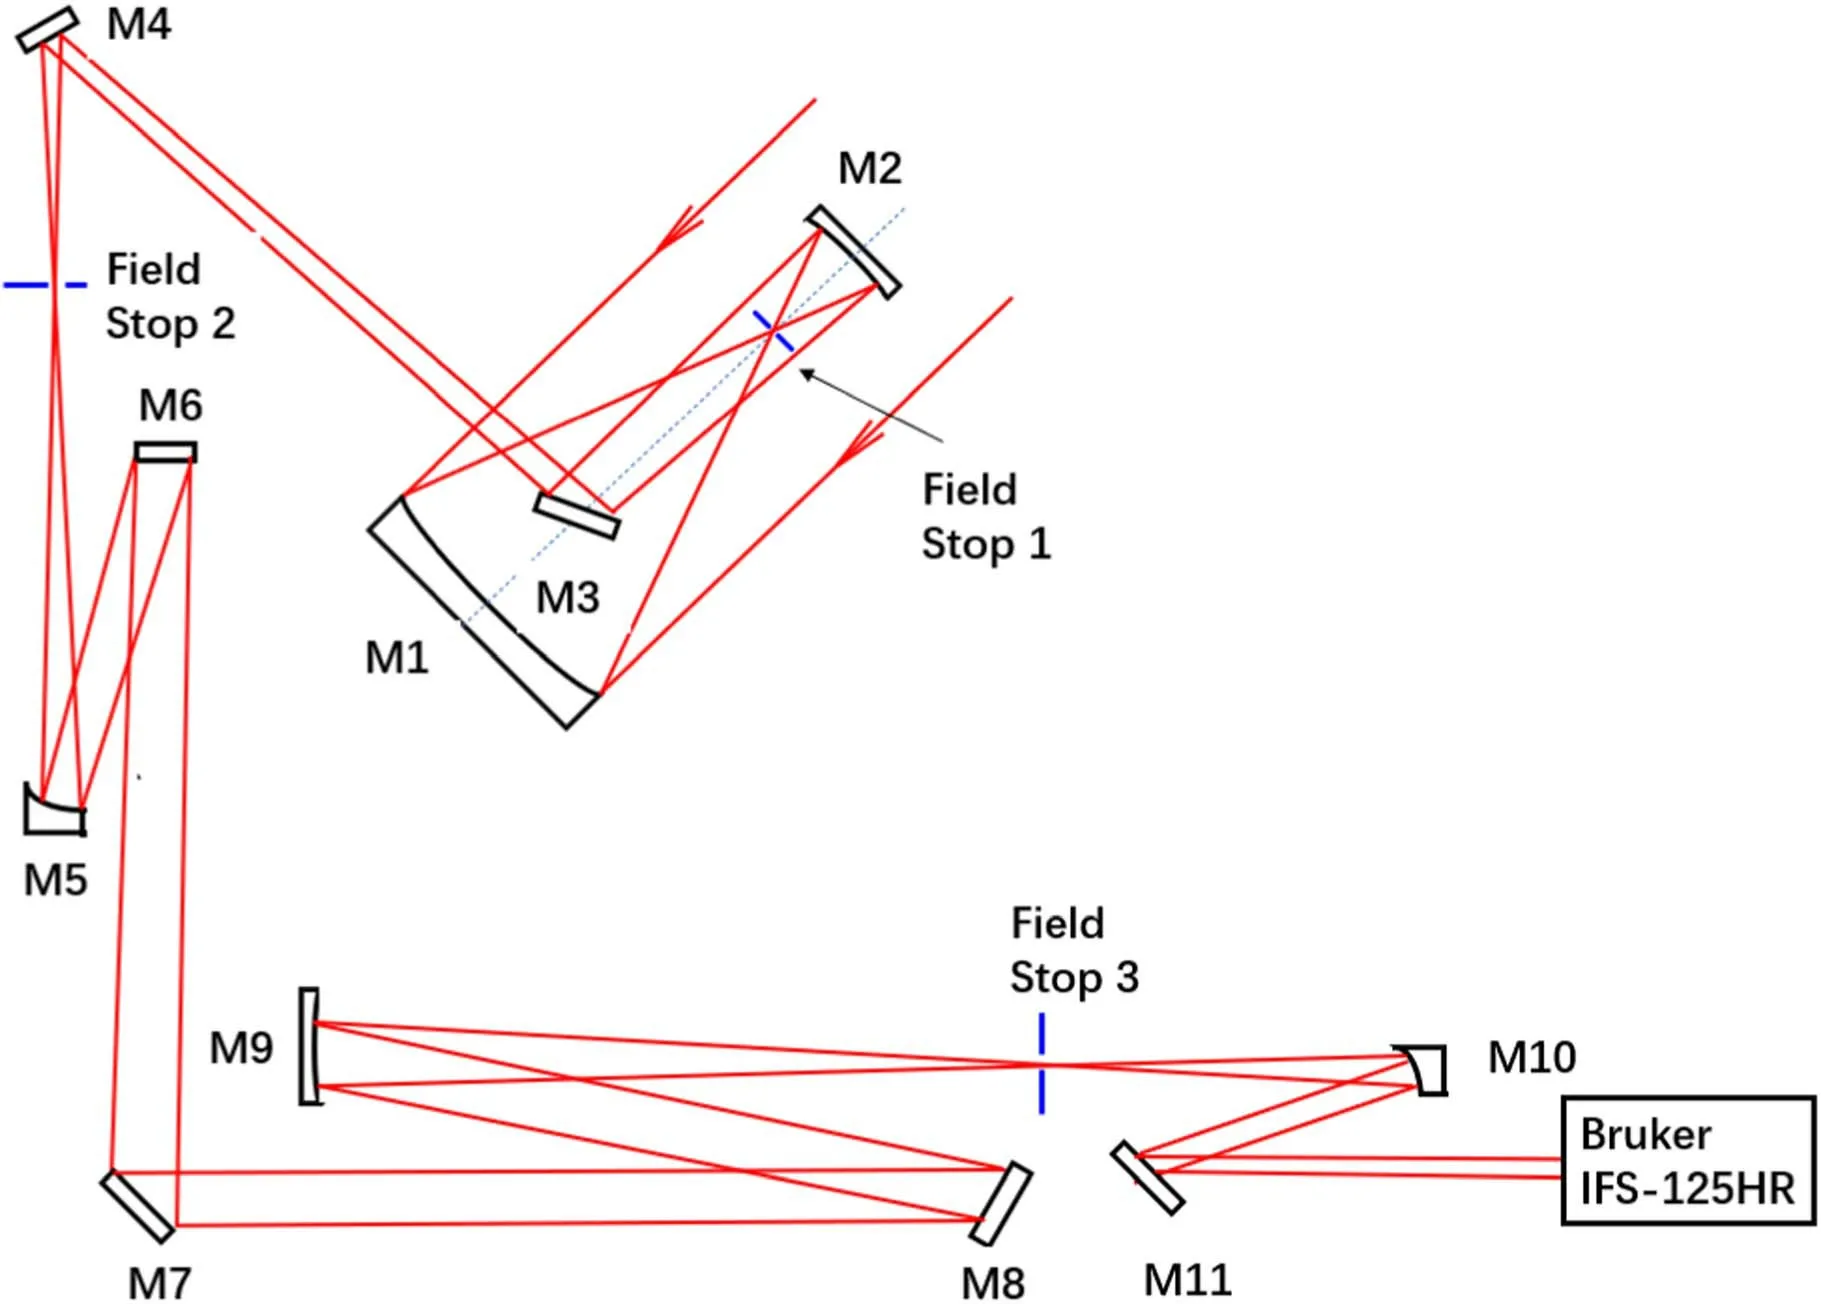
Figure 4.Optical layout of the updated fully reflective sunlight feeding system for the Bruker IFS-125HR.
2.We used an existing telescope at HSOS, with a larger aperture of 60 cm to collect more photons.The original Cassegrain system is updated to a Gregorian system having two field stops (1 and 2 in Figure 4) with an effective focal length of 10 m.Sunlight from the Gregorian system is reflected to the vertical optical path by two plane mirrors (M3 and M4) and arrives at field stop 2.The convergent sunlight after field stop 2 is further collimated by an off-axis parabolic mirror (M5)with a focal length of 200 cm.With the assistance of two plane mirrors (M6 and M7), the collimated sunlight is converted from the vertical to the horizontal path.The horizontal path has an on-axis parabolic mirror(M9)with a focal length of 600 cm, field stop 3, an off-axis parabolic mirror(M10)with a focal length of 50 cm,and two plane mirrors (M8 and M11).After the final plane mirror M11,the collimated sunlight from a partial region of the Sun is fed into the Bruker IFS-125HR.The collimated sunlight is focused by an off-axis parabolic mirror with a focal length of 41.8 cm inside the Bruker IFS-125HR.The effective focal length of the sunlight feeding system at the focus of Bruker IFS-125HR is about 25.2 m.The field of view observed by the FTS is selected through rotating the field stop wheels of different apertures.
3.The Gregorian telescope (M1–M3) is mounted on an equatorial platform which can point at and track the Sun.We can also point the telescope to the sky near the Sun within several seconds to record background radiation from both the Earth’s atmosphere and the telescope itself.All of the field stops used in the experimental system are not cooled so far.
3.2.The Solar Spectrum and Background Radiation near 12.32 μm
We carried out the solar spectral observation with the newly updated sunlight feeding experimental system and the Bruker IFS-125HR at 04:49 UT on 2021 March 20.A KBr beam splitter was selected to let the mid-infrared radiation transmit.Meanwhile, the radiation was received by a HgCdTe detector cooled by liquid nitrogen.Only the detector worked at low temperature during the observation.
It is well known that infrared observation is seriously influenced by the background radiation coming from both the Earth’s atmosphere and the telescope.To remove the background radiation, we take two measurement steps.In the first,an interferogram Iigmis taken by pointing the telescope to a quiet Sun region near the center of the solar disk.The other background interferogramis done by pointing the telescope to a clear sky region with an angle of about one degree away from the disk center.
To obtain the solar interferogram Iigm, the configuration of the Bruker IFS-125HR is listed below:
1.The OPD is from −1.8 to 180 cm.The highest spectral resolution is 0.005 cm−1as the resolution equals 0.9/L,where L is the maximum OPD.IFS-125HR takes singleside interferograms and needs a short double-side interferogram to calculate and correct the phase errors.The OPD of the double-side interferogram is 1.8 cm,corresponding to a phase correction resolution of 0.5 cm−1.
2.The OPD interval is 2.215 μm and the reconstructed wavelength is larger than 4.43 μm according to the Nyquist sampling theorem.The scanning velocity is set to 40,000 points per second.It takes about 21 s to finish one interferogram acquisition within the above OPD range.
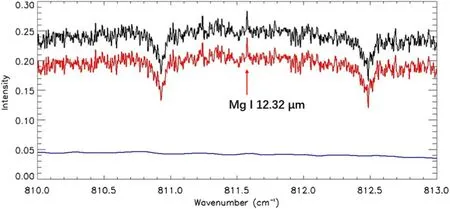
Figure 6.The background (blue line) radiation, and the original (black) and background corrected (red) Mg I 12.32 μm spectrum from Bruker IFS-125HR.
3.The aperture in the field stop wheel of the Bruker IFS-125HR is set to 2 mm, thus the field of view isFor the background interferogramthe configuration during the observation is almost the same,except that the OPD is set to ±9 cm.The temporal resolution is about 1 s.The original observed Iigm(blue curve) and(green curve) are shown in Figure 5(a).Figure 5(b)is the zoomed-in region with the OPD from −0.06 to 0.06 cm.The background radiation is clearly seen.The quasi-periodic pattern in the interferogram is generated from the narrowband filter.The transmitted wavenumber range of the FTS is very broad and the shot noise from the broadband radiation will be included on each point of the interferogram.If a narrowband filter is adopted, the shot noise outside the target wave band will be less and the S/N of the solar spectrum will be higher.The Gaussian-type large-scale curve in the interferogram is caused by the absorption lines both from the solar and Earth’s atmospheres.Figure 5(c)displays the inverted solar spectrum I (blue) and the background spectrum Ibgd(green) with the inversion algorithm in Bai et al.(2021).Different from the original solar spectrum,the background spectrum just has a continuum component and we cannot find any absorption lines due to its low resolution.The result is reasonable because our target is the cold Earth sky and the formation mechanism is blackbody continuous radiation.The ratio of the original solar and background radiation also depends on wavenumber.
Once the original solar spectrum I and the background radiation Ibgdare known,we can obtain the real solar spectrum with the equation
Figure 6 presents the three curves of I, Ibgdand ISunnear 12.3 μm in black,blue,and red,respectively.The emission line near 811.6 cm−1is Mg I 12.32 μm, the target line of AIMS,which is first observed here in the Chinese solar community.The two nearby absorption lines originated from CO2molecules in the Earth’s atmosphere and can be used for monitoring the long-time stability of the FTS as well as executing the wavelength calibration to produce high-level scientific data from AIMS.The FWHM of the background corrected Mg I 12.32 line is about 0.0086 ±0.0019 cm−1(including the FTS instrumental profile), while it is about 0.017 cm−1in Brault’s observation(Brault&Noyes 1983).For the continuum region, the value of the original I is about 0.24 and the background radiation is about 0.045.The original solar radiation is 5.33 times that of the background.As only the detector is cooled in our experimental system, the thermal radiation from the field stops and thermal optical elements will also contribute to the background radiation.HSOS has an elevation of 60 m and is near a reservoir, so the influence of water vapor is also high.All the above resulted in a large amount of background radiation.AIMS will be installed at Lenghu Station with an elevation of 4000 m, and since the telescope has a cryogenic detector as well as optical elements,the background radiation should be much less than what is in our observation.Furthermore, the S/N of the original and background corrected spectrum is 35.1 and 29.67,respectively.As the background radiation is taken with very low resolution and has high S/N,the S/N almost remains the same during the background correction process.
3.3.The Solar Spectrum and Background Radiation near 4.66 μm
We also changed a narrowband filter centered near 2150 cm−1(4.65 μm) with a width of ≈80 cm−1to observe the solar spectrum near 4.66 μm at 07:08 UT on the same day.Similar to the observation near 12.3 μm, two interferograms,i.e.,Iigmandare taken and shown in Figure 7(a).The OPD of Iigmis from −10 cm to 90 cm, indicating the spectral resolution is 0.01 cm−1.The OPD interval is 1.898 μm and wavelengths larger than 3.8 μm can be reconstructed.Acquiring all data points in Iigmcosts 13.2 s with 40,000 interference points sampled per second.
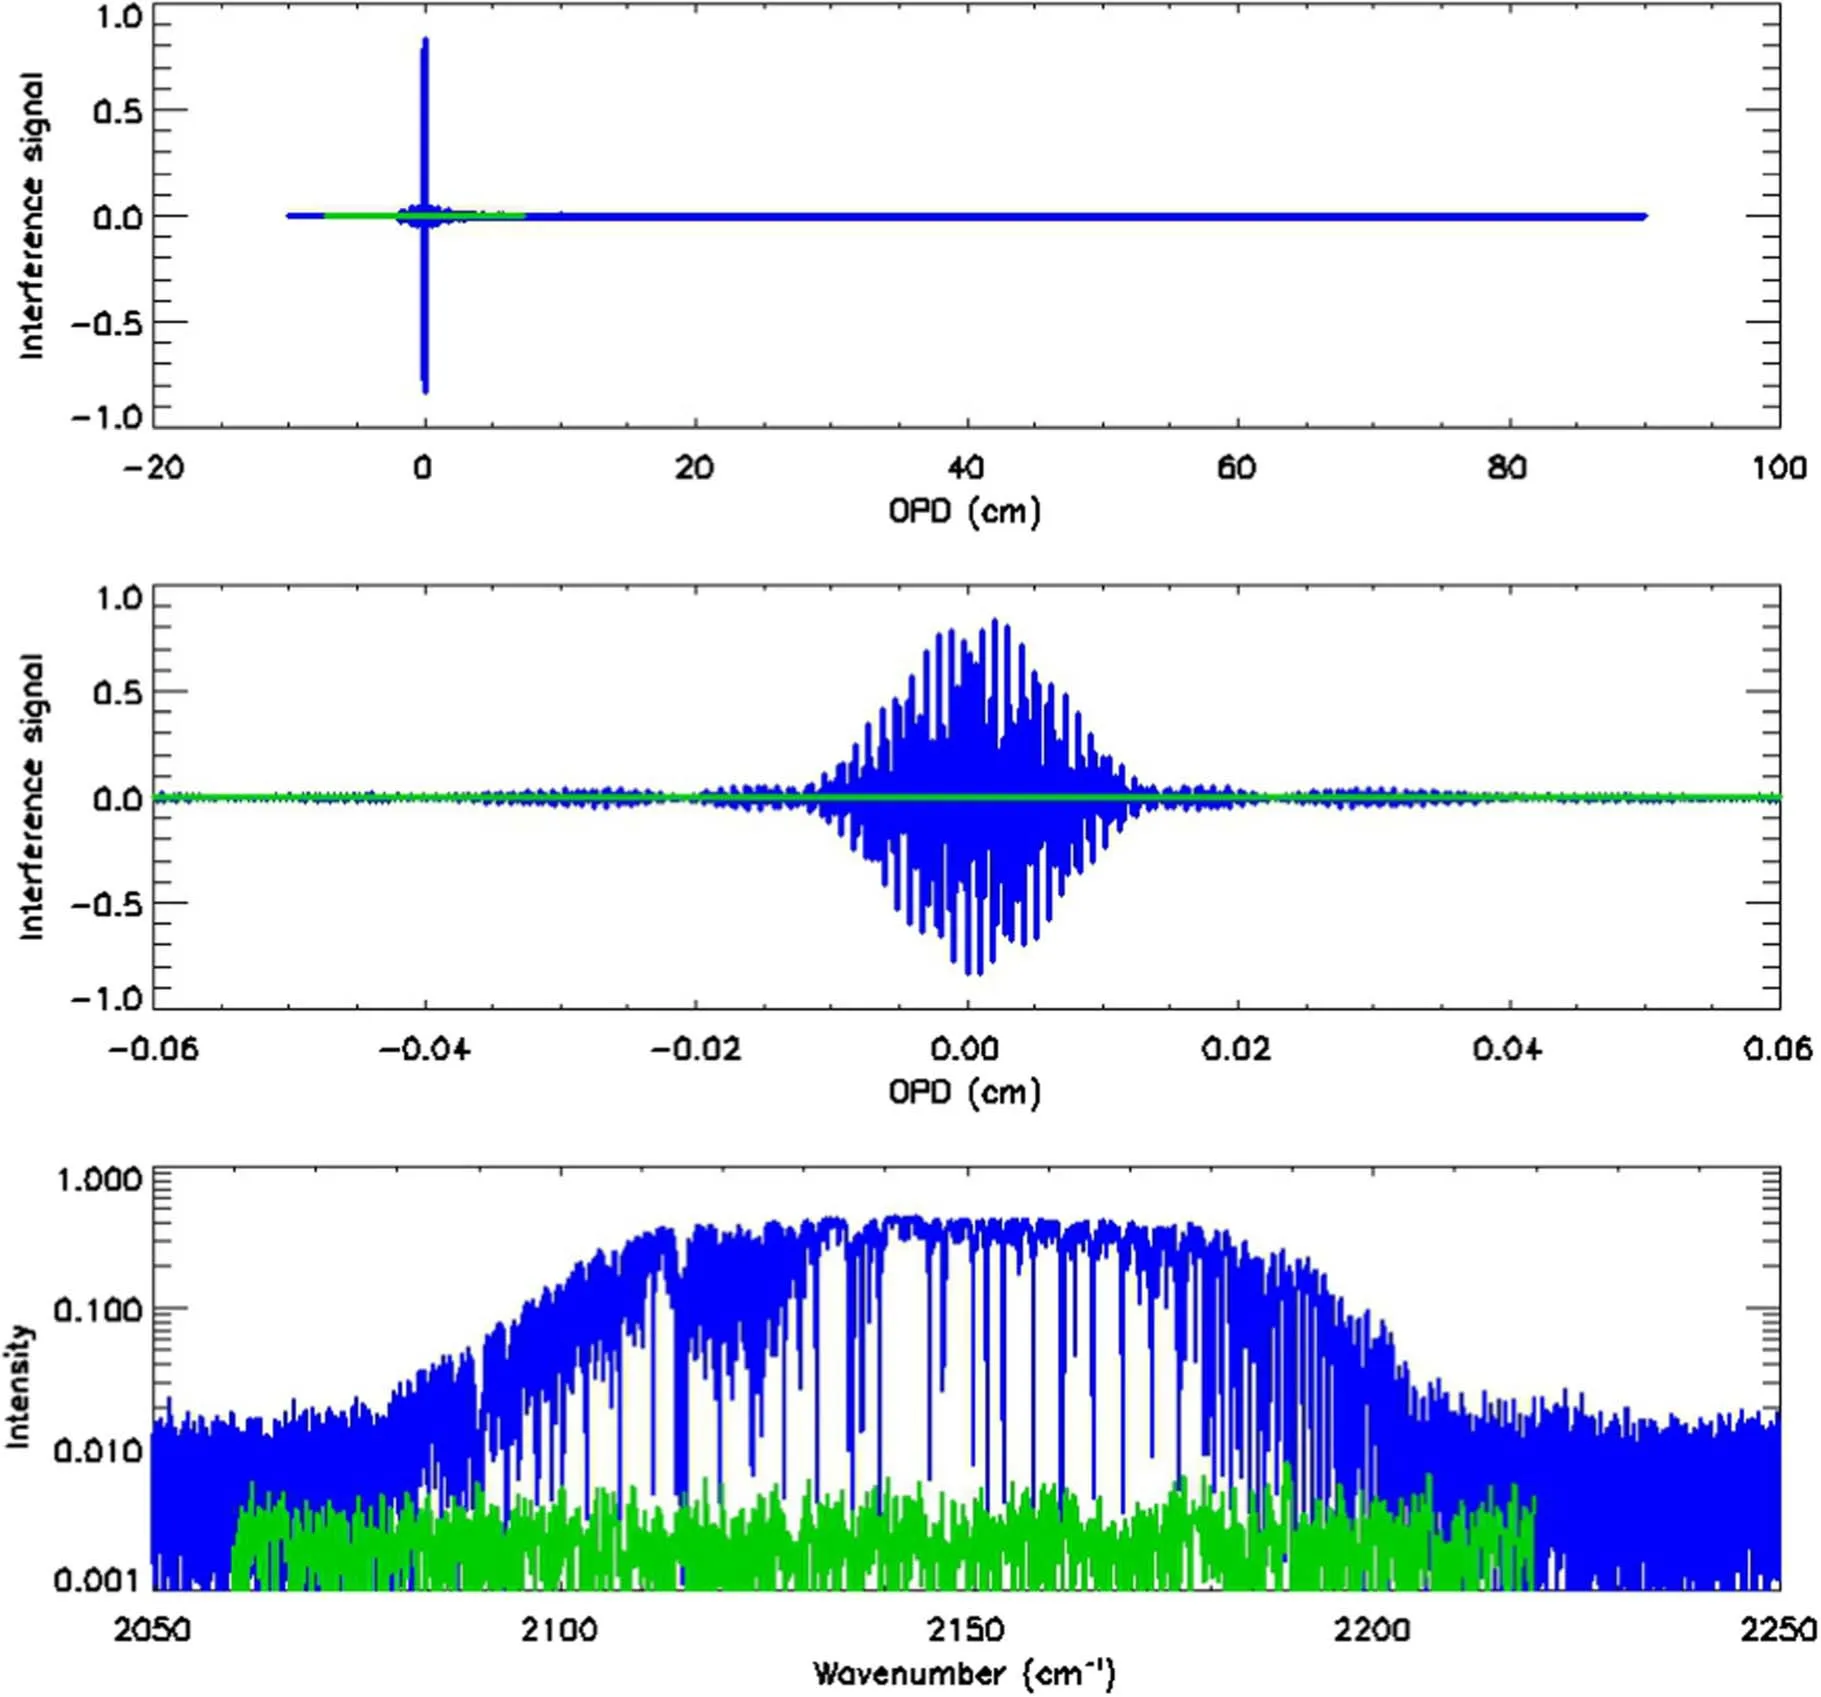
Figure 7.Same as Figure 5, but for the radiation from 2050 to 2250 cm−1.
The OPD of the background interferogramis taken from−9 to 9 cm with a resolution of 0.1 cm−1so as to increase the S/N of the inverted background spectrum.Figure 7(b) is the zoom-in of interferograms of Iigm(blue) and(green).The corresponding inverted spectra I and Ibgdare displayed in Figure 7(c).Many absorption lines exist in the wave band.Moreover,the background radiation is very weak near 4.6 μm.
The background corrected spectrum ISunand the background radiation Ibgdnear CO 4.667 μm are depicted in Figure 8.The CO lines studied in Li et al.(2020), Song et al.(2023), and Uitenbroek et al.(1994) are identified.Both ISunand Ibgdare normalized with the continuum of ISun.The background radiation is about 0.006, meaning that the solar radiation is 166.6 times as much as that of the background.The ratio between the background and solar radiation at CO 4.66 μm is much larger than the value at Mg I 12.32 μm.The result is reasonable since the radiation at short wavelengths is less influenced by the thermal background.The S/N is 77.2 after correcting the background spectrum.We also overplot the solar spectrum (green line) taken by the FTS at Kitt Peak Observatory (Livingston & Wallace 1991).The two curves are consistent with each other, indicating the effectiveness of our configuration of our FTS,and both the inversion algorithm from interferogram to spectrum and the background correction method.The disparity near 2142.3 cm−1is caused by the different absorptions from the Earth’s atmosphere.
4.Conclusion and Future Perspective
We developed a fully reflective sunlight feeding system and successfully observed a high-resolution infrared solar spectrum larger than 2.5 μm with the Bruker IFS-125HR, a first for the Chinese astronomical community.The main results from the new observing system are summarized as follows:
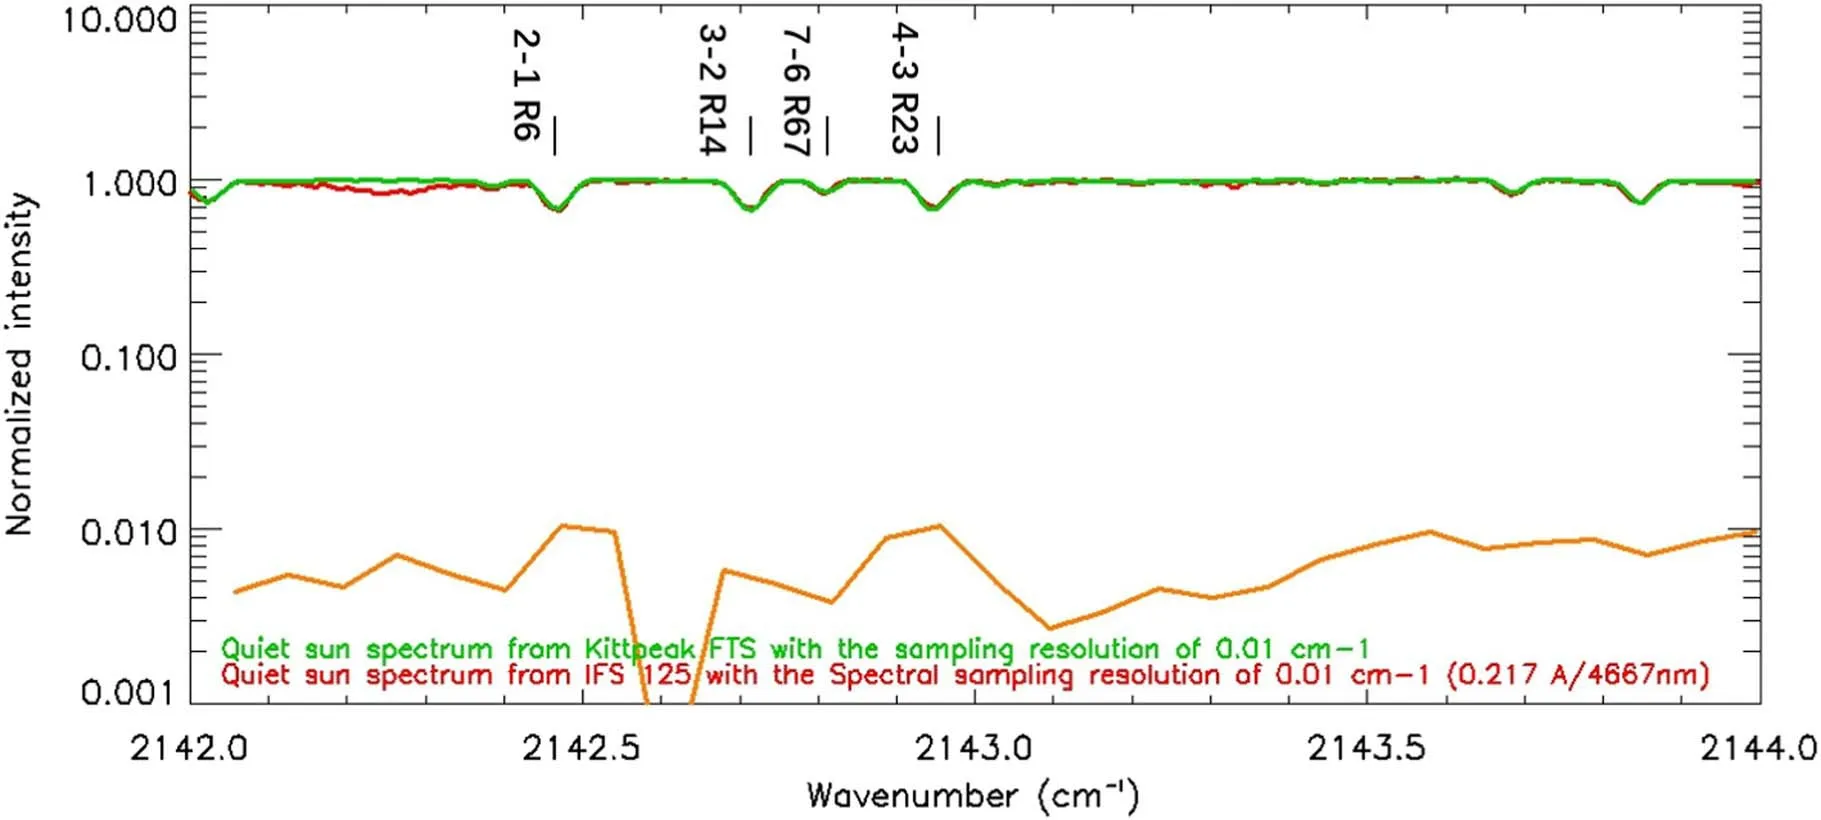
Figure 8.The background(orange line)radiation and background corrected(red)CO 4.667 μm spectrum from Bruker IFS-125HR.The green line is that from the Kitt Peak FTS for comparison.
1.We introduced the principle of the FTS’ spectral resolution calibration method with a gas cell working at low pressure.With the gas cell,the spectral resolution of the Bruker IFS-125HR is measured, which is 0.00342±0.00086 cm−1and 0.0059 ±0.00024 cm−1at wavenumbers of 798 cm−1and 2136 cm−1, respectively.
2.The infrared background radiation is measured by quickly pointing the telescope to the sky nearby after the solar spectrum is taken.The ratio of the original solar spectrum and background radiation on 2021 March 20 at HSOS is about 166.6 and 5.33 at 2142 cm−1and 811 cm−1,respectively.The background radiation can be effectively removed in the inverted solar spectrum.We suggest using a low-resolution background spectrum by setting smaller OPD of the FTS to correct the original solar spectrum as the S/N of this low-resolution background spectrum is higher.So, the S/N of the solar spectrum after background correction will be better.
3.We identified the Mg I 12.32 μm line in the background corrected quiet Sun spectrum.The OPD of the interferogram in the FTS is set to 180 cm,which is larger than the 100 cm used in Brault & Noyes (1983).The line width is about 0.0086 ±0.0019 cm−1, which is narrower than the value 0.017 cm−1from Brault & Noyes (1983).
4.We also identified the CO 4.66 μm lines in the background corrected quiet Sun spectrum.The OPD is configured almost the same as the data from Livingston&Wallace (1991)ʼs atlas.The background corrected CO lines agree well with the atlas data, verifying our inversion algorithm from interferogram to spectrum as well as the background radiation correction method.
The sunlight feeding system and the Bruker IFS-125HR provide a valuable platform both for the development of new infrared technologies and for scientific studies of the broadband solar spectrum at 0.4–25 μm.With the platform,we carried out solar spectral observation with the Bruker IFS-125HR equipped with a fast readout CMOS detector at visible wavelengths (Zhu et al.2022).Tens of thousands of interferograms with 20×80 pixels were obtained within less than one minute.After inversion,the data cube is derived with a two-dimensional image and a one-dimensional spectrum.Compared with a point source detector used here and a 64×2 detector used by AIMS, the solar spectral observation with a two-dimensional detector can make full use of the advantages of the FTS (Stenflo 2017) and significantly increase its temporal resolution.More works will be focused on the twodimensional solar FTS observation in the future thanks to the rapid development of detectors having fast readout speed and low noise.
The platform also provides a good reference for the instrumental calibration, observing mode design, and scientific data processing of the AIMS telescope.The data quality of AIMS will be influenced by the instrumental width (spectral resolution) of the FTS, the background radiation, and the S/N of the spectrum after background correction.Our work demonstrates that a gas cell with low pressure and suitable temperature is a convenient way to calibrate and monitor the spectral resolution variations of the AIMS.The sunlight can provide the background radiation used for generating absorption lines to derive the FWHM of an FTS.The gas cell is inserted into the light path of AIMS during the calibration process and is shifted out after calibration.The telescope for AIMS should be quickly pointed out of the solar disk to measure the background radiation both from the instrument and the Earth’s sky.The background radiation also needs to be measured with a certain cadence to monitor its variation.Regarding the S/N which determines the sensitivity of magnetic fields from AIMS, several methods are helpful.An FTS has the advantage of broadband spectral observation but the S/N is too low for a single wavelength point,especially for observation with high spectral resolution.Hence, the first method is to employ a narrowband filter so as to reduce the photon noise from the other wavelength range.We also suggest using moderate spectral resolution (e.g., 0.01 cm−1) for AIMS’s routine observation.Both the S/N and the temporal resolution will be increased then.Third, the spectral resolution of the background radiation measurement influences the S/N.As the background radiation is weaker than the solar spectrum,low spectral resolution is needed to increase the S/N.Multiframe superposition helps to improve S/N, too.In a word, AIMS’s observing mode for background radiation measurement should have the ability of quickly pointing to the solar disk, taking observations with low spectral resolution and multiframe integrations.In addition,the FTS of AIMS has a detector with 64×2 pixels.The central wavelength is different for each pixel.The two CO2telluric lines near the Mg I 12.32 μm working line shown in Figure 6 provide a good reference for accurate wavelength calibration.
Acknowledgments
This research work is supported by the National Key R&D Program of China (2021YFA1600500), the Youth Innovation Promotion Association CAS (2023061) and the National Natural Science Foundation of China (NSFC, Grant Nos.12003051 and 11427901).
ORCID iDs
 Research in Astronomy and Astrophysics2023年12期
- Research in Astronomy and Astrophysics的其它文章
- Large-scale Dynamics of Line-driven Winds with the Re-radiation Effect
- A Study of Elemental Abundance Pattern of the r-II Star HD 222925
- Preliminary Study of Photometric Redshifts Based on the Wide Field Survey Telescope
- Density Functional Theory Calculations on the Interstellar Formation of Biomolecules
- Detection Capability Evaluation of Lunar Mineralogical Spectrometer:Results from Ground Experimental Data
- A Comparison of Co-temporal Vector Magnetograms Obtained with HMI/SDO and SP/Hinode