
A dual-RPA based lateral flow strip for sensitive,on-site detection of CP4-EPSPS and Cry1Ab/Ac genes in genetically modified crops
2024-02-16 07:14JinbinWngYuWngXiuwenHuYifnChenWeiJingXiofengLiuJunLiuLemeiZhuHijunZengHuLiu
食品科学与人类健康(英文) 2024年1期
Jinbin Wng,Yu Wng,Xiuwen Hu,Yifn Chen,b,Wei Jing,b,Xiofeng Liu,Jun Liu,Lemei Zhu,Hijun Zeng,b,*,Hu Liu,b,*
a Key Laboratory of Agricultural Genetics and Breeding,Institute of Biotechnology Research,Shanghai Academy of Agricultural Sciences,Shanghai 201106,China
b Crops Ecological Environment Security Inspection and Supervision Center (Shanghai),Ministry of Agriculture and Rural Affairs,Shanghai 201106,China
c School of Life Science and Engineering,Lanzhou University of Technology,Lanzhou 730050,China
d School of Public Health,Changsha Medical University,Changsha 410219,China
e Academician Workstation,Changsha Medical University,Changsha 410219,China
Keywords:Genetically modified crops On-site detection Lateral flow test strips Dual recombinase polymerase amplification(RPA)
ABSTRACT Traditional transgenic detection methods require high test conditions and struggle to be both sensitive and efficient.In this study,a one-tube dual recombinase polymerase amplification (RPA) reaction system for CP4-EPSPS and Cry1Ab/Ac was proposed and combined with a lateral flow immunochromatographic assay,named “Dual-RPA-LFD”,to visualize the dual detection of genetically modified (GM) crops.In which,the herbicide tolerance gene CP4-EPSPS and the insect resistance gene Cry1Ab/Ac were selected as targets taking into account the current status of the most widespread application of insect resistance and herbicide tolerance traits and their stacked traits.Gradient diluted plasmids,transgenic standards,and actual samples were used as templates to conduct sensitivity,specificity,and practicality assays,respectively.The constructed method achieved the visual detection of plasmid at levels as low as 100 copies,demonstrating its high sensitivity.In addition,good applicability to transgenic samples was observed,with no cross-interference between two test lines and no influence from other genes.In conclusion,this strategy achieved the expected purpose of simultaneous detection of the two popular targets in GM crops within 20 min at 37 °C in a rapid,equipmentfree field manner,providing a new alternative for rapid screening for transgenic assays in the field.
1. Introduction
In recent years,the wide-scale application of genetically modified crops has been beneficial for the development of environmentally friendly agricultural products[1].However,disputes regarding genetically modified (GM) crops have been persistent[2],and corresponding risk assessment and safety testing efforts are necessary and urgently required[3,4].In 2019,the number of stacked insect resistance/herbicide tolerance (IR/HT) traits grew by 6%,and these crops covered 45% of the global GM crop acreage,making stacked IR/HT traits the dominant trait in GM crops for the first time[5].Thus,related IR/HT genes have become the mainstream target genes for rapid transgenic testing.CP4-EPSPS,pat,andbarare the genes commonly found in herbicide-tolerant crops,and most commercial glyphosate-resistant crops containCP4-EPSPSgenes[6].Additionally,theCrygene ofBacillus thuringiensis(Bt),which is able to resist a wide range of pests (Lepidopterons,Coleopterans,and Dipterans),has been widely employed in most insect-resistant transgenic crops[7].
Many nucleic acid or protein-based transgenic detection methods have been established and commercially applied to monitor GM crops.DNA-based polymerase chain reaction (PCR) and protein-based enzyme-linked immunosorbent assays (ELISA) are often regarded as the traditional methods for GM crops detection[8,9].Protein-based immunological methods used to be popular forin situdetection due to their simplicity,speed and ease of operation,but these methods are based on active structures and thus susceptible to poor interference resistance and sample denaturation[10].PCR methodologies rely on a variety of instruments and equipment,and have high requirements for skilled operators and laboratory conditions[11].Although these methods (PCR and ELISA) have excellent reliability and stability in practical applications,with the increasing number of GM crops yield and complex stacked traits,more advanced techniques are needed to enable efficient detection in outdoor environments.
Currently,many new techniques for nucleic acid amplification have circumvented the limitations of traditional PCR methods in terms of time and equipment,providing new tools for GM crops detection[12],such as loop-mediated isothermal amplification(LAMP),helicase-dependent amplification (HDA),and recombinase polymerase amplification (RPA)[13,14].Among them,RPA has been widely used for nucleic acid detection because of its high efficiency and easily achievable reaction temperature(37−42 °C)[15].Recently,strategies such as RPA combined with agarose gel electrophoresis (RPA-AGE)[16],real-time fluorescent RPA (RT-RPA)[15,17],RPA combined with DNA fluorescent dye(RPA-SYBR Green I)[18,19],RPA combined with lateral flow immunochromatography (RPA-LFD)[20,21]and RPA combined with Cas12a cleavage system (RPA-Cas12a-FS)[22]have been established and implemented in the field of rapid detection.Among these methods,the test strip method is the most suitable for on-site testing for its full independence of testing equipment.
In this study,a dual RPA system was constructed by labeling the forward and reverse fragments of the two primer pairs separately,aiming to achieve simultaneous detection ofCP4-EPSPSandBt-Cry1Ab/Acgenes using a single immunochromatographic test strip.For this strategy,the amplification products of two different markers in one reaction system can be captured by the corresponding antibodies on the test strips respectively,and the corresponding antibody-fixed zone turns red,which can be judged by the naked eye.Without relying on equipment such as a PCR instrument or an electrophoresis instrument,this procedure can be performed in a field environment and meet the needs of rapid detection for simultaneous identification ofCP4-EPSPSandBt-Cry1Ab/Acgenes.Besides,the results show that the method possesses good detection performance and stability.
2. Materials and methods
2.1 Materials and chemicals
Ultra-Rapid Nucleic Acid Release Agents (for DNA) were purchased from Weifang Ample Future Biotechnology (Weifang,China).TwistAmp®Basic Kits were purchased from Morey Biosciences (Shanghai,China).The oligonucleotides needed were synthesized and purified by Sangon Biotech (Shanghai,China).r-SA,Digoxin antibody of LSBio,goat anti-rabbit immunoglobulin G(IgG) antibody,and colloidal gold-labeled fluorescein isothiocyanate(FITC) antibody were from Beijing Bersee Science and Technology Co.,Ltd.(Beijing,China),Beijing Biocreative Technology Co.,Ltd.(Beijing,China),Beijing Solarbio Science and Technology Co.,Ltd.(Beijing,China) and Beijing Biosynthesis Biotechnology Co.,Ltd.(Beijing,China),respectively.Protein-based commercializedCP4-EPSPSandCry1Ab/Acimmunogold rapid test cards were obtained from Genesino Biological S&T Development Co.,Ltd.(Dalian,China) and Shanghai YouLong Biotech Co.,Ltd.(Shanghai,China),respectively.Seed powder standards for 15 GM crops were obtained from American Oil Chemists’ Society (AOCS) (Urbana,IL,USA),and 5 actual samples of maize,soybeans and rice were obtained from local markets (Shanghai,China).All solvents and other chemicals were of analytical reagent grade.
2.2 Preparation of test strips
The lateral flow strip is composed of a sample pad,conjugate pad,nitrocellulose (NC) membrane,absorbent pad,and a backing card.1 mg/mL r-SA,1 mg/mL Digoxin antibody,and 0.75 mg/mL goat anti-rabbit IgG antibody were distributed onto the NC membrane with a volume of 1 μL/cm to form test line 1,test line 2 and the control line.The conjugate pad was dispensed colloidal gold-labeled FITC antibody,followed by drying at 37 °C for 1 h.The blotted membrane,conjugate pad,sample pad,and absorbent pad were assembled sequentially on the plastic backing board with a 1–2 mm overlap.The assembly was cut into a 3 mm width using a CM 4000 guillotine cutter (Bio-Dot,CA,USA) and then sealed in a plastic bag with desiccant.
2.3 Rapid extraction of genomic DNA from GM crops
The extraction of sample genomic DNAs was performed using an ultra-fast nucleic acid release agent for DNA.The steps involved simple grinding of seed powder standards or other plant tissues,transferring approximately 2 mg of powdered seeds to 20 μL of a release agent,and incubating this mixed slurry for 5 min,followed by flicking and mixing.The desired DNA was present in the lysis supernatant.DNA (100–200 ng) was used as template for the amplification reaction.
2.4 Primer optimization and RPA
Using the relevant national standards and the sequence of synthetic constructCP4-EPSPSandCry1Ab/Acgenes available in the National Center for Biotechnology Information (NCBI) with the accession numbers AF464188 and KJ701603,RPA primers related to theCP4-EPSPSandCry1Ab/Acgenes were designed and screened according to the special requirements for primers for RPA reactions.
For the purpose of simultaneous detection of multiple genes using a lateral flow test strip,the same group was used to label reverse primers of these genes,and different groups were employed to label forward primers.The detailed sequences information is shown in Table S1.
To obtain a better visual effect and higher sensitivity,the primer concentration and dosage ratio of the two primer pairs were screened.At first,the two primer pairs were screened separately at 3,5,7 and 9 μmol/L to determine the appropriate concentration for achieving a visualization effect.Subsequently,different ratios of these two primer pairs at 3:5,5:5,7:5,and 9:5 (Cry1Ab/Ac:CP4-EPSPS) were used to establish a suitable reaction system for duplex detection.Primer concentration screening was carried out using a control plasmid at 106copies/μL and a blank control without the DNA template for each assay.
The RPA assay was carried out at 37 °C for 12 min,following recommendations from a previously optimized reaction system of 50 μL with slight modifications[20].After incubation,the RPA products were flicked to mix.Agarose gel electrophoresis used to verify RPA reaction.The amplification products were verified via agarose gel(3%) electrophoresis after purification by an equal volume of phenolchloroform.
2.5 Construction of dual-RPA-LFD method
In this study,a detection strategy combining dual-RPA and lateral flow chromatography was constructed for the exogenous genesCP4-EPSPSandCry1Ab/Acfor transgenic products.Firstly,a dual RPA reaction was performed,then,5 μL of RPA product was pipetted to sample pad of the test strip,followed by lateral flow immunochromatography of the test strip in 70 μL buffer.The detailed procedure is shown in Fig.1.Sample treatment was conducted for 1 min,rapid DNA extraction took 5 min,and an RPA reaction took 12 min,with a lateral flow test strip assay of RPA products and visual judgment of results taking 2 min.
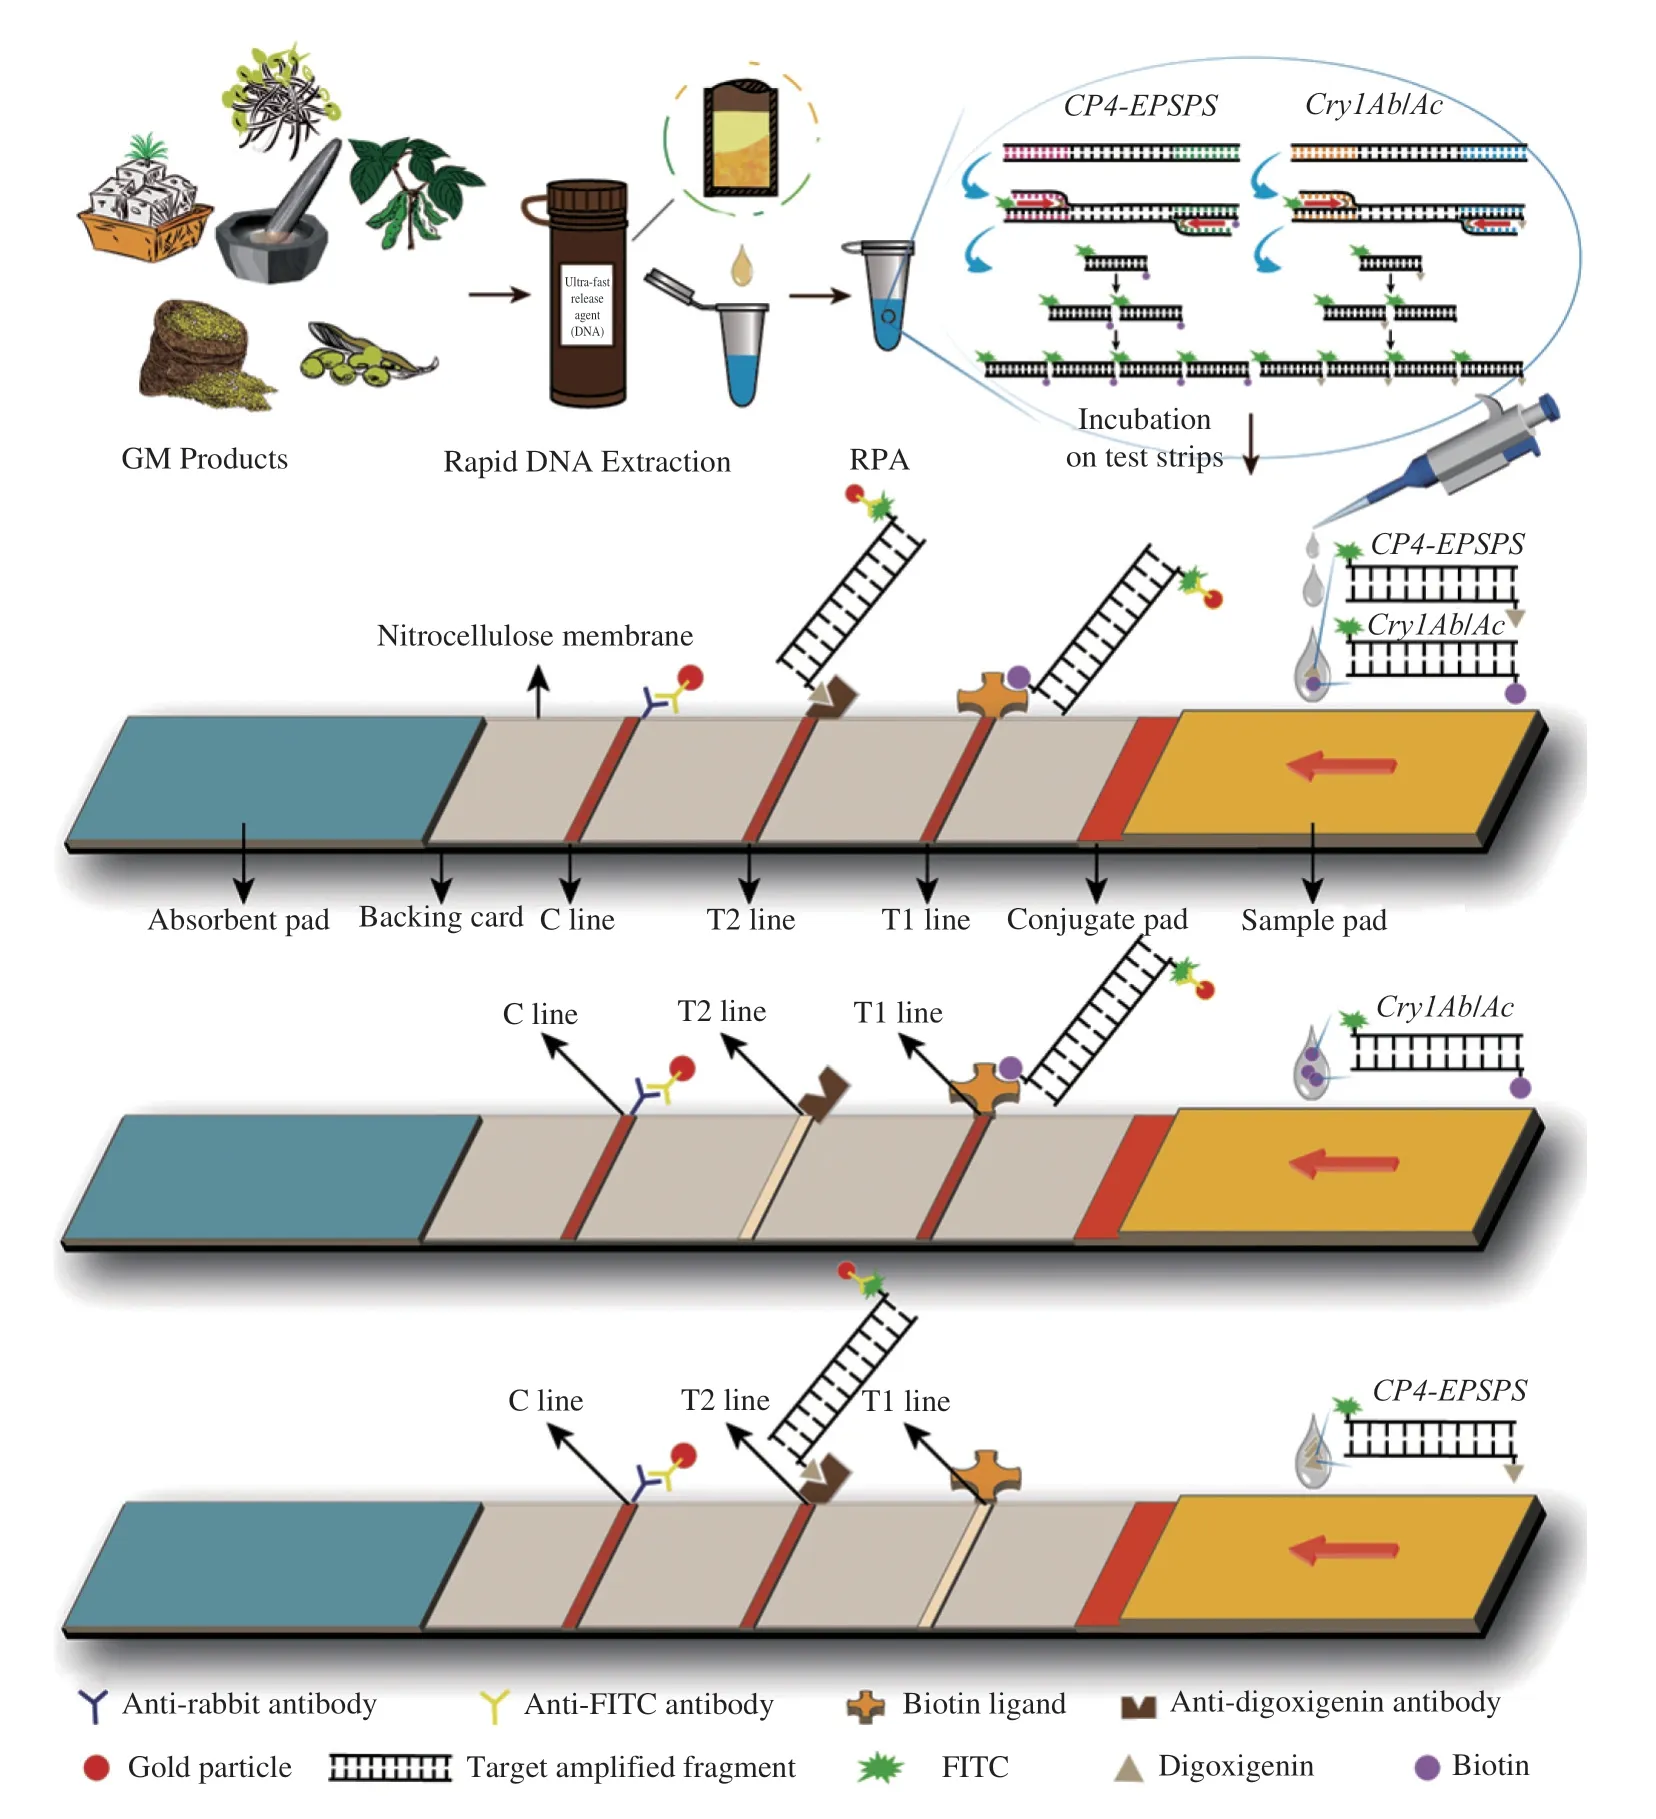
Fig.1 Schematic diagram of dual-RPA-LFD.
Due to the differences in primer labeling groups,the amplification products of theCry1Ab/Acgenes were labeled with FITC and biotin at the two respective ends,while theCP4-EPSPS-related amplification products were labeled with FITC and digoxigenin.The construction of the test strip was customized according to the characteristics of the two types of RPA products.The T1 line immobilized with biotinligand corresponded toCry1Ab/Ac.The T2 line carrying an antidigoxigenin antibody responded to theCP4-EPSPSproducts.If these genes were present in a sample,the product first bound to the colloidal gold-labeled anti-FITC antibody in the conjugate pad of the test strip,and then to the capture antibody encapsulated on the T1 line and T2 line.The accumulated colloidal gold appeared as three distinct red lines at the C line,T1 line and T2 line.If onlyCry1Ab/AcorCP4-EPSPSwas present in the sample,only the C line and the corresponding T1 line or T2 line were visible.Without these two genes,only the control zone (C line) showed a red band.
All the RPA products corresponding to these test strip assays were subjected to agarose gel electrophoresis to assess whether an amplification reaction occurred.And controls were set up in the experiment: “P” represented a positive control with plasmid as a DNA template,and “N” represented a blank control without template.
2.6 Specificity of dual-RPA-LFD assays
Specificity assays were conducted by observing the effect of this dual-RPA-LFD procedure on a series of transgenic standards containing or not containing theCP4-EPSPSandCry1Ab/Acgenes.Standard plasmids containing the assayed genes were used as a positive control,and a blank control without template was also set up.The extraction of genomic DNA from different samples was performed in batches using the same steps,while the other reaction steps were identical.Twelve GM crop standards were used in each assay,including maize NK603,soybean RRS,sugar beet H7-1,pima cotton MON88913,and pima cotton MON89788,which contained theCP4-EPSPSgene;oilseed rape MS1 and RF1,which contained neitherCP4-EPSPSnorCry1Ab/Ac;maize Bt11,and rice KMD1,which contained theCry1Abgene;and pima cotton MON531 and soybean MON87701 and rice KF6,which contained theCry1Acgene.
2.7 Molecular sensitivity of dual-RPA-LFD
Plasmid standards containing theCP4-EPSPSandCry1Ab/Acgenes were constructed by Biotech (Shanghai,China) in the pESI-T vector,and the same concentrations of two plasmids were employed as reaction templates in our RPA system.Standard plasmids were diluted in 10-fold gradients at concentrations of 106,105,104,1 000,100,10,1,and 0 copies/μL for sensitivity analysis.The RPA reactions were run simultaneously using the same conditions for each concentration gradient group.
2.8 Complex sample analysis
To establish the applicability of the dual-RPA-LFD procedure to complex samples in a field-testing scenario,non-GM,as well as GM crops with different GM components,were randomly mixed and tested using this dual-RPA-LFD procedure.The reliability of this assay was assessed by comparing the color development results of these test strips with the gene information measured using the current standards for each sample (Table S2).
The ability and practicability of our method was further verified by randomly testing two corn samples,two soybean samples and one rice sample in a market setting.To ensure the correctness of this assay,the same samples were ground to powders.The protein was extracted using PBS (0.1 mol/L,pH 7.2) at 1:3 (Vsamples/VPBS),which was then validated using commercial protein-based immunochromatographic test strips.
2.9 Data analysis
To add objectivity to the test results on the basis of visual determination,all strips were photographed and scanned in grayscale using ImageJ software (National Institutes of Health,Bethesda,MD)for the colored region,which was recorded as the peak area of this zone.The operation of scanning was repeated three times for each zone.Data was expressed as bar graphs representing the mean ±standard deviation (SD) by GraphPad Prism software version 7.0(GraphPad Software Inc.,CA,USA).The comparison of each group with the negative control group was performed by one-way analysis of variance (ANOVA).P<0.05 was considered statistically significant.
3. Results
3.1 Primer dosage optimization
When using a pair of primers,as shown in Fig.2A,the trend of the T1 line of this test strip was consistent with that of the T2 line as the primer concentration changed.At a low primer concentration(3 μmol/L),no clear T-line could be formed on these test strips under positive conditions.The T-line was visible for positive samples at a primer concentration of 5 μmol/L,and the distinction between negative and positive was obvious.Moreover,when the primer concentration was increased to 7 μmol/L,a non-specific faint T-line started to be observable in negative conditions.Therefore,a primer concentration of 5 μmol/L was determined to be the most appropriate concentration for visualization of both the T1 line and T2 line.
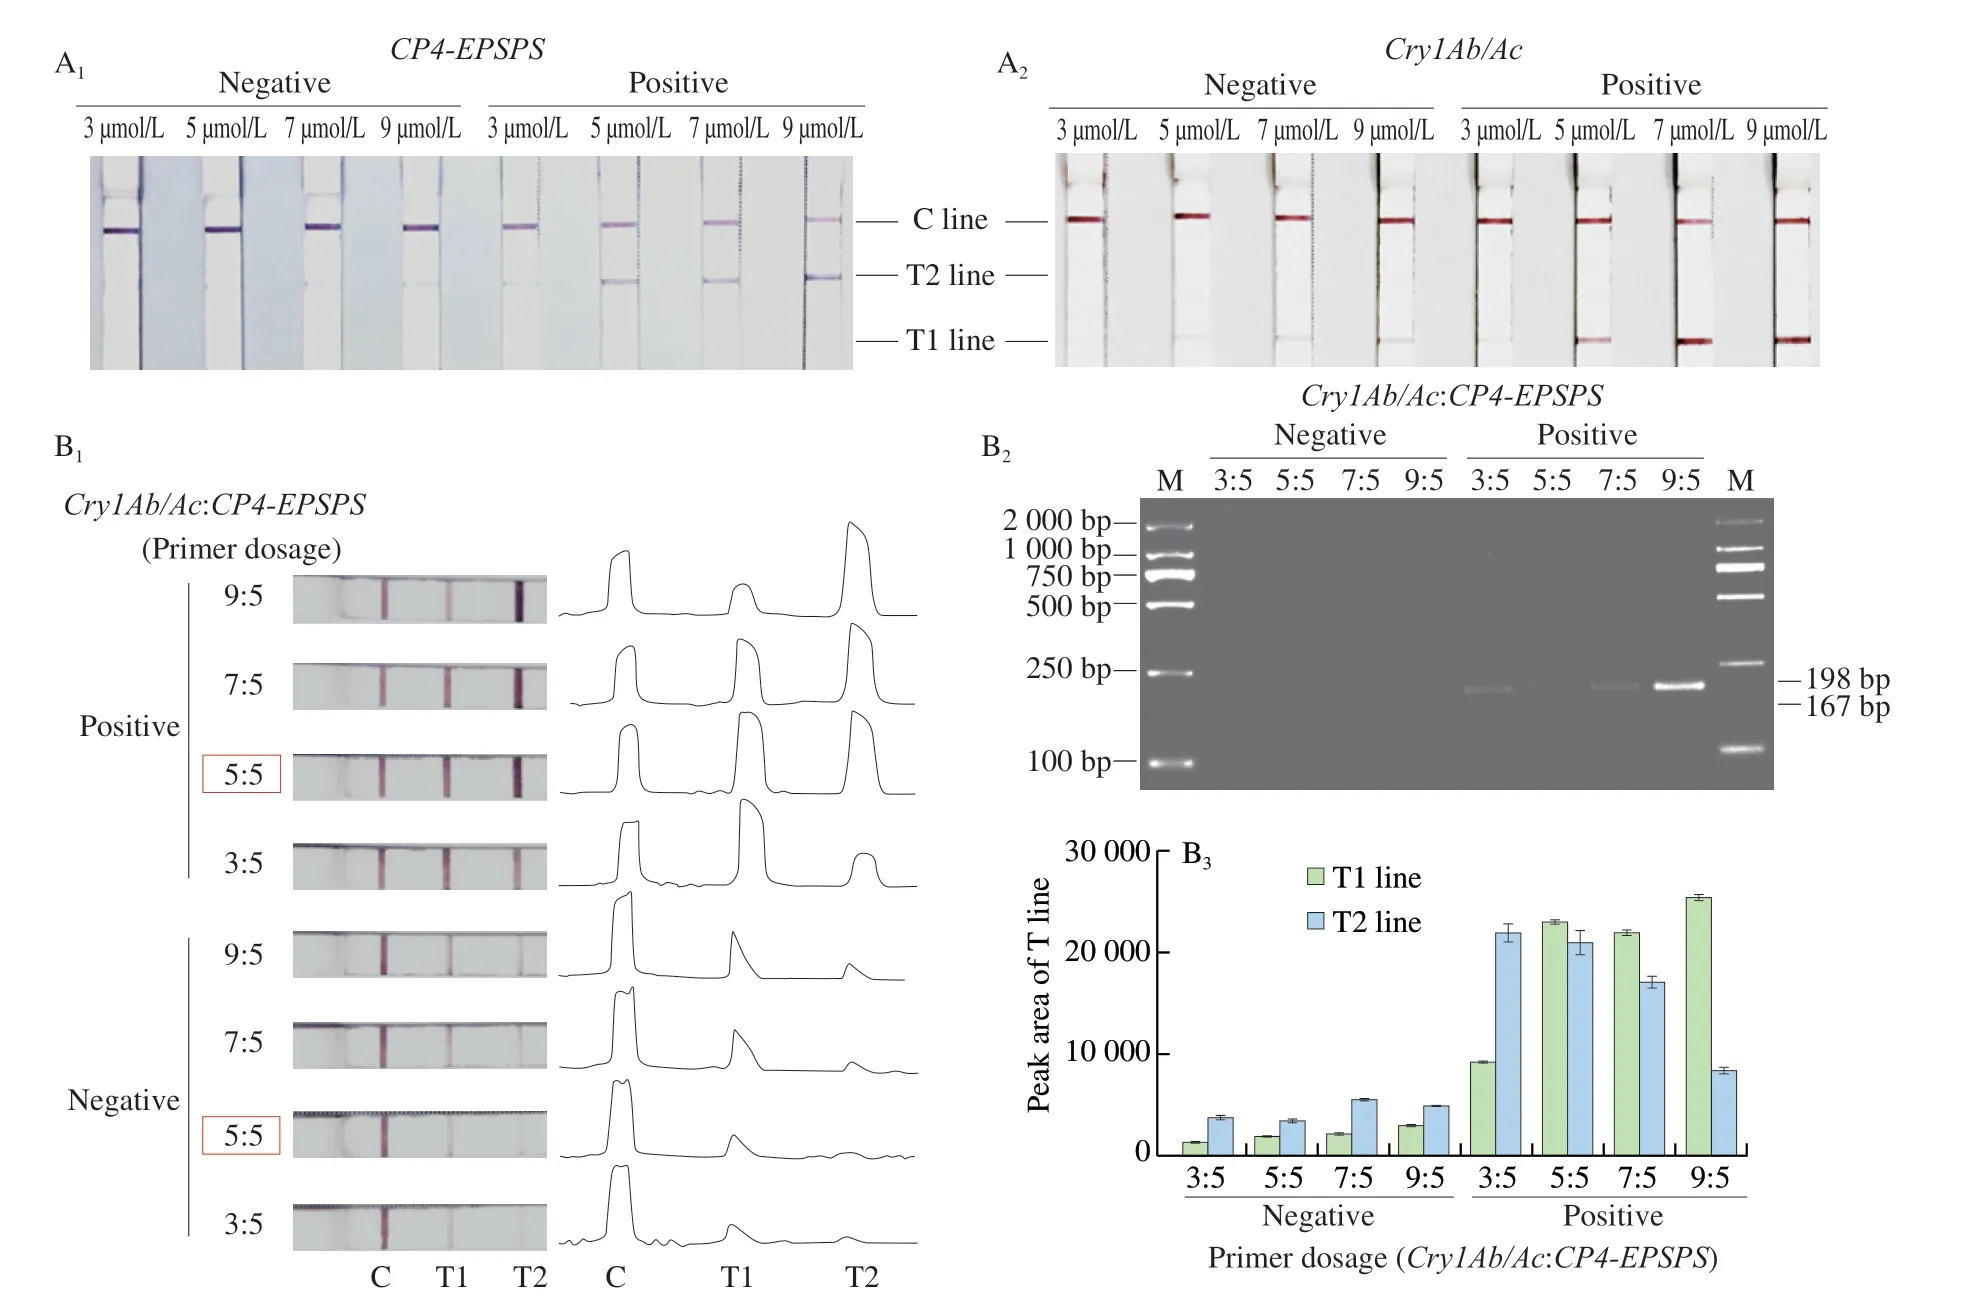
Fig.2 Primer concentration optimization.(A) Optimization results of primer concentration for single-RPA system.(A1) Test strip results corresponding to the optimization of CP4-EPSPS primer concentration.(A2) Test strip results corresponding to the optimization of Cry1Ab/Ac primer concentration.(B) Optimization results of primer concentration for dual-RPA system.(B1) Test strip results for the dual-RPA system and plots of visible bands for each test strip.(B2) Agarose gel electropherogram of primer optimization for dual-RPA system.(B3) T-line peak areas for corresponding strips in (B1).
In dual-RPA system,the coloring bands of these strips and their corresponding peaks (Fig.2B1) demonstrated that as the percentage ofCry1Ab/Acprimers increased,the intensity of the corresponding T1 test line became stronger,while the T2 line was relatively weaker or even became unclear.An increase in theCP4-EPSPSprimer dosage corresponded to an enhancement of the T2 line and a weakening of the T1 line.The trend of the test lines on the strips was consistent with electrophoretic results (Fig.2B2).From a histogram of the peak areas corresponding to the T-lines (Fig.2B3),it was evident when the two pairs of primers were present in the RPA system at a ratio of 5:5,the intensities of the T1 line and T2 line were comparable and visual inspection was satisfactory.In this case,the final concentration of each primer in the system was 240 nmol/L.Therefore,in subsequent experiments,the final concentrations of all primers in the dual-RPA systems were 240 nmol/L.
3.2 Specificity of dual-RPA-LFD
Specificity assessment is an important part of the application of an assay in practice.As presented in Fig.3,a positive control using plasmids containing all detection targets showed three red lines,a C line,a T1 line and a T2 line,indicating double positivity forCry1Ab/AcandCP4-EPSPS.MS1 and RF1 without these two target genes agreed with a blank control without template and showed only the C line.NK603,RRS,sugar beet H7-1,MON88913,and MON89788 withCP4-EPSPSonly displayed two red lines (C line and T2 line).Bt11,KF6,KMD1,MON531,and MON87701 containingCry1Ab/Acbut notCP4-EPSPSshowed two red lines (C line and T1 line).The results were consistent with the current issued standards,thus verifying the specificity of this method (Table S2).
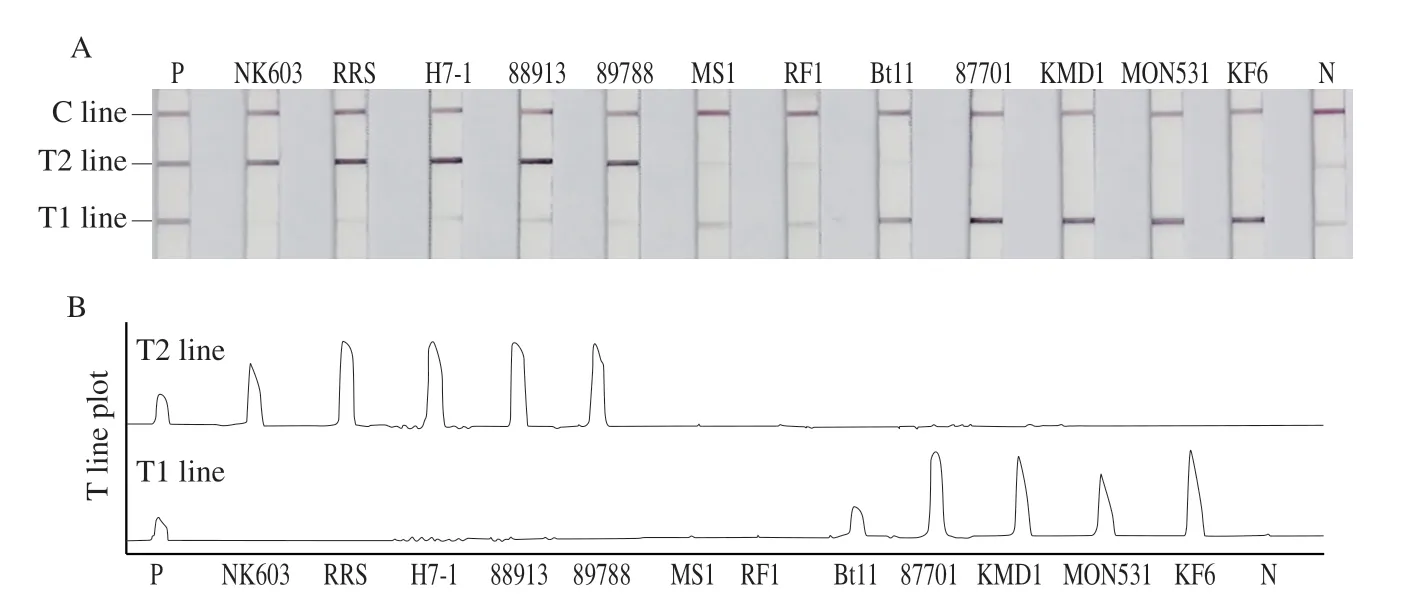
Fig.3 Specificity of dual-RPA-LFD.(A) Test strips of dual-RPA-LFD method for the detection of different transgenic standards.(B) T-line peak plots for corresponding strips in (A).
Meanwhile,the specificity results shown in Fig.3 indicated that our dual-RPA-LFD assay could specifically distinguish between different transgenic crops containingCry1Ab/AcandCP4-EPSPS,and there was no mutual interference between the T1 line and T2 line.
3.3 Molecular sensitivity
For sensitivity testing,as shown in Fig.4A,the colors of the T1 line and T2 line showed an overall weakening trend as the plasmid concentration decreased.For high plasmid concentrations(100−106copies/μL),the test strips showed three red lines,and the T1 line corresponding toCry1Ab/Acand the T2 line corresponding toCP4-EPSPSwere clearly visible.In contrast,the test strips corresponding to low concentrations (1−10 copies/μL) or a blank control (N) without template had only one clear band at the C line.The visual inspection limits of this strategy were 100 copies/μL forCry1Ab/AcandCP4-EPSPS.The corresponding peak pattern of the test lines in Fig.4B confirmed the trend of our visual assessment.The results indicated that assays with 10 and 1 copies/μL were not significantly different from our blank control (N) (P>0.05),while the peak areas of the T1 line and the T2 line for 100 copies/μL of plasmids were highly significantly different from the blank control(P<0.000 1 for T1 andP<0.01 for T2) (Fig.4C).

Fig.4 Molecular sensitivity of dual-RPA-LFD.****,P <0.000 1;**, P <0.01;ns,P >0.05.(A) Test strips for plasmids at different concentrations.(B) T-line peak plots of corresponding strips.(C) T-line peak areas of corresponding strips.(C1) Peak areas of T1 lines.(C2) Peak areas of T2 lines.
3.4 Complex sample detection
The gene composition of the detection target can be analyzed by referring to Table S2.The RPA reaction used to amplify the assay signal was successfully conducted,as shown in Fig.5A.In Fig.5B,the test strips showed the same three red lines as the positive control when two transgenic samples containingCry1Ab/AcandCP4-EPSPSwere added.Moreover,when adding two samples containing onlyCry1Ab/Ac,only the C line and T1 line were visible,whereas when the template consisted of two samples containing onlyCP4-EPSPS,only the C line and T2 line were visible.All negative/positive results consisted with the ingredients tested using current issued standards,indicating that our method is applicable to the complex samples that may occur in a market environment.
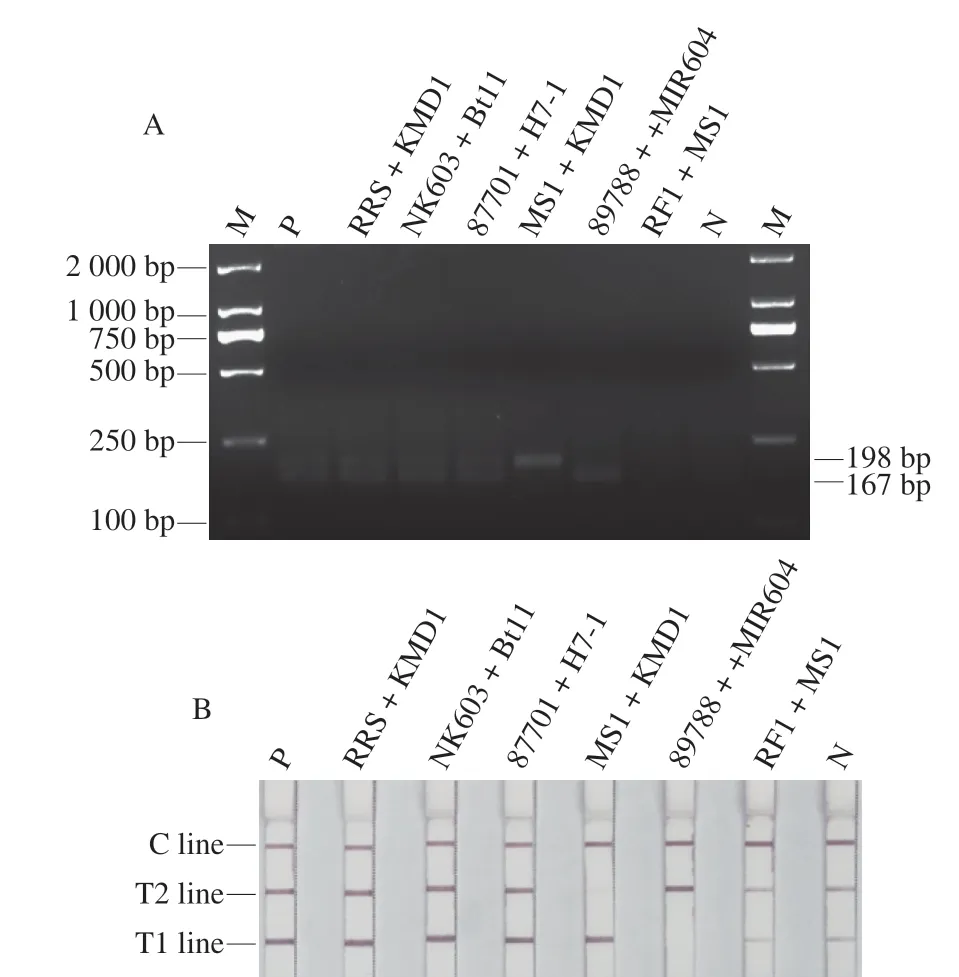
Fig.5 Analyzing complex samples with dual-RPA-LFD.M: DL2000 Marker;P: Cry1Ab/Ac plasmid and CP4-EPSPS plasmid;N: Blank control without template.(A) Agarose gel electropherograms of randomly mixed complex samples subjected to dual-RPA reactions.(B) Test strips from randomly mixed complex samples tested using the dual-RPA-LFD method.
3.5 Application to actual samples
Five actual samples were then tested using immunological rapid test cards based onCry1Ab/AcandCP4-EPSPSproteins,and all results were negative (Fig.S1B).The same samples were employed using our dual-LFD-RPA strategy,and all actual samples showed only one C line on the test strips used,meaning all were negative(Fig.S1A).The presence of corresponding bands in the positive control indicated a valid test result.The results proved that this method is very suitable for detectingCP4-EPSPSandCry1Ab/Acin conventional GM crops,both in the laboratory and in the field setting.
4. Discussion
An unavoidable and common problem in visualizing nucleic acid amplification products by primer labeling is the susceptibility to primer dimers and non-specific amplification products.Therefore,extensive screening was performed after the design of the RPA primers.As shown in Fig.S2,there was only one obvious target band in the lanes corresponding to the different positive standards,indicating that the designed RPA primers obtained from screening had good specificity,and non-specific amplification did not occur.Moreover,the number of primers was optimized in order to avoid the generation of a large number of primer dimers caused by primer overload.However,the generation of primer dimers seemed to be unavoidable for the complex system of two primer pairs (Fig.2B2).Faint bands appearing in the T1 and T2 lines of negative samples and the blank controls in the images of the strips were due to trace amounts of primer dimer.Therefore,a blank control was indispensable in this method.In subsequent studies,the test lines of positive and negative samples were distinguishable,and dual-RPALFD showed good detection performance.
Transgenic detection technology is an important safeguard for China’s agricultural biosafety[23].Many protein-and nucleic acidbased assays have been developed and gradually applied to transgenic crops.To fully evaluate the program constructed in this study,common transgenic assays and their detection capabilities were listed in Table 1.By comparison,overall,conventional nucleic acid-based assays[24]tend to be more sensitive than protein-based methods[25-28].Nucleic acid amplification is the core of most nucleic acid-based methods.However,conventional PCR takes a long time,making the detection efficiency greatly reduced,and the harsh reaction conditions make it impossible to be performed in a complex environment away from the experimental equipment required for PCR.
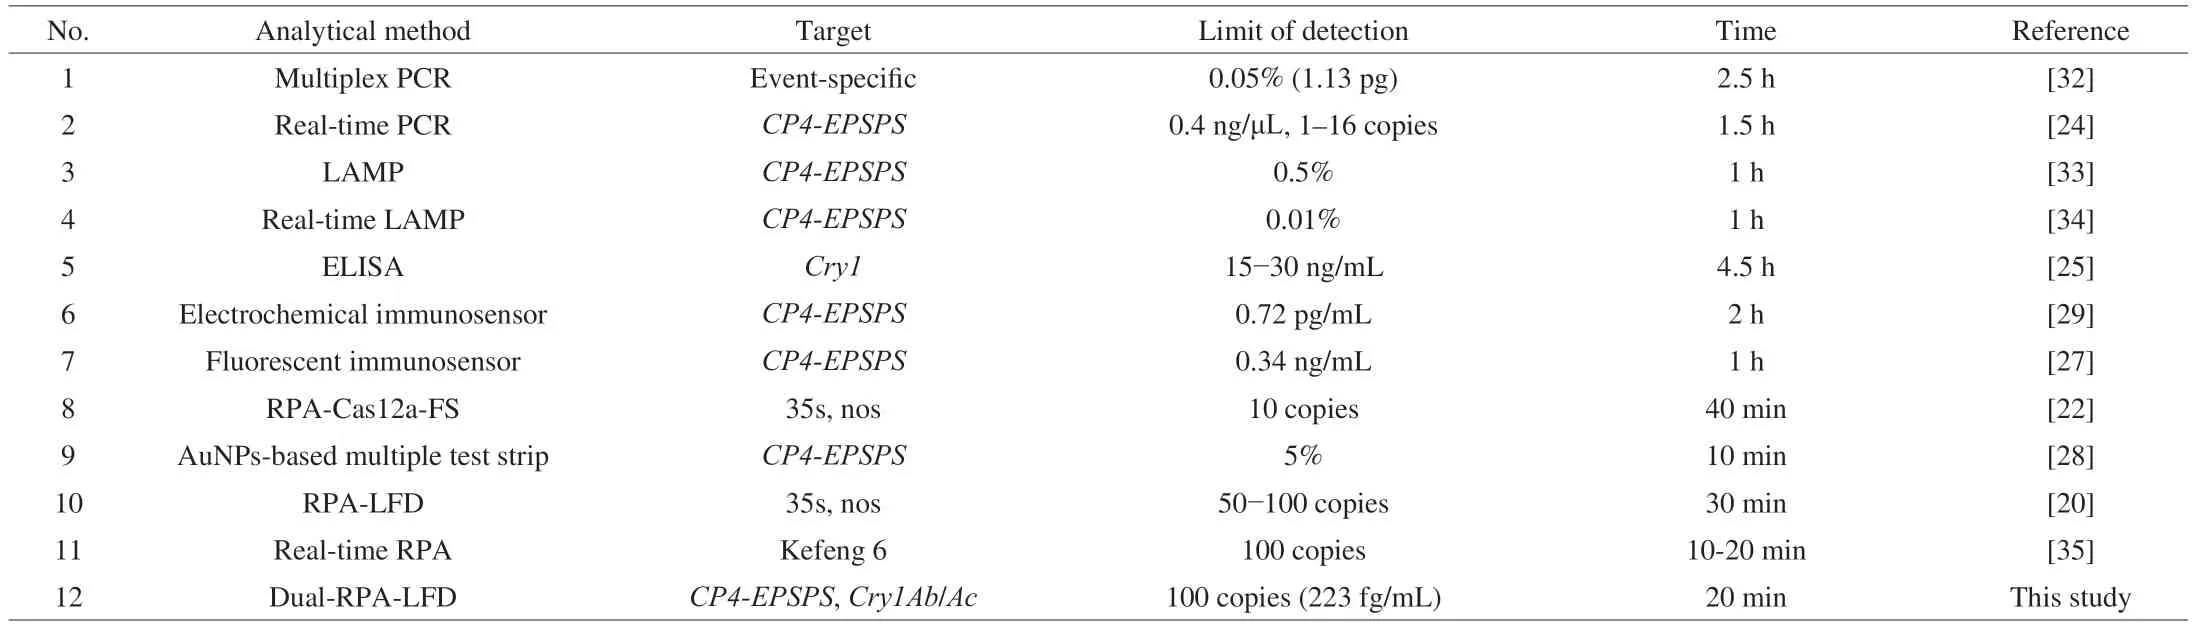
Table 1 Performance comparison of different transgenic detection methods.
The continuous advancement of biotechnology,for instance,the development of isothermal amplification,has ushered in a new era in the field of GM crops detection.In a previous study,a RPA-LFD strategy was developed and enabled visual detection of GM crops[20].However,different elements were carried out one by one,making the operation of this method cumbersome and unsuitable for largescale screening.Based on this,a new system (dual-RPA-LFD),which allowed the visualization of different genes simultaneously,was developed in this study,further reducing the cost and improving the detection efficiency of GM crops monitoring.CP4-EPSPSandCry1Ab/Acwere currently widely used in stacked traits and were selected as detection targets.The simultaneous detection ofCP4-EPSPSandCry1Ab/Acnot only enabled transgene characterization,but also facilitated the next step of identifying specific transgenic events.
The proposed Dual-RPA-LFD strategy showed an order of magnitude higher sensitivity than protein-based immunochromatographic test strips[28],due to the additional RPA signal amplification effect.Also,the analysis time was greatly reduced compared to conventional PCR,allowing for rapid detection.In comparison with novel electrochemical[29]and fluorescent immunosensors[27],our dual-RPA-LFD method required fewer operational steps and offered better portability and time cost.Although the RPA-Cas12a-FS strategy exhibited higher sensitivity than dual-RPA-LFD[22],it does not currently allow for multiplex detection and requires special fluorescence detection instruments to observe results.
In addition,a ultra-sensitive Cas12a-based test strip method is under development,but it has not yet been applied to transgenic assays[30].However,Cas12a-based method adds a Cas12a digestion step that takes 45 min to complete,which greatly increases the time consumption,testing cost,and risk of product contamination.At present,Cas12a test strips can only achieve single object detection,and there are still many complex issues waiting for being explored with regards to whether multiple detection can be achieved in the future.In addition,mini-disk capillary array is a promising direction for test strips in the future,and some related methods have been reported[31],but its stability,industrialization form and cost effectiveness are problems to be solved.While,compared to these methods,the dual-RPA-LFD system for multiple detection is easy to design and implement,and has better time and cost efficiency,making it broadly applicable.
5. Conclusions
In summary,targetingCry1Ab/AcandCP4-EPSPS,a dual-RPA system that can be used for GM crops detection,RPA-LFD,was successfully constructed.This strategy enabled simultaneous visual detection of two 100-copy targets with good specificity,sensitivity,and applicability to complex GM crop samples.In subsequent studies,the identification of specific transgenic events in field testing could be achieved by including additional transgenic screening elements in the detection system or by developing special slots that can accommodate multiple test strips.
Conflicts of interest
The authors declared that they have no conflicts of interest to this work.
Acknowledgments
This study was supported by the Scientific and Innovative Action Plan of Shanghai (21N31900800);Shanghai Rising-Star Program(23QB1403500);the Shanghai Sailing Program (20YF1443000);Shanghai Science and Technology Commission,the Belt and Road Project (20310750500);Talent Project of SAAS (2023-2025);Runup Plan of SAAS (ZP22211);and the SAAS Program for Excellent Research Team (2022 (B-16)).We thank LetPub (www.letpub.com)for its linguistic assistance during the preparation of this manuscript.
Appendix A.Supplementary data
Supplementary data associated with this article can be found,in the online version,at http://doi.org/10.26599/FSHW.2022.9250015.

- 食品科学与人类健康(英文)的其它文章
- GUIDE FOR AUTHORS
- Targeting gut microbiota in osteoporosis: impact of the microbial based functional food ingredients
- Weizmannia coagulans: an ideal probiotic for gut health
- Natural sources,refined extraction,biosynthesis,metabolism,and bioactivities of dietary polymethoxyflavones (PMFs)
- A review of salivary composition changes induced by fasting and its impact on health
- Minerals in edible insects: a review of content and potential for sustainable sourcing