
Determination of uncertainties of geomechanical parameters of metamorphic rocks using petrographic analyses
2024-02-29 14:47BehzdDstjerdyAliSeidiShhriyrHeidrzdeh
Behzd Dstjerdy ,Ali Seidi ,Shhriyr Heidrzdeh
a Department of Applied Sciences,University of Quebec at Chicoutimi,Saguenay,QC,Canada
b SNC-Lavalin,Montreal,Canada
Keywords:Intact rock parameters Natural variabilities Outlier detection methods Uncertainties Westwood mine Mineralogy
ABSTRACT Geomechanical parameters of intact metamorphic rocks determined from laboratory testing remain highly uncertain because of the great intrinsic variability associated with the degrees of metamorphism.The aim of this paper is to develop a proper methodology to analyze the uncertainties of geomechanical characteristics by focusing on three domains,i.e.data treatment process,schistosity angle,and mineralogy.First,the variabilities of the geomechanical laboratory data of Westwood Mine (Quebec,Canada)were examined statistically by applying different data treatment techniques,through which the most suitable outlier methods were selected for each parameter using multiple decision-making criteria and engineering judgment.Results indicated that some methods exhibited better performance in identifying the possible outliers,although several others were unsuccessful because of their limitation in large sample size.The well-known boxplot method might not be the best outlier method for most geomechanical parameters because its calculated confidence range was not acceptable according to engineering judgment.However,several approaches,including adjusted boxplot,2MADe,and 2SD,worked very well in the detection of true outliers.Also,the statistical tests indicate that the best-fitting probability distribution function for geomechanical intact parameters might not be the normal distribution,unlike what is assumed in most geomechanical studies.Moreover,the negative effects of schistosity angle on the uniaxial compressive strength (UCS) variabilities were reduced by excluding the samples within a specific angle range where the UCS data present the highest variation.Finally,a petrographic analysis was conducted to assess the associated uncertainties such that a logical link was found between the dispersion and the variabilities of hard and soft minerals.
1.Introduction
The strength and deformability parameters of rock masses are of great significance when dealing with site characterization in geomechanical projects.One major source of complication in rock mass characterization is the natural variability of intact rocks,which can generate considerable uncertainties in different types of rocks.Therefore,the geomechanical parameters of intact rocks must be carefully characterized because they can affect the analysis of the mechanical behavior of rock mass.In rock mechanics literature,several approaches can quantify the mechanical properties of intact rocks,which mostly rely on laboratory experiments (Cai et al.,2004;Sonmez et al.,2004;Pepe et al.,2017).Considering that the intact rock samples are natural materials,they might show a great deal of inherent variabilities.Thus,the experimental results of intact rocks are scattered inevitably even when the rock samples are prepared well and the testing procedures are followed accurately (Pepe et al.,2017).In fact,these dispersed results should be assumed as raw data,which must be treated accurately to reduce the existing uncertainties in geomechanical analysis(Agliardi et al.,2016;Chen et al.,2021;Pereira et al.,2021).From the statistical perspective,these extreme abnormal values are called outliers,which considerably diverge from the mainstream of the other values(Barbato et al.,2011;Kannan et al.,2015;Saleem et al.,2021).
Therefore,a key step to studying the uncertainties of geomechanical data is to focus on the treatment of very extreme values in a dataset,and prior to the determination of the intact rock parameters,a suitable data treatment process for the laboratory results must be taken to reduce the uncertainties of geomechanical parameters.In underground rock mechanics,several statistical techniques were applied to treat the geomechanical laboratory data and even field data.With regard to the geomechanical field test,several researchers have treated the estimated values of uniaxial compressive strength (UCS) and Young’s modulus via the Schmidt hammer test using a statistical approach known as Chauvenet’s criterion,which is a treatment method based on mean and standard deviation(Goktan and Ayday,1993;Goktan and Gunes,2005;Bolla and Paronuzzi,2021).Moreover,a very useful statistical technique called as Grubbs’ test was applied by some scholars to treat data in various geomechanical investigations,ranging from determining the shear strength parameters of rocks and the uncertainties related to the statistical analysis of surface settlement in shallow tunnels(Dindarloo and Siami-Irdemoosa,2015;Shao et al.,2019).Chen et al.(2021) also suggested an outlier detection algorithm based on theZ-score method to screen the rock mechanics parameters,such as Young’s modulus and Poisson’s ratio (Chen et al.,2021).However,the boxplot method,in which some important studies focusing on the treatment of laboratory intact data are mentioned herein,has been the most common outlier method used in geomechanical studies (Tiryaki,2008;Hassanpour et al.,2010;Manouchehrian et al.,2012;Carter,2021;Heidarzadeh et al.,2021).In addition,this method was used to treat the rockburst index data to predict rockburst occurrences (Zhou et al.,2016;Liang et al.,2020;Xue et al.,2020;Li et al.,2022);however,the boxplot method may not be the most suitable approach for greatly skewed data(Walker et al.,2018).Therefore,the fundamental methodology for applying a data treatment technique remains unclear,and although the application of an inappropriate outlier method can mislead the analysis of intact rock uncertainties,so far,no research has focused on providing a procedure to select the most appropriate treatment technique for geomechanical studies.In fact,the applied method should assure that the identified outliers are physically justifiable.As a result,a reasonable data treatment process should be considered to have a reliable and confident engineering judgment on the evaluation of the uncertainties of the tested rock specimens.
Furthermore,the huge impact of geomechanical intact parameters on the occurrence of rockburst should not be neglected because the research in rockburst detection heavily relies on quantifying the uncertainties of geomechanical intact characteristics;moreover,rockburst,as an abrupt and violent rock failure,is closely tied to intact rock parameters(Sainsbury,2020).As a result,the accompanying uncertainties must be investigated thoroughly to minimize them reasonably so that the researchers can examine the rockburst events more confidently by having well-defined geomechanical parameters.
This paper investigates the significant uncertainties of geomechanical intact parameters by developing an appropriate methodology based on statistical and mineralogical analyses.In this methodology,the uncertainties are completely analyzed in three different parts.In the first part,the effects of various data treatment techniques on the characterization of geomechanical parameters are analyzed comprehensively,and the best outlier detection method for each intact parameter is determined statistically.Then,the significant impact of schistosity angle on the related uncertainties of rock strength is fully explored in the second part.Lastly,a petrographic study is carried out to establish a meaningful link between the uncertainties of minerals and intact rock parameters.
2.Methodology
The methodology used in this study aims to comprehensively investigate the uncertainties associated with geomechanical parameters of intact rock through an integrated framework of statistical data treatment techniques,analysis of schistosity effects,and thorough examination of mineralogy.The methodology consists of five main steps(Fig.1),designed to progressively minimize uncertainties and establish meaningful links between the influential factors.
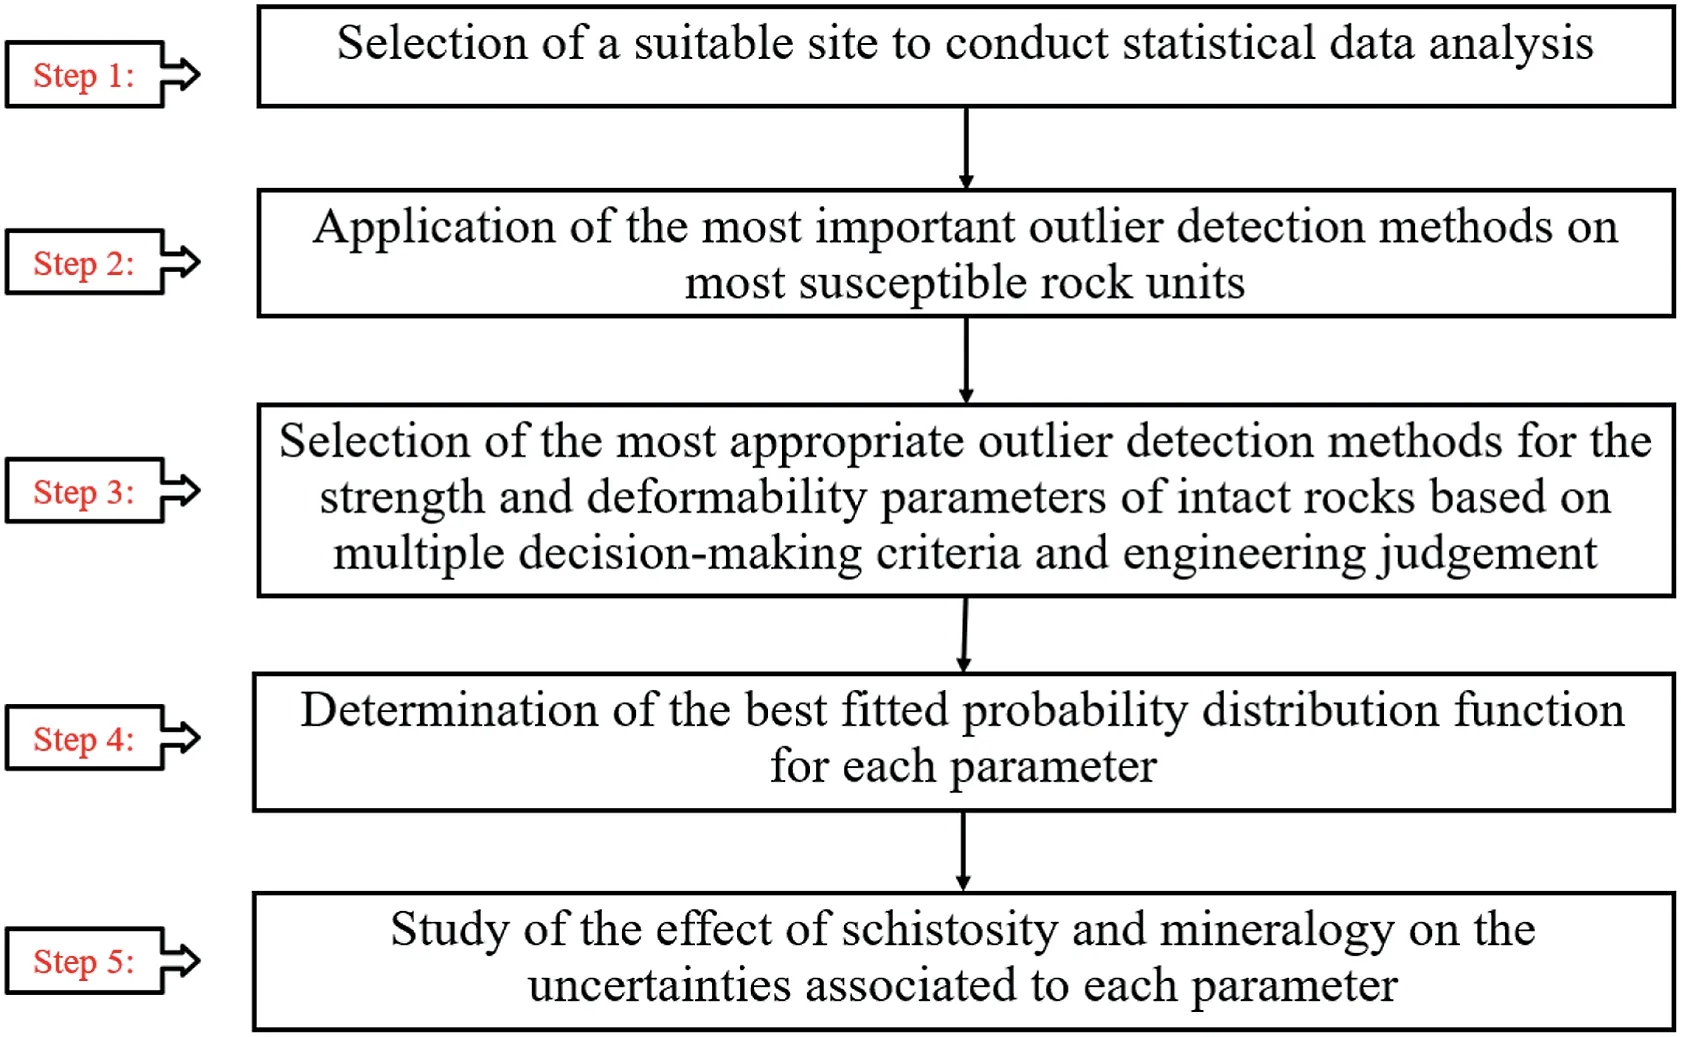
Fig.1.Methodology for determining uncertainties associated with the geomechanical parameters of intact rock.
The first step concerns the selection of an appropriate mining site.This suggested methodology can be properly implemented to study the uncertainties of geomechanical intact parameters.For this purpose,Westwood underground mine,which is recognized as a rockburst-prone mine in Canada located in a regionally metamorphosed area,has been selected to conduct a statistical analysis in the variability of geomechanical parameters of intact rocks(Kalenchuk et al.,2017;Bouzeran et al.,2019;Tremblay,2020).Moreover,given that the load-bearing capacity of intact rock is considered a major source of rockbursts,the characterization of the geomechanical intact parameters and their uncertainties is necessary and will be carried out in Step 2 through a comprehensive statistical analysis based on the data treatment techniques.In fact,to analyze uncertainties,17 statistical data treatment methods are applied on every geomechanical parameter dataset in rockburstprone rock units to identify possible outliers.By using the multiple decision-making criteria and the engineering judgement in Step 3,we have selected the most realistic methods to investigate the related uncertainties of geomechanical parameters of metamorphic rocks.Moving to Step 4,the best fitted probability distribution function is assigned to the treated dataset of the geomechanical parameters by applying goodness-of-fit tests.In contrast to the normality assumption used in many studies,our analysis recognizes that the most precise probability distribution function (PDF)for the geomechanical parameters of intact rocks may not be the normal distribution,which will be fully analyzed in this paper.While the statistical data treatment techniques help reducing uncertainties,the remnants could be significantly influenced by the schistosity angle,which is the focus of Step 5.By analyzing the impact of schistosity angle on rock strength uncertainties,we identify a specific range of schistosity values within which the UCS exhibits the highest variations.By excluding the UCS values within this range,we could substantially mitigate the UCS uncertainty.Moreover,the analysis of mineralogy in Step 5 reveals a logical connection between the dispersion of hard and soft minerals and the variabilities of intact geomechanical parameters.By examining the mineral composition and its variation percentage,we aim to establish a meaningful link between the geomechanical parameter variations and the percentage distribution of different minerals.By meticulously integrating these three parts within the methodology,starting from statistical data treatment techniques,followed by the investigation of schistosity effects,and concluding with the examination of mineralogy,we strive to minimize the associated uncertainties of geomechanical intact parameters in a comprehensive manner.In overall,this integrated approach ensures that the uncertainties of geomechanical parameters are thoroughly analyzed,providing valuable insights into the variability and characteristics of metamorphic rocks.
3.Westwood Mine
Westwood Mine,which is situated in Abitibi greenstone belt,is one of the latest major deposit discoveries in Canada (Fig.2).This gold mine,which commercially begun its production in 2014,is located approximately 420 km northwest of Montreal in the province of Quebec (IAMGOLD,2019;Tremblay,2020).The rock mass at the Westwood Mine is completely affected by regional metamorphism,which has impacted all lithological units changing from greenschist facies to the lower amphibolite facies.Also,Yergeau (2015) recently developed a lithological classification system based on the mineral compositions and volcanic facies,in which six principal rock units (Units 1-6) exist at the Westwood Mine,which are mainly in the east-west direction with steep to moderate dips toward the south(Yergeau,2015).In the Westwood Mine,three lithological units(e.g.Units 3,4,and 5)are recognized as the most susceptible units to rockburst,in which the characterization of geomechanical intact parameters and the associated uncertainties would contribute to the probabilistic analysis of rockburst at this rockburst-prone mine (Tremblay,2020).
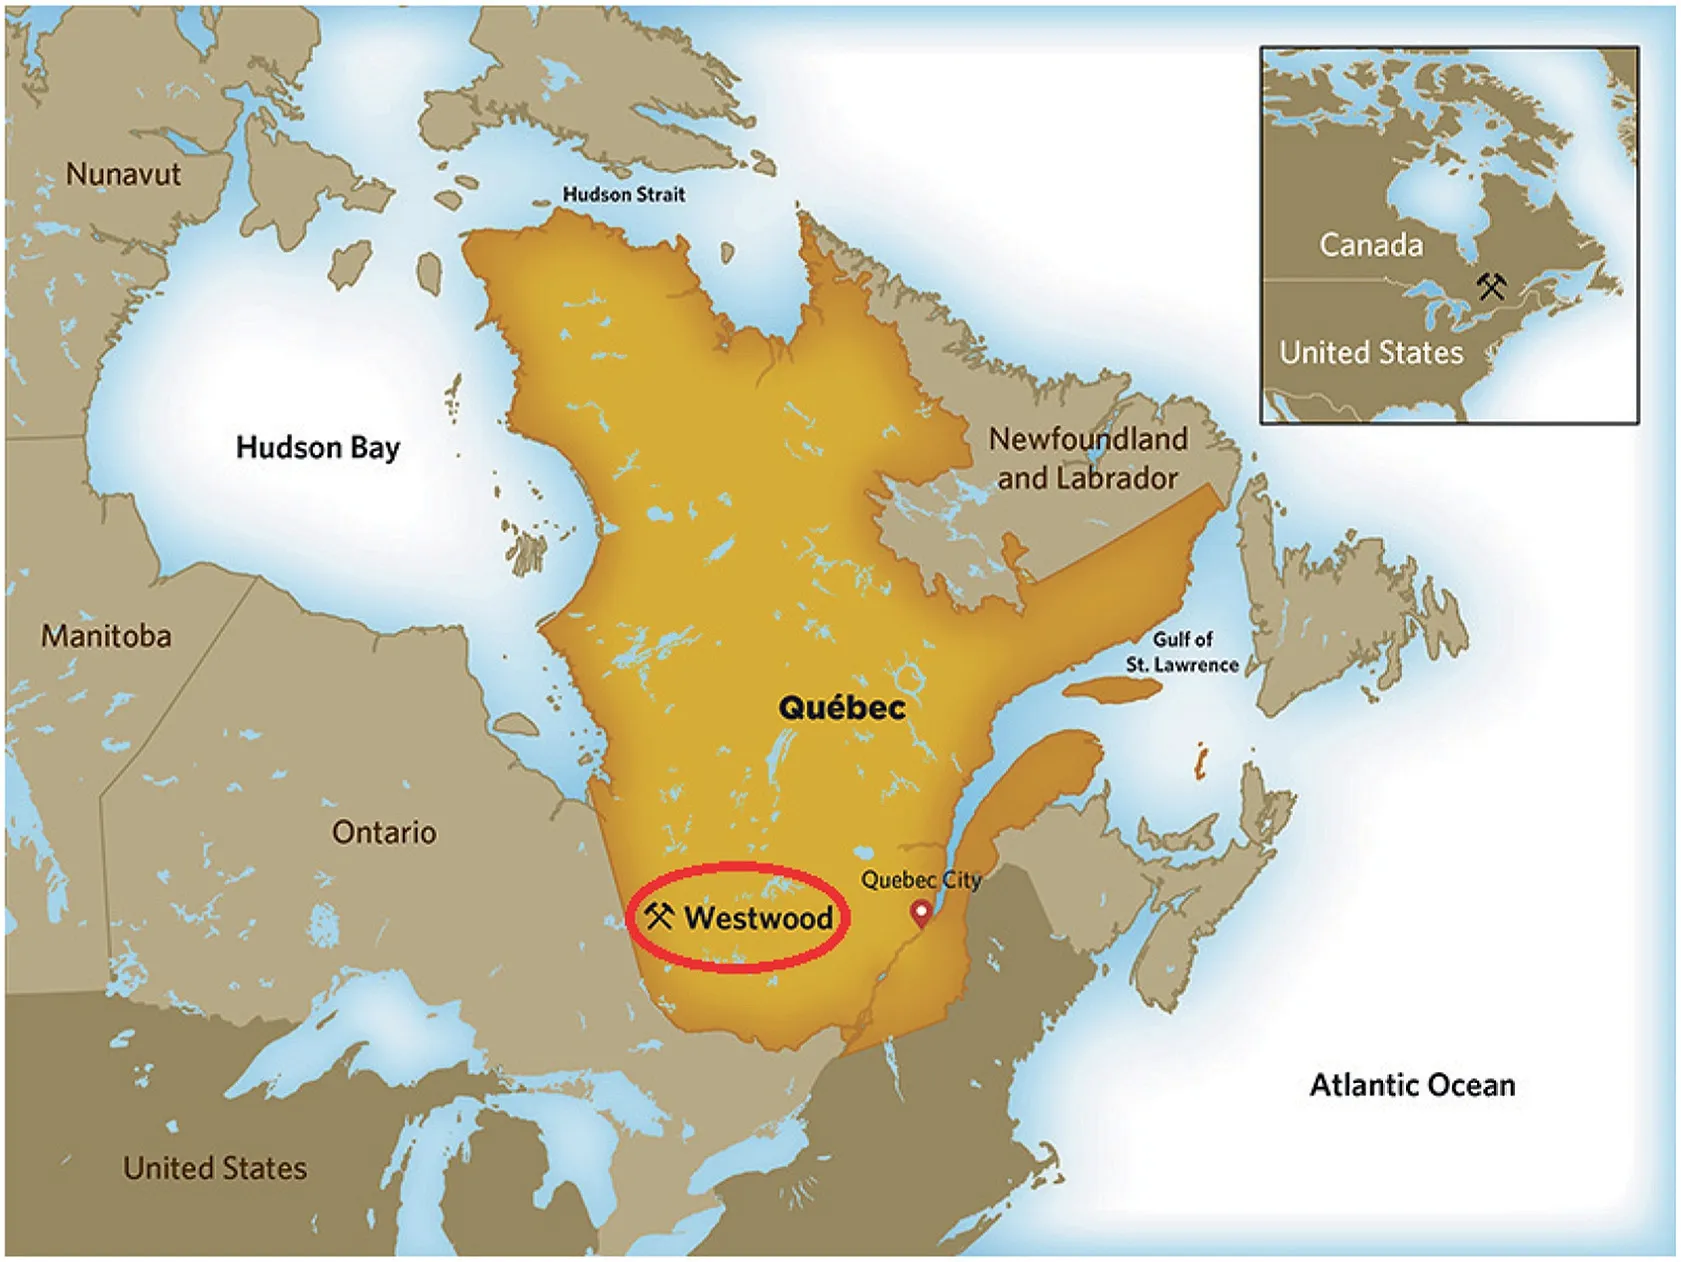
Fig.2.Westwood Mine location in Quebec Province,Canada (IAMGOLD,2019).
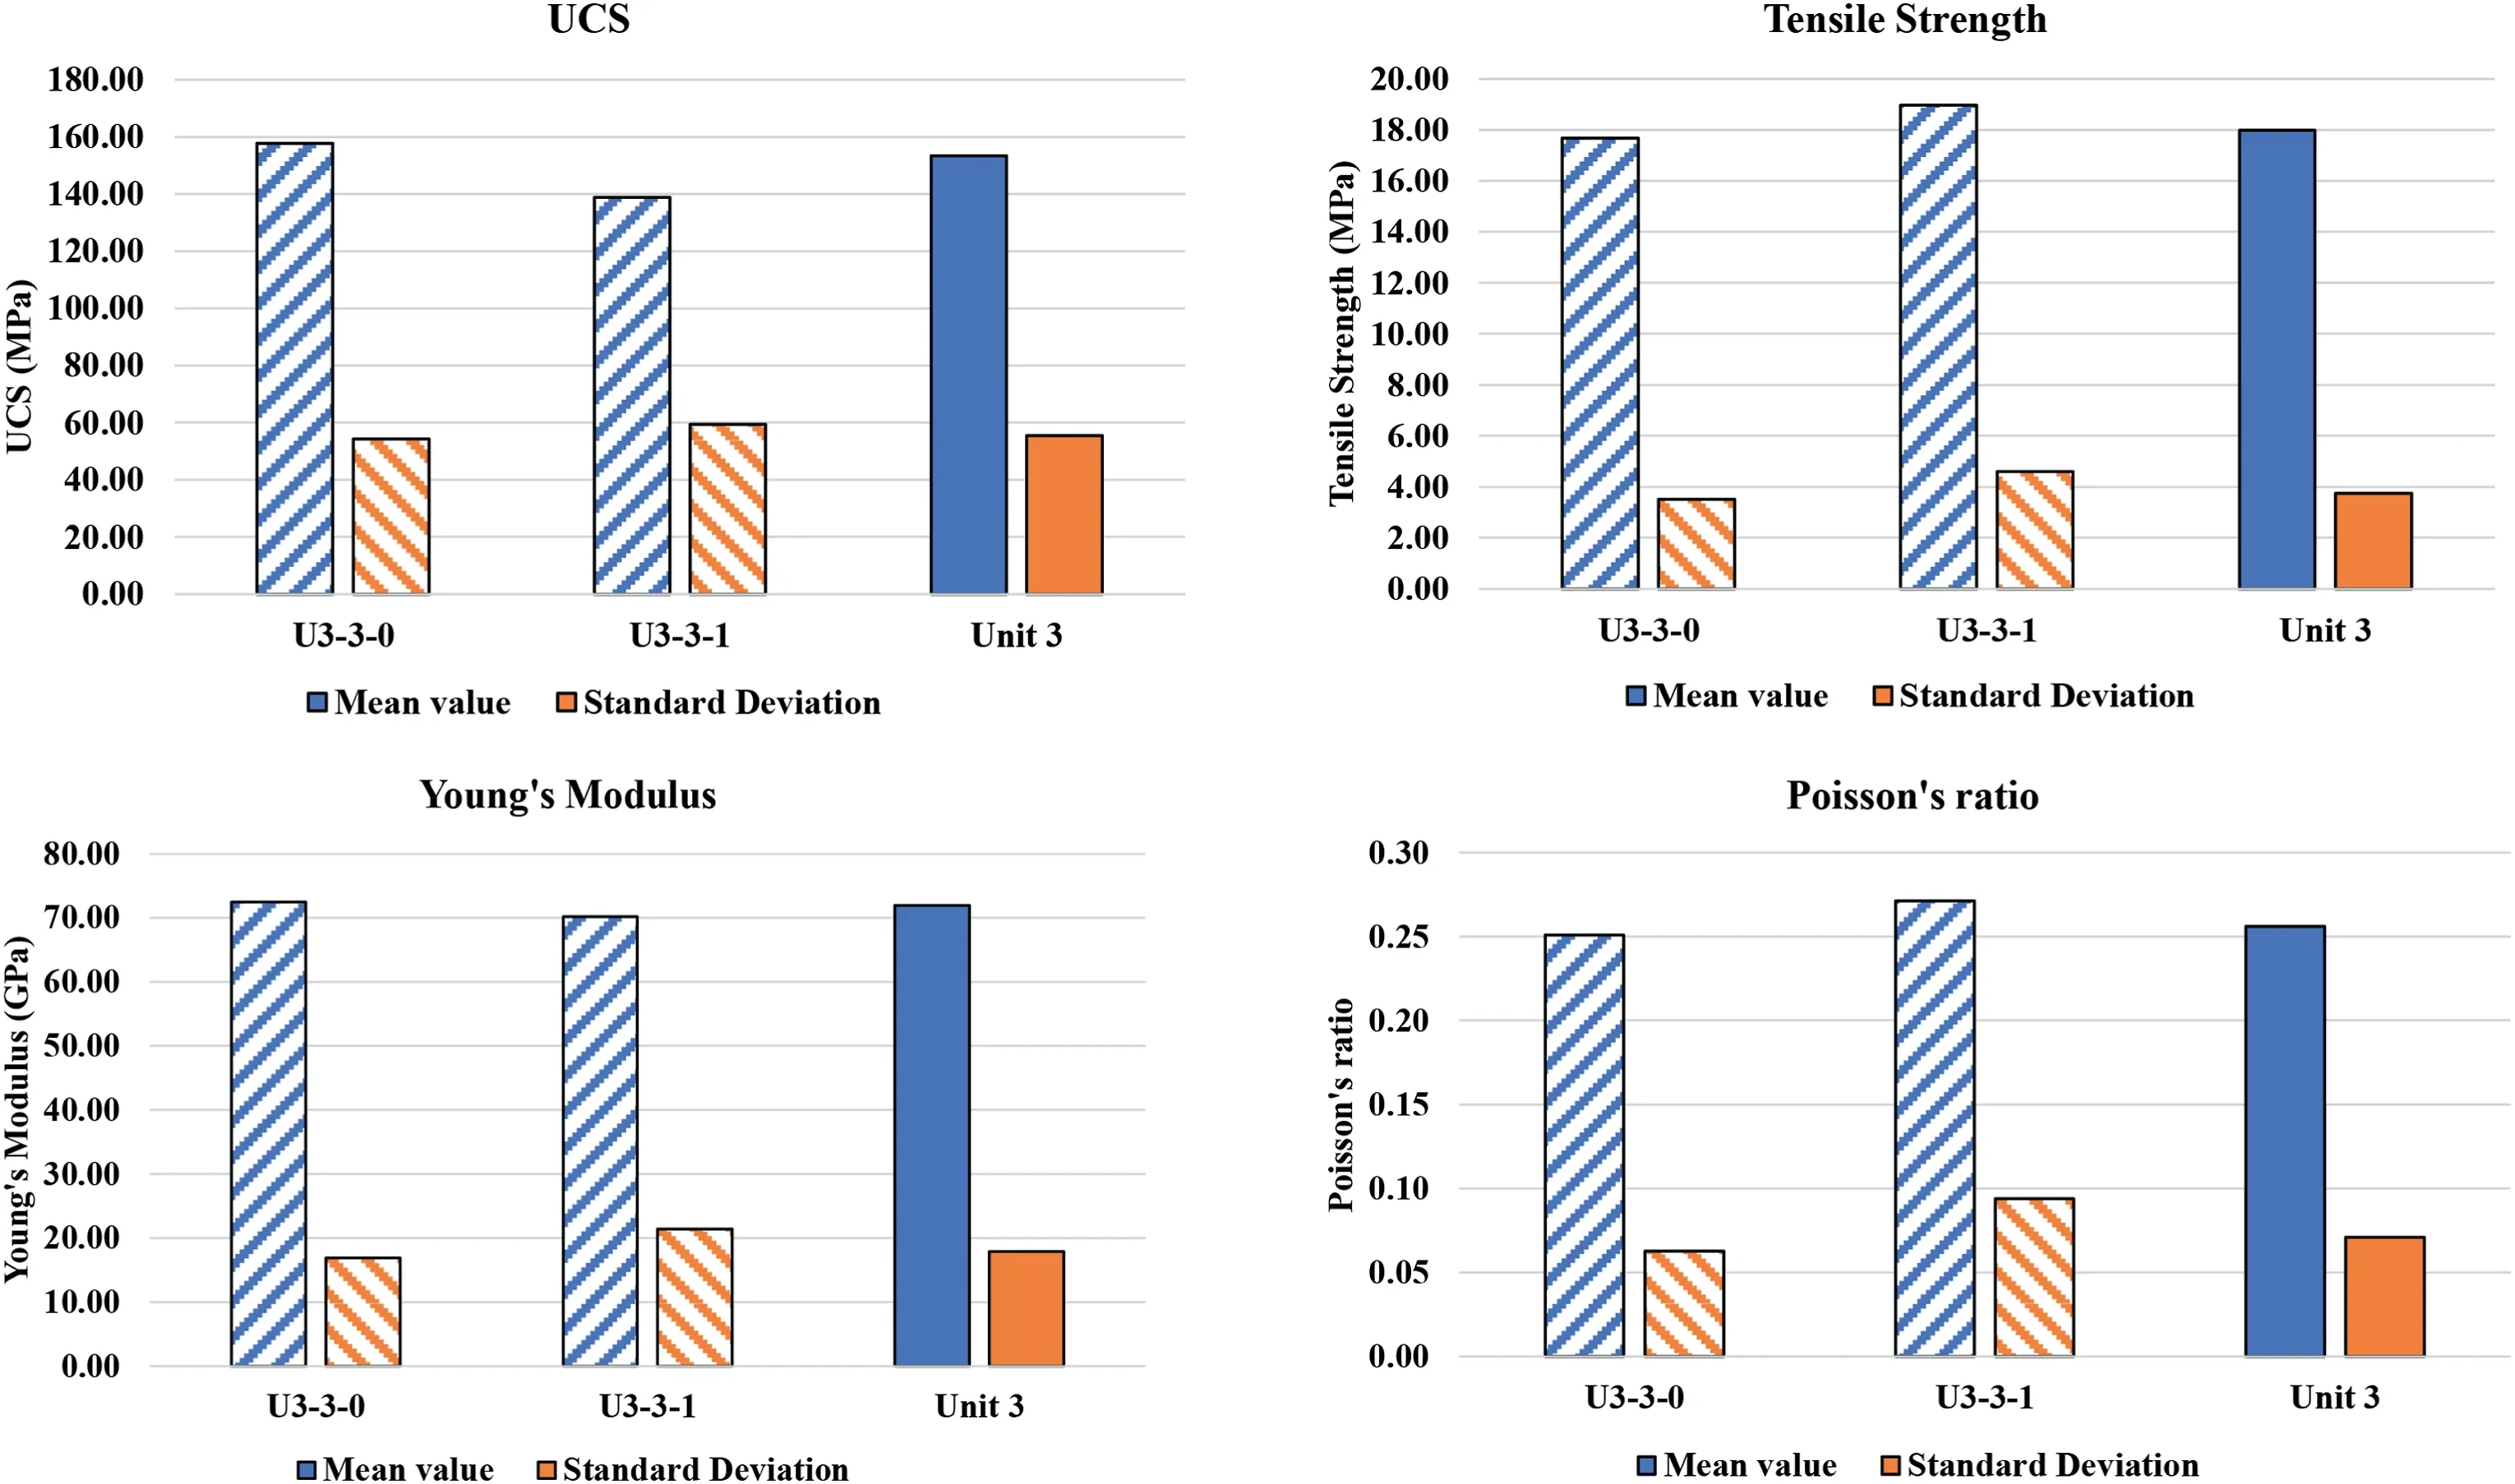
Fig.3.Comparison of mean and standard deviation values of the geomechanical intact parameters for Unit 3 and its sub-units.
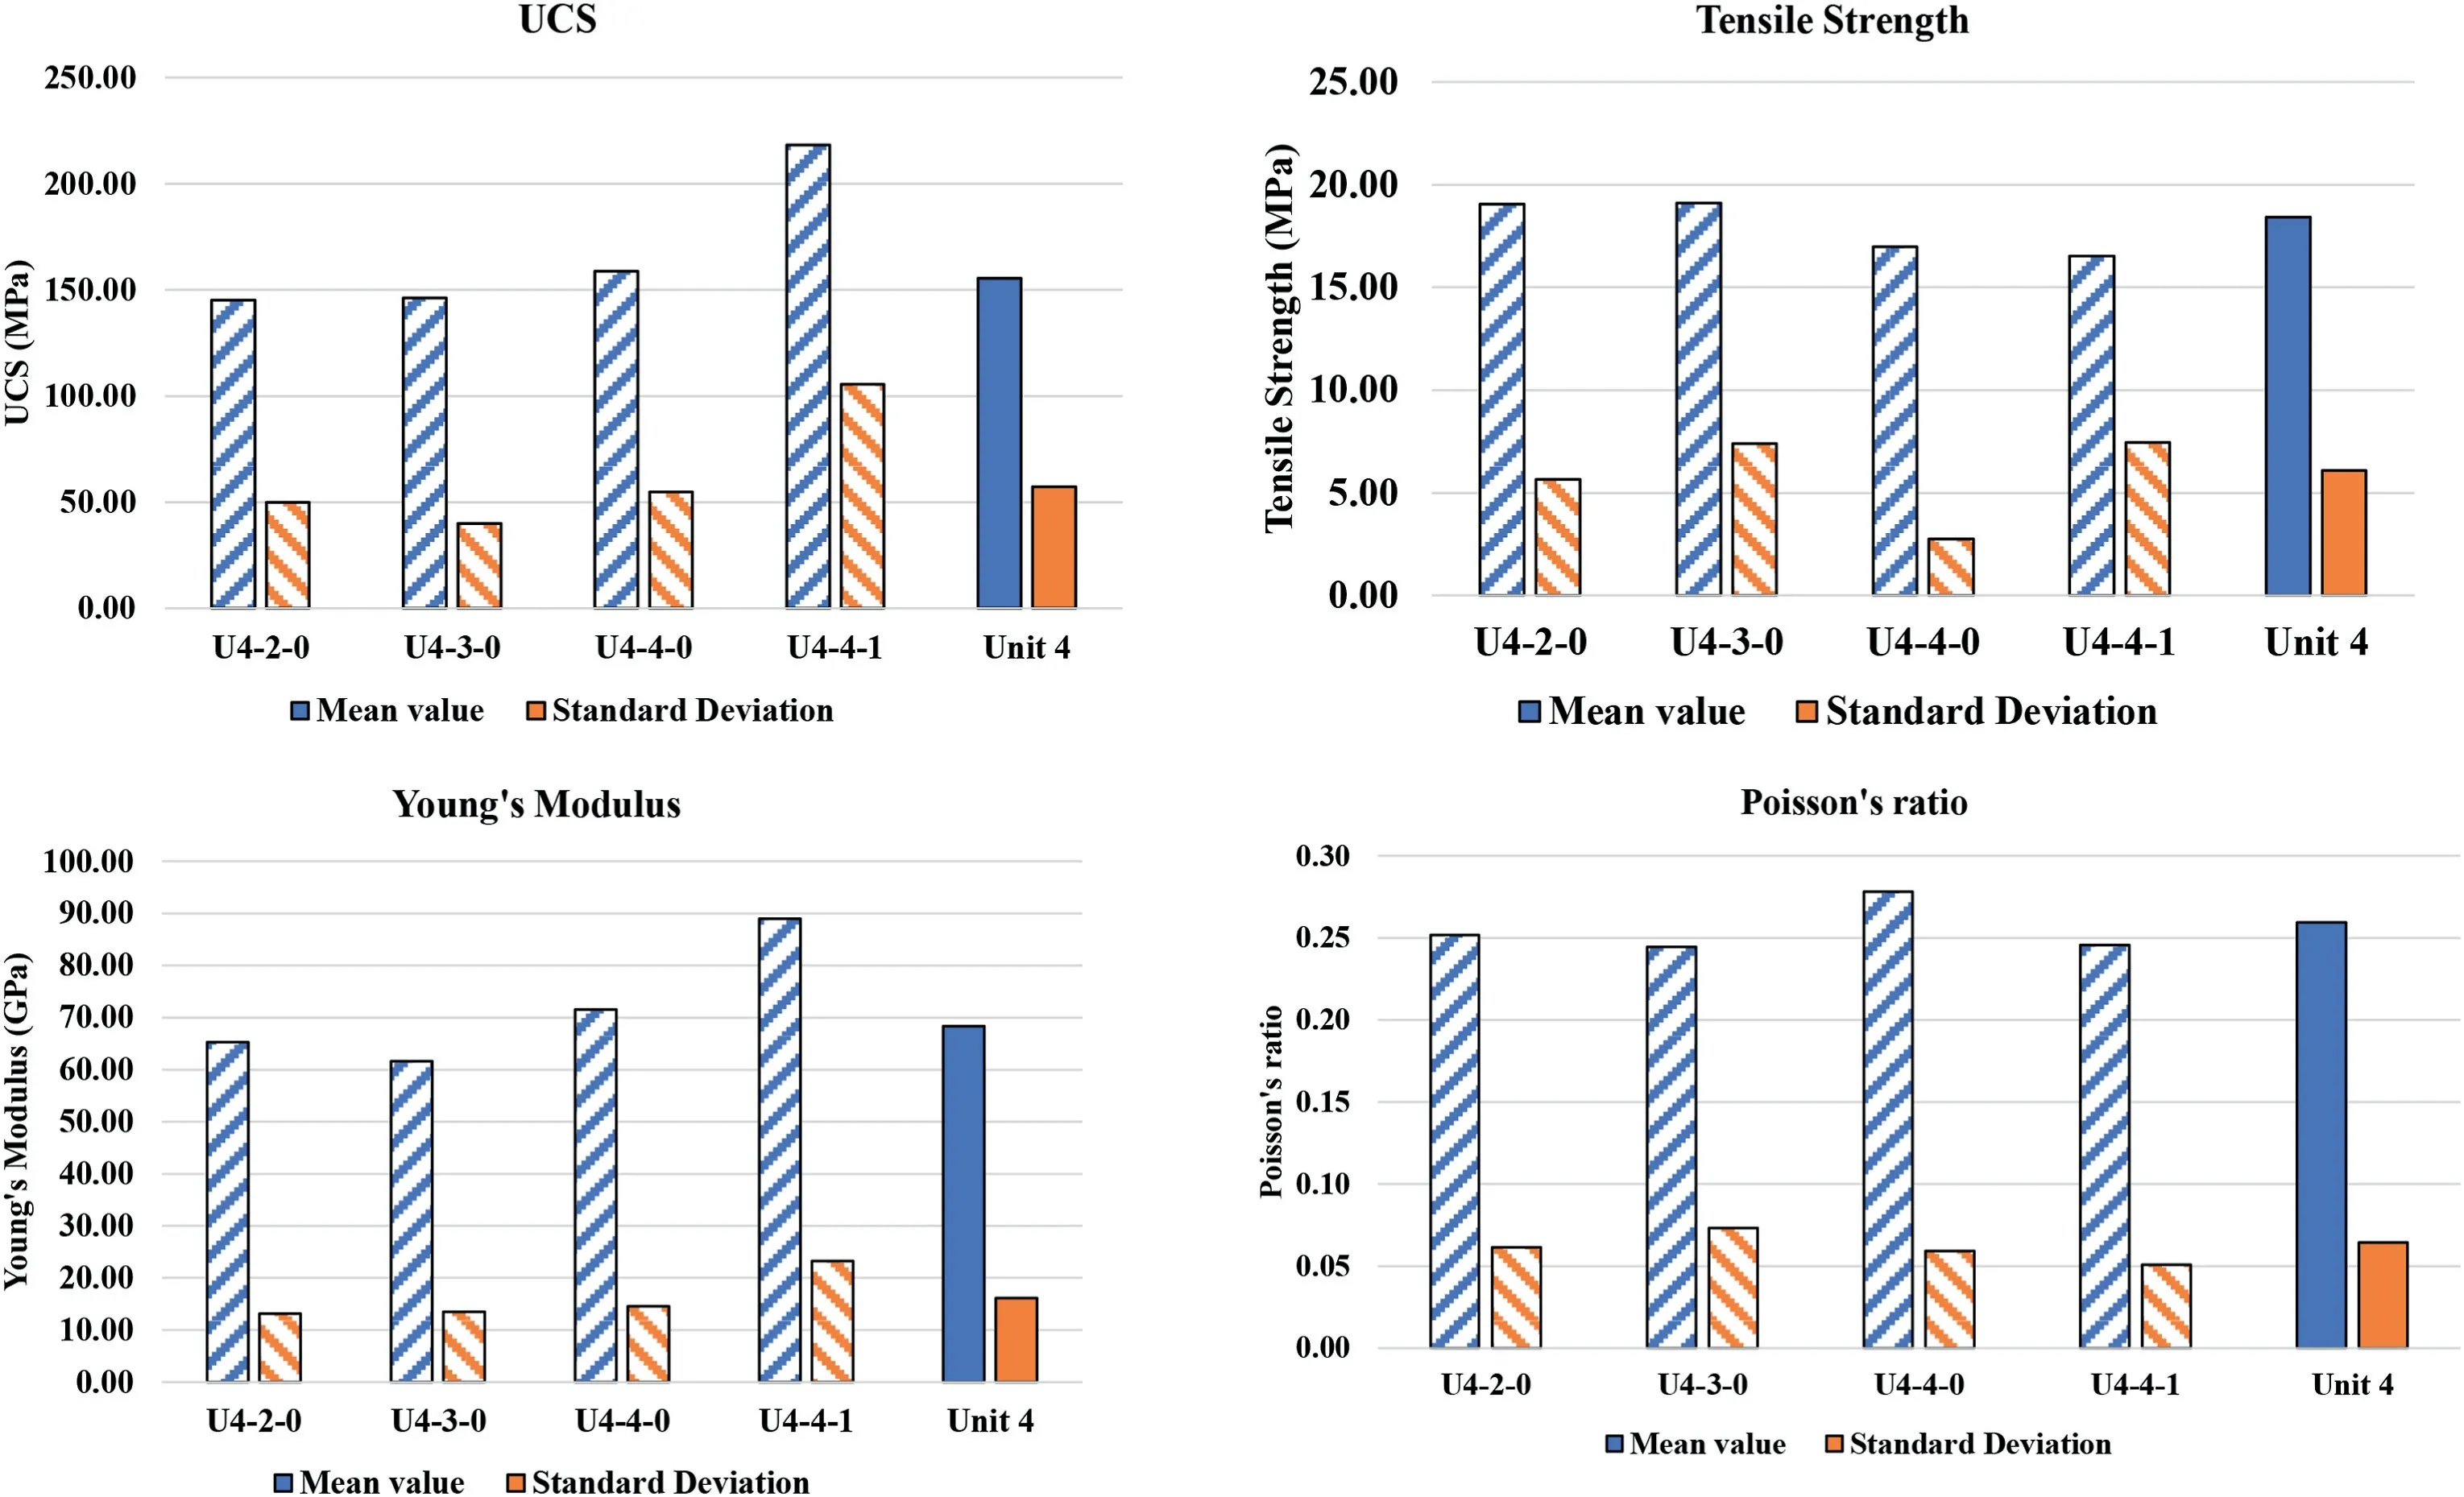
Fig.4.Comparison of mean and standard deviation values of the geomechanical intact parameters for Unit 4 and its sub-units.

Fig.5.Comparison of mean and standard deviation values of the intact geomechanical parameters for Unit 5 and its sub-units.
In this study,we have used the geomechanical data of 47 drilled boreholes in rockburst-prone units of the Westwood Mine by conducting 465 geomechanical laboratory tests at the Université du Québec à Chicoutimi,Canada (UQAC) (Tremblay,2020).All core samples were extracted from Units 3,4,and 5,where the recent rockburst occurrences caused the closure of the entire mine in previous years (Kalenchuk et al.,2017;Bouzeran et al.,2019;Tremblay,2020).Table 1 presents the type and the number of laboratory tests that refer to each lithological unit,and a “meta”prefix was added to the name of the rock samples because the rock mass was partially metamorphosed.In addition,the sample parameters,such as the sample mean and variance,can be accepted as the population mean and variance because the number of samples in this research is higher than 30(Spiegel,1961;Gill et al.,2005).
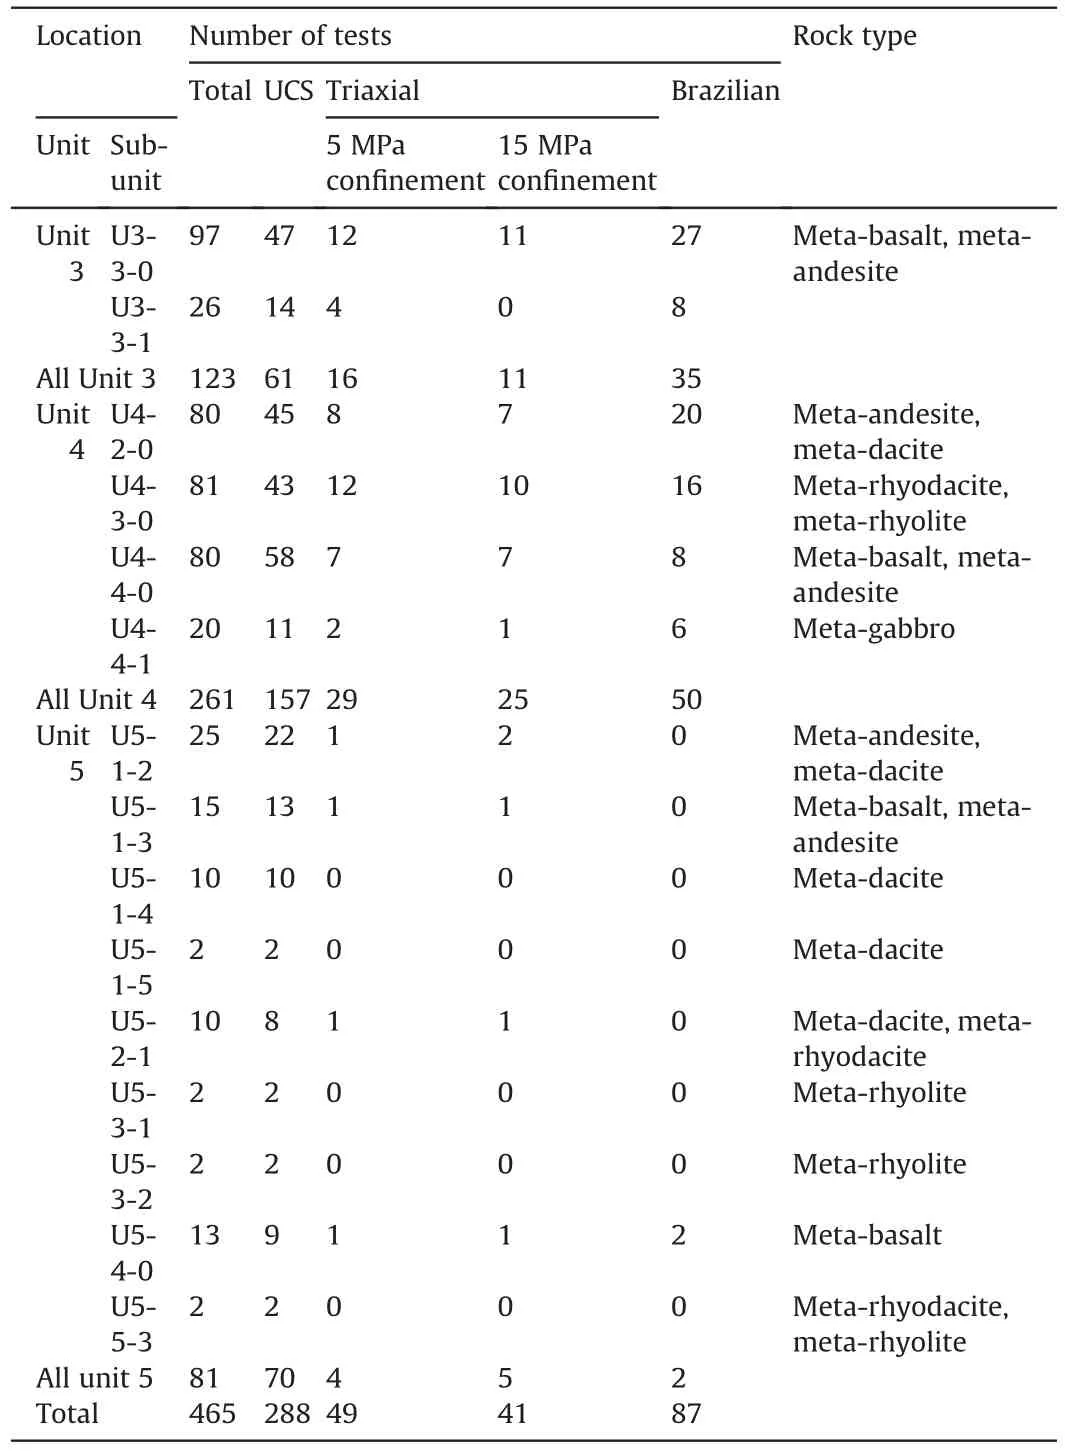
Table 1Type and number of laboratory tests conducted on the analyzed rock units(units 3,4,and 5) at the Westwood Mine.
The initial estimations of geomechanical parameters based on the sub-units and main units are presented in Figs.3-5.The mean value of all parameters and their associated uncertainties are assumed to be based on the main units because no considerable difference between the values of sub-units and main units are observed,as depicted in Figs.3-5.
However,notable uncertainties remain unclear in each geomechanical parameter,which will be carefully investigated in this paper based on geomechanical and statistical concepts.From the rock mechanics perspective,certain uncertainties are associated with the intrinsic nature of the rock materials.In fact,the rock formation process and its alterations over geological and mineralogical history can cause related uncertainties,and the major origin of uncertainties may vary in different geomechanical parameters(Connor Langford and Diederichs,2015).Considering the intact rock strength,the variations in petrographic characteristics can create various microcrack patterns within each core sample,leading to some variabilities in the rock strength parameters.The petrographic parameters include mineral composition and texture,pores,and microstructures (e.g.grain boundaries and mineral cleavages) and the degree of chemical alteration,which has variations that can influence rock strength.Moreover,the anisotropy,which is mostly seen in the foliation of foliated metamorphic rocks,can affect rock strength significantly.Likewise,the variations in Young’s modulus and the Poisson’s ratio are observed with the variability of several parameters as water content,degree of jointing,and the vibration effects of the blasting near the mining areas(Connor Langford and Diederichs,2015;Heidarzadeh et al.,2020,2021).In terms of statistical analysis,the associated uncertainties of geomechanical parameters of intact rocks are mostly correlated with extreme values in every dataset.Hence,labelling any extreme value as an outlier without having a strong reason is highly likely incorrect,and the highest and lowest geomechanical parameters must be statistically checked to determine whether they are outliers or not.
4.Treatment of geomechanical laboratory data
In geomechanical datasets,the major associated uncertainties are analyzed statistically through a proper data treatment process that includes five main steps(Fig.6).The suggested data refinement flowchart in this study greatly contributes to the determination of the most suitable technique for detecting outliers,leading to the selection of the best treated data so that the uncertainties will be minimized,which has not been given focus in previous geomechanical studies.Also,the impact of various treatment techniques on the geomechanical data and related uncertainties is comprehensively assessed in this section.In the first step,a comprehensive statistical analysis is conducted on every geomechanical intact parameter in each rock unit by applying 17 different treatment approaches.The most reliable treatment methods are selected separately for every parameter through a comparative evaluation according to engineering judgment.The outliers identified by the selected methods,which can substantially decrease the uncertainties,must be treated well because these extreme abnormal values are making huge variations in the data.Subsequently,to determine the best data treatment technique,we compare the selected methods by means of three goodness-of-fit tests,which are statistical procedures used to determine how well a sample data fits a certain distribution.Finally,the dataset with the best results among all the three fitting tests is selected as the dataset treated by the best treatment method.

Fig.6.Data refinement flowchart to select the best data treatment technique.
4.1.An overview of data treatment techniques
In this paper,we utilized a diverse set of 17 outlier detection methods,categorized into two main groups: interval labeling methods and test-based methods(Fig.6).The statistical principles governing outlier detection methods were thoroughly discussed by Dastjerdy et al.(2023) and summarized in the Appendix of this paper.Interval labeling methods involve the establishment of lower and upper fences to identify outliers by defining a range within which observations falling outside are considered as outliers.These methods can be further classified into three groups based on the statistical tools employed to define the range.The first group includes methods utilizing the interquartile range(IQR),which is the difference between the first and third quartiles.These methods are commonly employed in Tukey’s boxplots and its modified versions such as sequential fences and adjusted boxplot.Among IQR-based methods,the adjusted boxplot employs the medcouple function as a robust measurement tool of skewness,specifically useful in handling greatly skewed geomechanical data(see Eqs.(4)-(7)).The second group consists of median-based methods that use the median as a measure of central tendency to identify outliers.Examples include the modified Z-score method,2MADe,and 3MADe methods,where the median absolute deviation(MAD)is calculated as a robust measure of dispersion.The third group comprises standard deviation (SD) methods,which utilize the standard deviation as a measure of variability to detect outliers.Examples include 2SD,3SD,andZ-score methods,where a specified number of standard deviations from the mean is used to define the outlier threshold.On the other hand,test-based methods identify outliers through statistical hypothesis tests,involving a null hypothesis and an alternative hypothesis.The null hypothesis puts forth a specific statement regarding the dataset,while the alternative hypothesis refutes this statement.By examining whether an outlier is present in the dataset,these methods can effectively identify outliers.Testbased methods predominantly rely on the assumption that the data follow a relatively normal distribution,which can be considered a limitation.The categorization of these methods provides a framework for understanding their fundamental principles and application in identifying outliers within geomechanical parameter datasets.
4.2.Selection of the most appropriate outlier detection methods for geomechanical intact parameters and outlier treatment
To determine the most appropriate outlier detection method,the statistical and geomechanical principles must be considered.First,the interval values estimated by different outlier methods must be physically meaningful.Second,the number of detected outliers ought to be statistically acceptable.After selecting the most suitable outlier method,the outliers must be treated.In general,two main approaches,i.e.winsorizing method and trimming method,can be used to deal with the identified outliers.In the winsorizing approach,the nearest value in the dataset,a nonsuspicious value,is usually replaced with the identified outliers,whereas the trimming method involves the removal of the outliers from the remaining data(Kwak and Kim,2017;Gignac,2019).Some researchers suggest the replacement of the outliers in the lower and upper bounds with the 5th percentile and 95th percentile of the sample,respectively,which may produce some huge uncertainties (Ghosh and Vogt,2012).In this study,the trimming method was preferred because its use may lead to the re-insertion of several identical values (either low or high) that could overshadow the actual probability distribution function by increasing the error in both distribution tails.
4.3.Effect of sample size on determining the best outlier detection method
The effect of sample size on identification of the best outlier detection method for each geomechanical parameter is an important aspect addressed in this study.In this regard,we carefully evaluated the performance of different outlier detection techniques across various dataset sizes.It is important to recognize that sample size often serves as a constraint during the outlier detection process.Generally,a larger sample size provides more robust statistical power,allowing for a more accurate assessment of data distribution and a more accurate identification of outliers.With a larger dataset,certain outlier detection methods such as median-based and SDbased techniques,which rely on statistical assumptions and require a sufficient number of observations,become more reliable(Barbato et al.,2011).These methods can effectively capture anomalies and distinguish them from the main dataset.However,it is crucial to consider the limitations that arise with smaller sample sizes.Limited data points can lead to increased uncertainty and potential biases,making it more challenging to accurately identify outliers (Dastjerdy et al.,2023).Some outlier detection methods may struggle to provide reliable outcomes or may fail to identify outliers accurately,when working with smaller datasets.This issue will be discussed in the subsequent sections.
4.4.Results
The results in all 17 outlier detection methods applied on each intact parameter are completely discussed herein.In order to determine the best outlier detection method for each geomechanical parameter,we followed a systematic approach that was consistent across all parameters in this study.The criteria for selecting the best method involved considering the interval values provided by each method and the number of outliers detected for each parameter.It is worth emphasizing that our initial step was to assess the dataset and identify extreme values based on the specific characteristics and expected behavior of the rock type under study.We aimed to highlight extreme values that exceeded both the lower and upper thresholds.After identifying these extreme values,we systematically conducted a variety of outlier detection methods on each geomechanical dataset.The methods that presented ranges specifically tailored to each parameter,and demonstrated consistent and reliable performance,were determined as the most appropriate outlier detection methods for the respective parameter.
However,it is important to note that the interval values in theZscore and the modifiedZ-score remain constant.With regard to the test-based methods,the only comparative criterion is the number of detected outliers,which may vary in different tests.The results indicated that these tests were not suitable methods for UCS data,as summarized in Table 2.Peirce and Grubbs tests are inapplicable for identifying the outliers in the UCS data because of their limitation in handling small sample size.Also,Doerffel’s test could not detect low extreme outliers,which is a severe drawback that possibly leads to a significant increase in UCS uncertainties.Chauvenet’s criterion and Dixon’s test (ratio of ranges) had a conservative approach in labelling the outliers.However,Dixon’s test(truncated means)detected the outliers excessively.Consequently,most interval labelling methods have created an incorrect value for the UCS data,thereby confirming their inapplicability in creating acceptable intervals for the UCS data because the negative bound values do not have any physical meaning.Therefore,these methods are rejected because they have almost ignored the low extreme values.
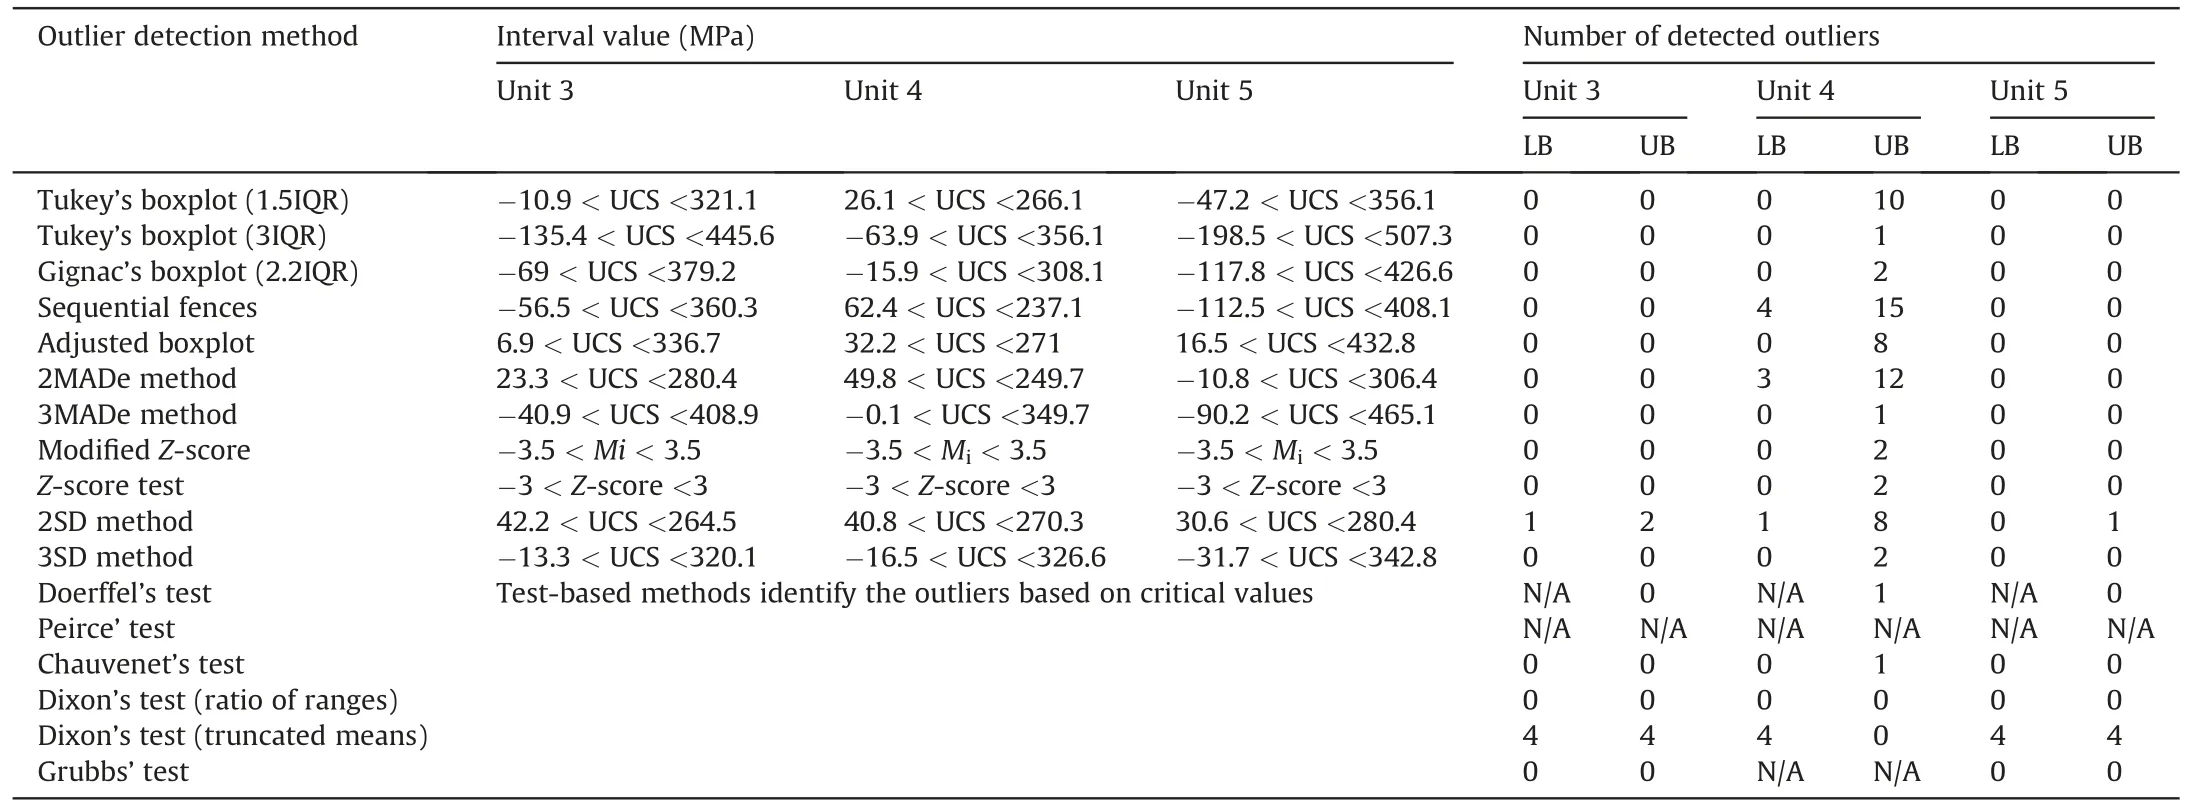
Table 2Summary of outlier detection methods applied on the UCS data in the three rock units (3,4 and 5).
To assess whether a UCS value is extreme and qualifies as an outlier or not,it is beneficial to consider the typical range of UCS values associated with a specific rock type.It is crucial to note that rock strength can vary widely due to factors such as rock type,mineral composition,and geological conditions.However,as a general guideline for metamorphic rocks,the UCS range for metabasalt typically falls between 70 MPa and 250 MPa,while metaandesite can have a UCS range of 50-200 MPa which are presented in the unit 3(Table 1)(Peng and Zhang,2007;Zhang,2016).These ranges could provide a reference guide for evaluating the strength values and identifying potential outliers in rock strength measurements.As a result,the intervals created by the adjusted boxplot and 2SD method are statistically and physically suitable for the UCS datasets.
Although each geomechanical parameter possesses unique characteristics and behaviors that require a customized approach,the analysis of UCS data and the application of various outlier detection methods offer valuable insights that can be extended to other geomechanical parameters.Our findings demonstrate that the sequential fences method,Grubbs’test,and Peirce’s test are not well-suited for large geomechanical datasets due to their limitations in handling sample size.Therefore,it is reasonable to expect that these methods may encounter similar challenges when applied to other parameters with extensive datasets.Moreover,our investigation highlights that the Doerffel’s test may not be an optimal technique for identifying outliers in geomechanical data,particularly those with low extreme values.This insight raises concerns about the reliability of this method for detecting outliers in datasets beyond the UCS parameter.In contrast,the adjusted boxplot method,which incorporates skewness,emerges as a promising approach for handling skewed geomechanical parameters.This method’s ability to account for skewness enables more accurate outlier detection and robust analysis,making it a suitable candidate for other parameters exhibiting similar skewness characteristics.By leveraging these insights,we can confidently extend the outcomes derived from the UCS data analysis to enhance outlier detection and improve the robustness of data analysis for other parameters sharing similar characteristics.The results and implications of the analysis conducted on tensile strength,Young’s modulus,and Poisson’s ratio are discussed below.
When examining the tensile strength data of metamorphic rocks,it is crucial to pinpoint extreme values that deviate significantly from the expected range.Table 3 briefly compares the results of outlier methods applied on the tensile strength data to select the most appropriate outlier methods.
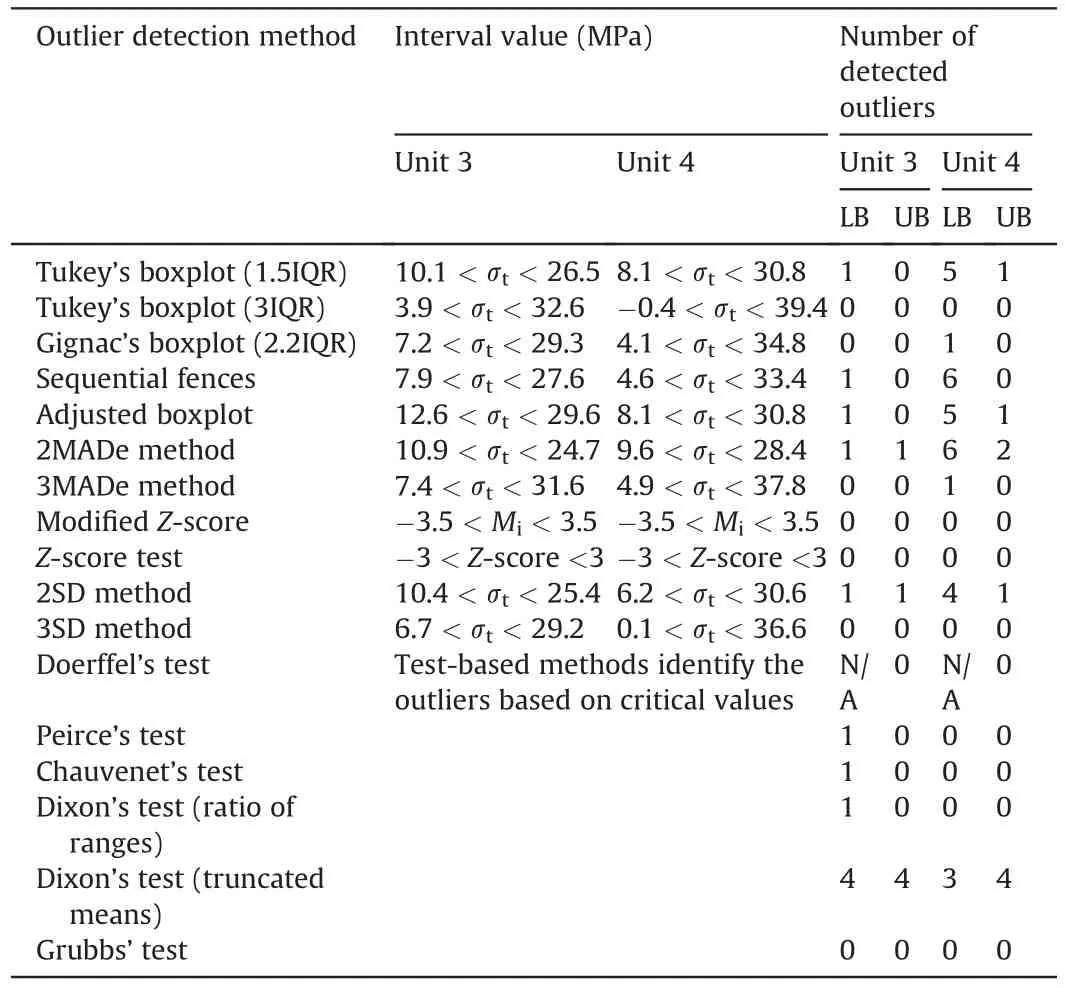
Table 3Summary of outlier detection methods applied on the tensile strength data (σt) in two rock units (3 and 4).
As reported in the literature,a typical range of tensile strength values for metamorphic rocks falls within the range of 8-30 MPa(Khanlari et al.,2014;Perras and Diederichs,2014;Abdaqadir and Alshkane,2018).By carefully considering the rock types and their standard range of tensile strength values in Units 3 and 4(metavolcanic rocks),we evaluated the interval values estimated by various methods,in which the outliers detected by Tukey’s boxplot(1.5 IQR) (providing the intervals 10.1 <σt<26.5 for Unit 3 and 8.1 <σt<30.8 for Unit 4) and Gignac’s boxplot (estimating the intervals 7.2 <σt<29.3 for Unit 3 and 4.1 <σt<34.8 for Unit 4)seem to be more suitable based on engineering judgement,aligning well with the expected behavior.
Conversely,we found that several other methods,including Tukey’s boxplot(3IQR),modifiedZ-score,Z-score,3SD method,and Grubbs’ test,could not identify any outliers in the tensile strength data despite the presence of very extreme datapoints-especially in Unit 4.Furthermore,our analysis unveiled the potential of the adjusted boxplot method in successfully identifying outliers in the tensile strength data,since the intervals estimated by this method showed promise as a reliable option.
With regard to the deformability parameters of intact rock,a proper treatment approach should be sufficiently applicable in identifying the most unusual values as outlier,because the presence of outliers in the dataset can greatly influence the respective mean value and standard deviation,which is of great significance in the study of susceptible units to rockbursts.Therefore,extreme values (high or low) should be carefully examined for Young’s modulus or Poisson’s ratio data.Moreover,considering the rock types and their general deformability values in the present study,which are all partially metamorphosed (Table 1),the extreme values for Young’s modulus and Poisson’s ratio could be considered the contaminant datapoints,which were evaluated by using various outlier methods.For instance,in Rock Unit 3,four Young’s modulus have values greater than 100 GPa (e.g.101,105,106,and 107 GPa),which are considered unusual values based on the presented rock type in Table 1 and might be detected as outlier.Extreme values of Young’s modulus in metamorphic rocks can be identified based on their stiffness and resistance to deformation.Young’s modulus represents the ratio of axial stress to axial strain,and in the case of metamorphic rocks,their low displacement during compressive testing indicates high stiffness.In the context of the studied rock types,such as meta-basalt and meta-andesite,the typical range of Young’s modulus falls within 10-90 GPa for meta-basalt and 20-100 GPa for meta-andesite (Peng and Zhang,2007).Comparing these typical ranges to the extreme values observed (e.g.101,105,106,and 107 GPa),it becomes evident that these values exceed the upper limit of the expected range.Statistically,they are distant from the majority of the dataset and represent a significant deviation from the expected behavior.As summarized in Table 4,several methods,such as Tukey’s boxplot(3IQR),Gignac’s boxplot,3MADe method,Z-score,modifiedZscore,3SD method,and almost all test-based methods,were unable to recognize any outliers in the Young’s modulus data.Only the adjusted boxplot and 2MADe method identified those high extreme values in Unit 3,although the estimated interval value of the adjusted boxplot in the lower bound might sound incorrect -particularly in Unit 5.As a result,these two methods(e.g.adjusted boxplot and 2MADe) are selected as the best methods for Young’s modulus data.
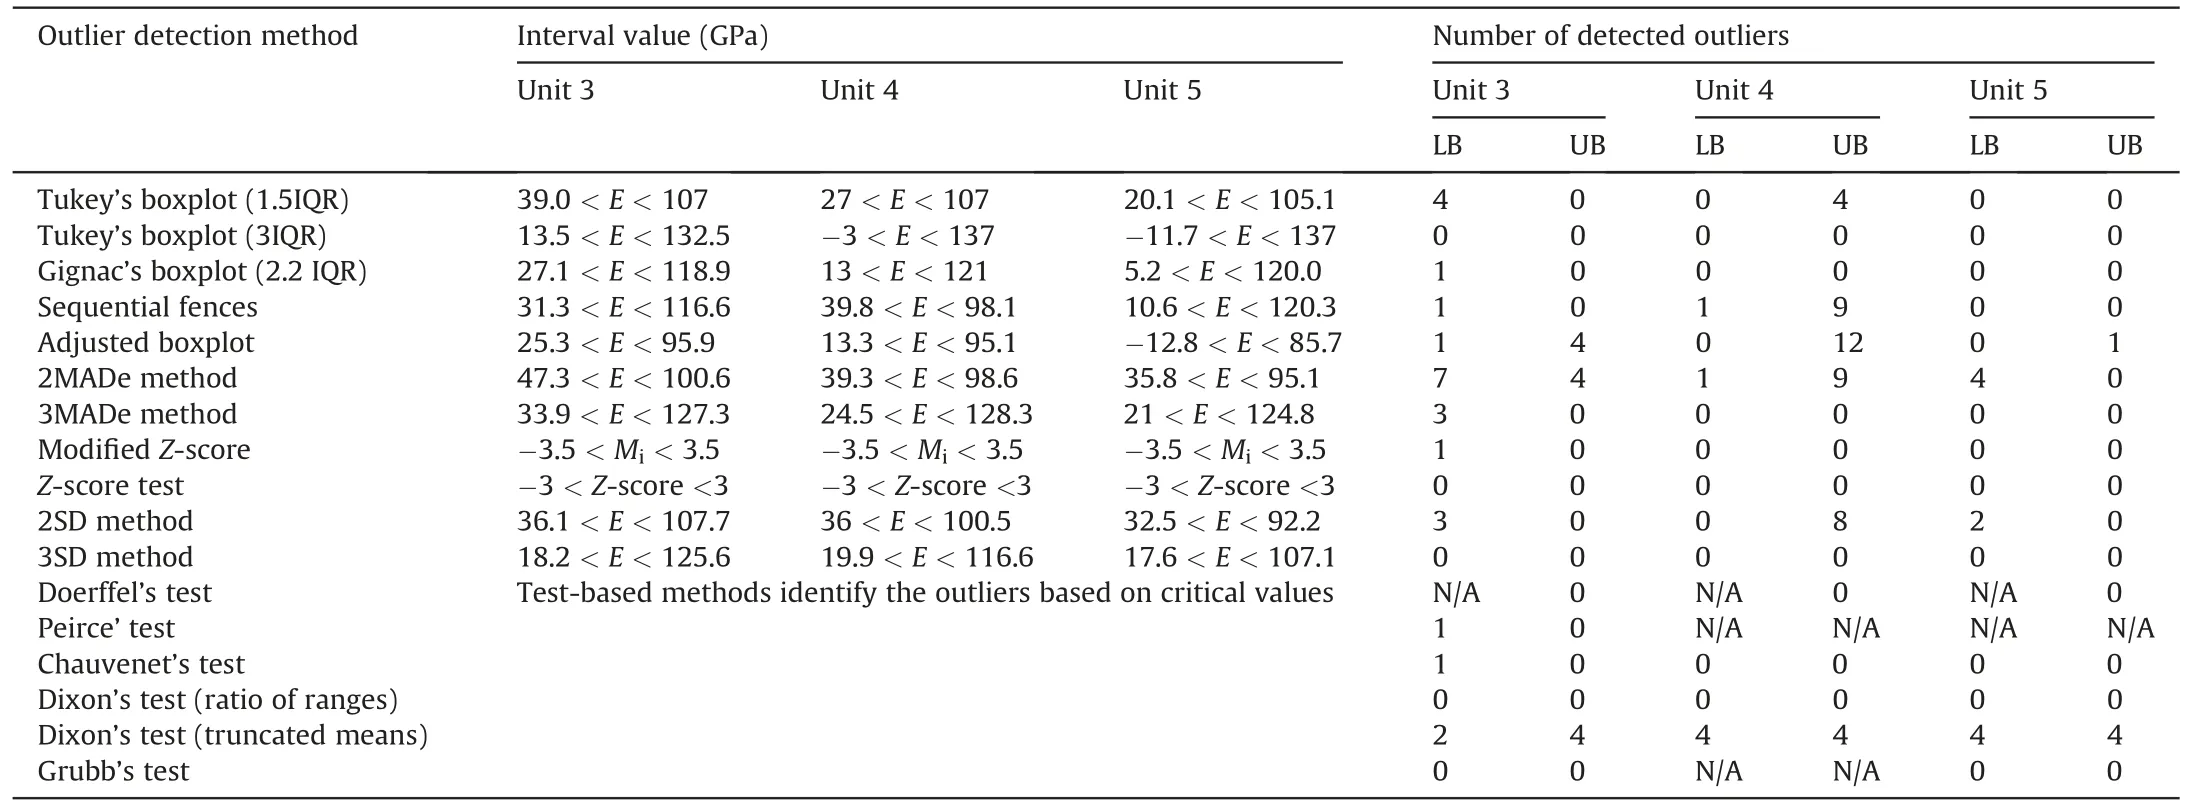
Table 4Summary of outlier detection methods applied on Young’s modulus (E) data in the three rock units (3,4,and 5).
In the Poisson’s ratio data,the normal range of the data can be quantified based on the rock type.Considering meta-basalt and meta-andesite as the two main rocks of Unit 3,some Poisson’s ratio values,such as 0.4,0.41,0.43,0.45,and 0.46,are recognized as unusual.Outliers in Poisson’s ratio can signify irregularities in the material or measurement errors.In the case of metamorphic and metavolcanic rocks,which exhibit low plasticity and limited displacement during compressive testing,Poisson’s ratio tends to be relatively small(Peng and Zhang,2007;Zhang,2016).Deviations from this expected range,particularly high values exceeding 0.4,may indicate anomalies and potential issues in the measurement setup or instrumentation used during testing (Gercek,2007;Peng and Zhang,2007;Zhang,2016).These irregularities could stem from inaccurate lateral displacement measurements,anisotropic properties beyond the norm,localized deformation zones,or variations in sample quality or heterogeneity.Therefore,extreme Poisson’s ratio values serve as strong indicators of abnormalities and warrant further investigation into potential errors or unique geological features within the rock sample (Gercek,2007).Meanwhile,despite the presence of these abnormal values,most of the applied methods could not label these values as outlier.In this study,the 2MADe method and Dixon’s test statistically recognized these outliers,even though these methods apply two different statistical approaches,which were reviewed earlier in this paper.According to the results,the 2MADe method and Dixon’s test are selected as the two best data treatment methods for the Poisson’s ratio data (Table 5).In all intact rock laboratory data,these two selected methods will be compared with each other to determinethe best outlier detection method based on three goodness-of-fit tests,which will be discussed in detail.
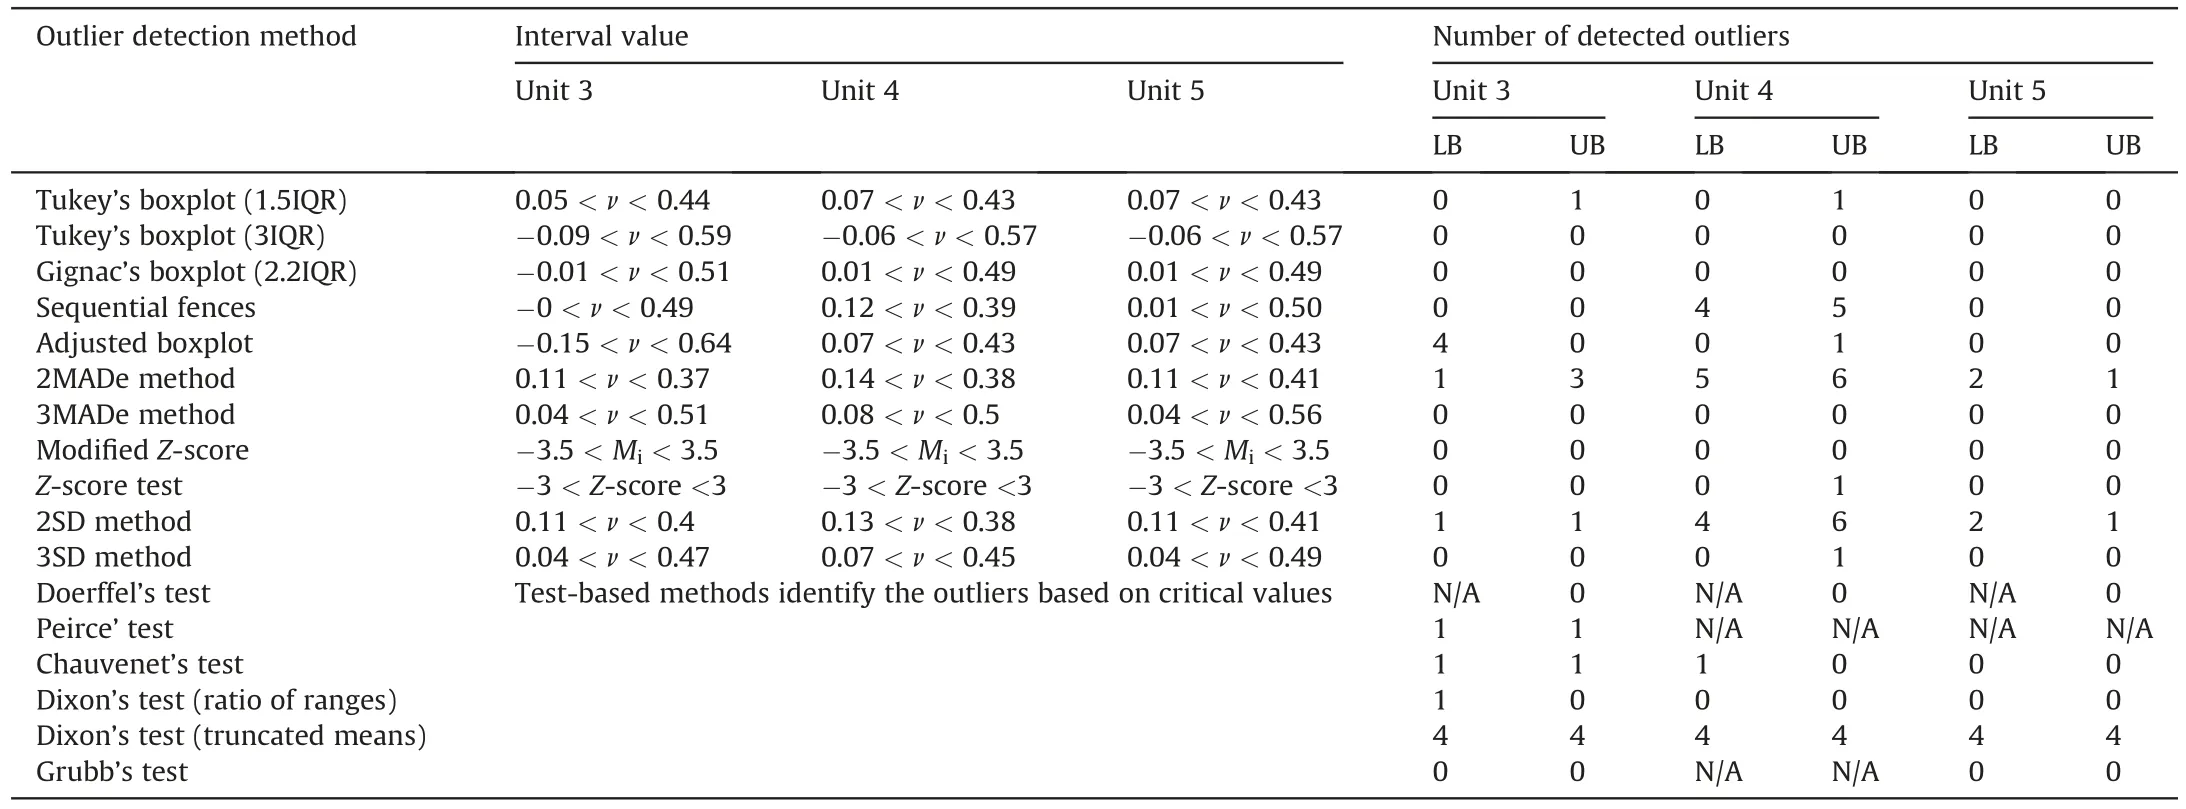
Table 5Summary of outlier detection methods applied on Poisson’s ratio(ν) datasets in the three rock units (3,4,and 5).
4.5.Determination of the best outlier method using goodness-of-fit tests and assignment of the best fitted probability distribution function for each parameter
To determine the best outlier method,three goodness-of-fit tests,including the probability plot,Anderson-Darling (AD) test,and Akaike information criterion(AIC)test,are used.The goodnessof-fit tests are statistical tools used to characterize how well a sample datum follows a specific distribution.The selected outlier detection methods are compared with one another.Finally,the dataset that obtained the best results among all the three fitting tests will be introduced as the best outlier detection method.Two computer programs,i.e.SPSS v.28 and the JMP v.16,were used for conducing these statistical analyses (JMP-Pro,2021;SPSS,2022).
The probability plot method is a graphical tool that compares thep-values and the theoretical distributions (Chambers et al.,2018).In this method,thep-values must be compared with the significance level (usually equal to 0.05) to investigate whether or not the data come from a specific distribution.If thep-value is equal or less than the significance level,then the related dataset fails to follow the specific distribution.However,the larger thep-value,the better fit to the distributions (Chambers et al.,2018).Additionally,any dataset can be visually compared by two confidence interval(CI) lines (Fig.7),as if thep-values are located inside the CI lines,thereby confirming that the data follows a particular distribution.
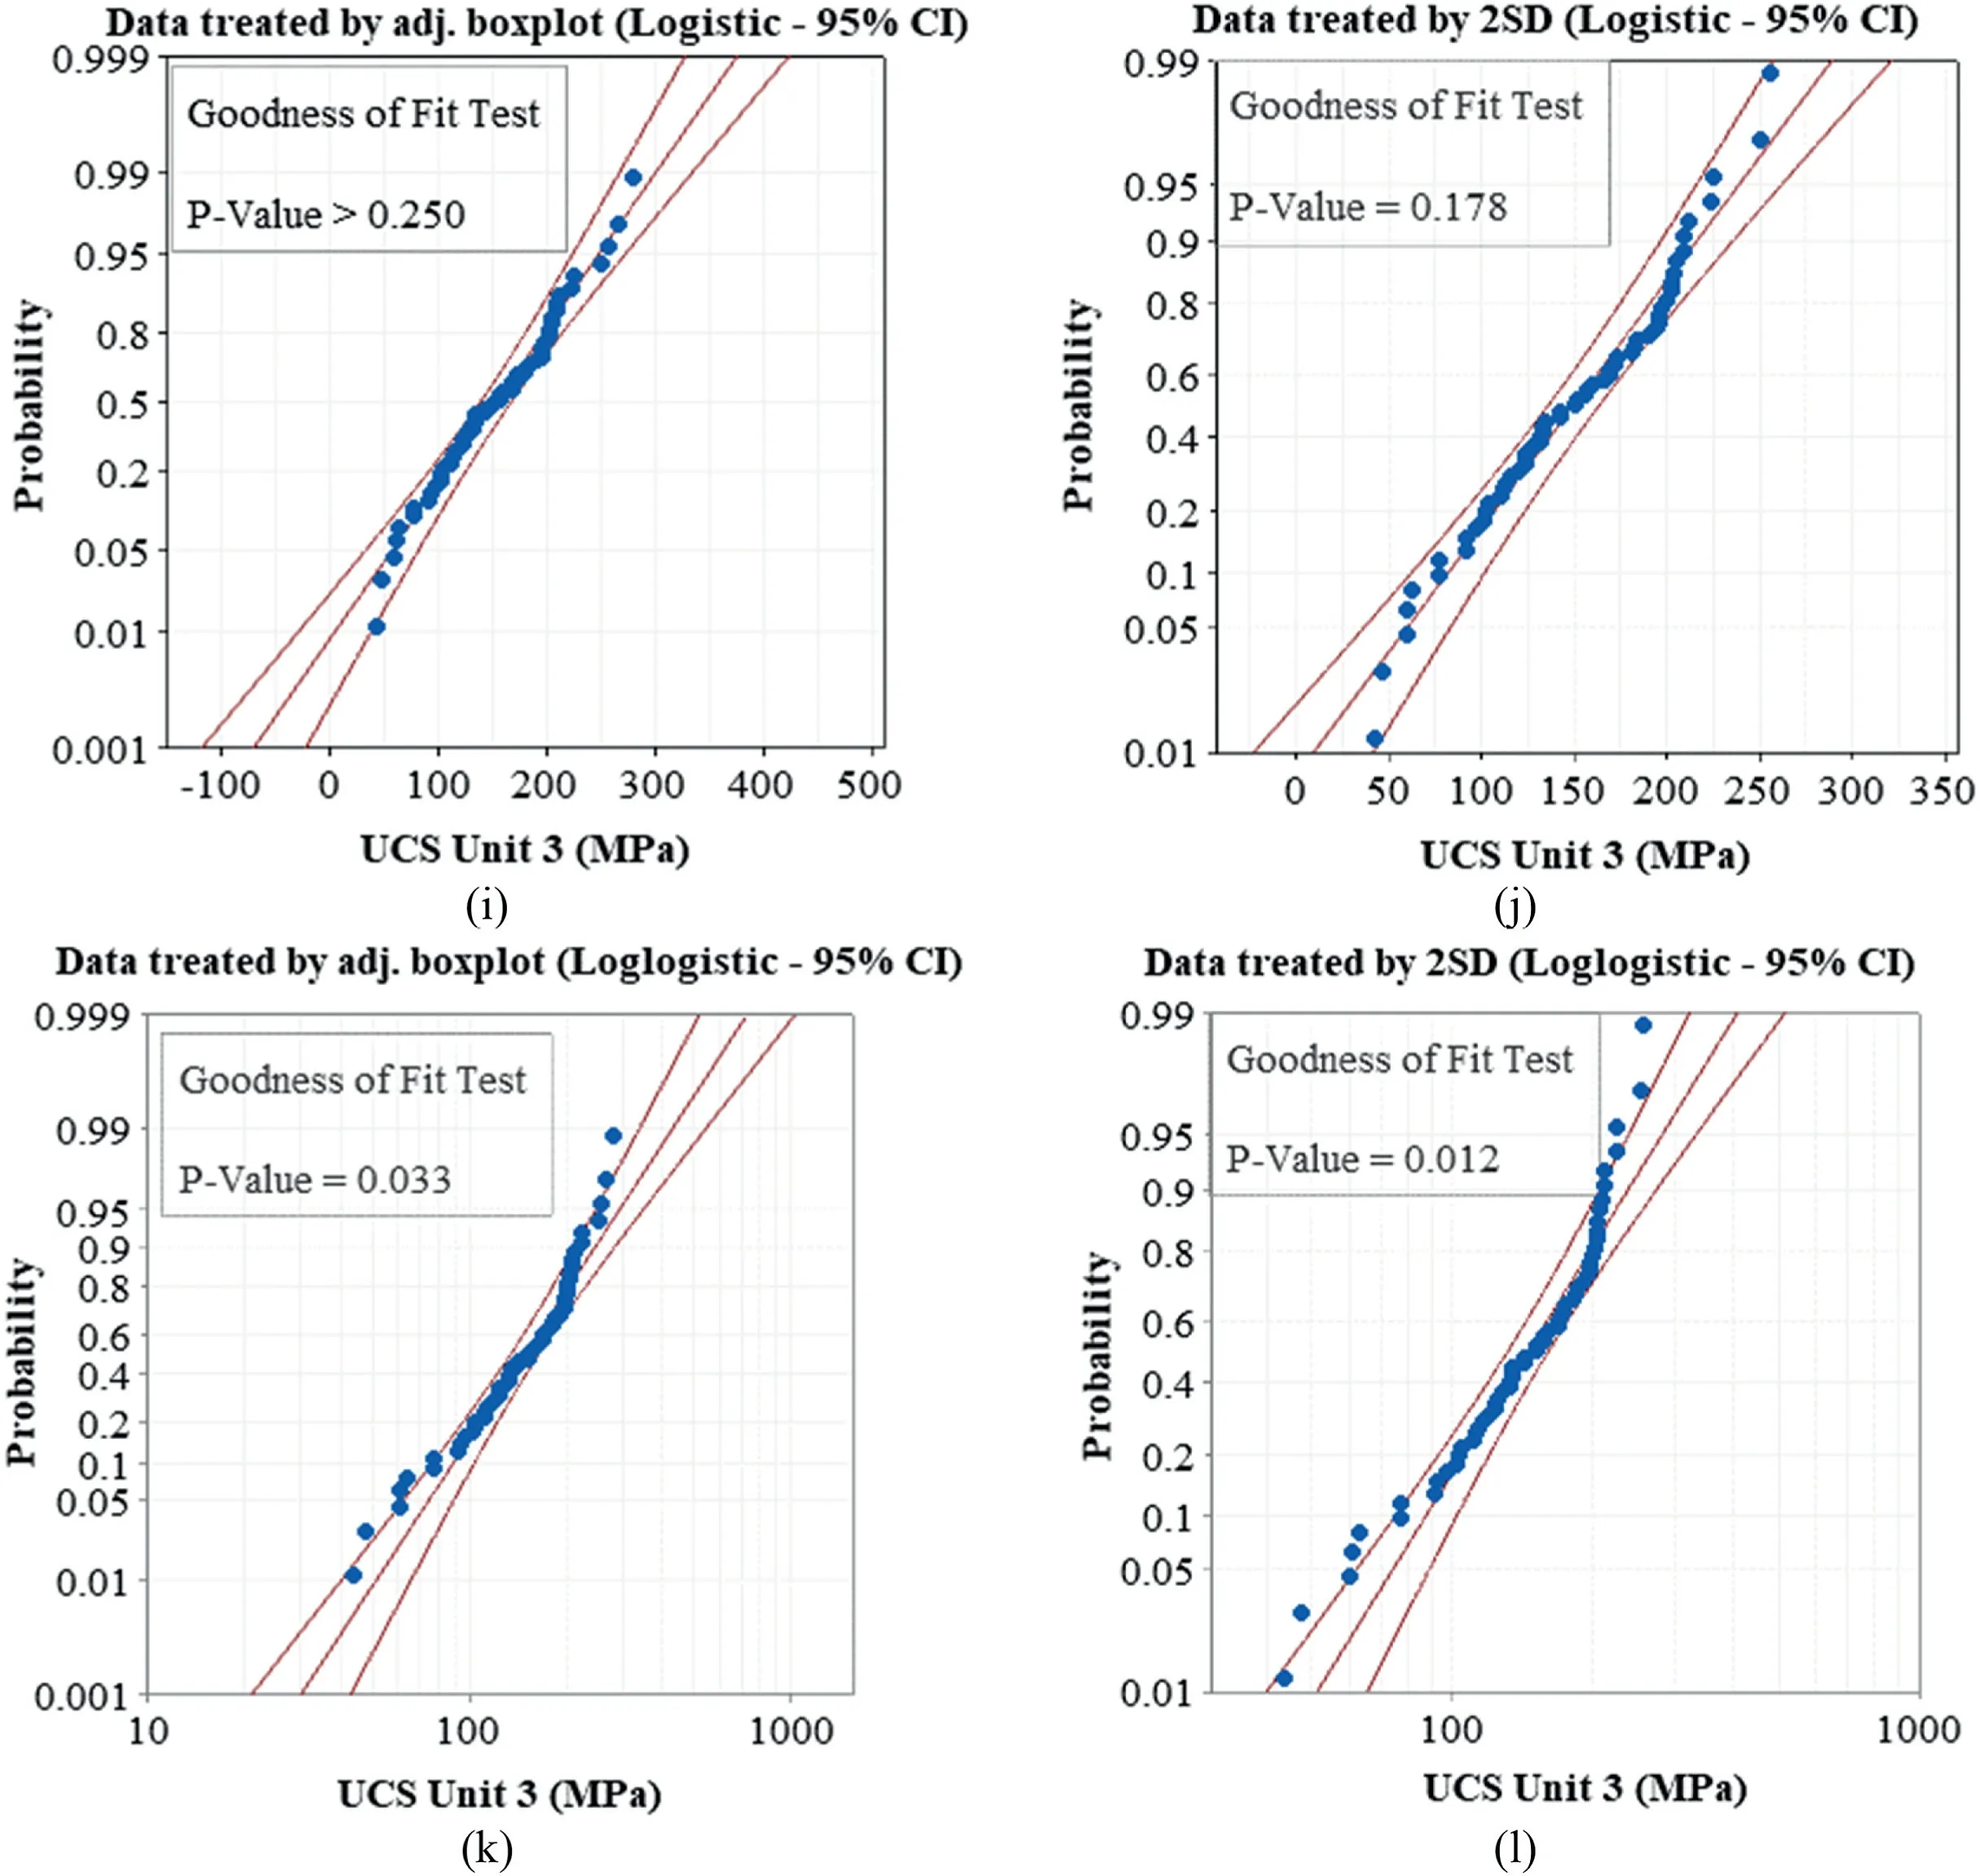
Fig.7.(continued).
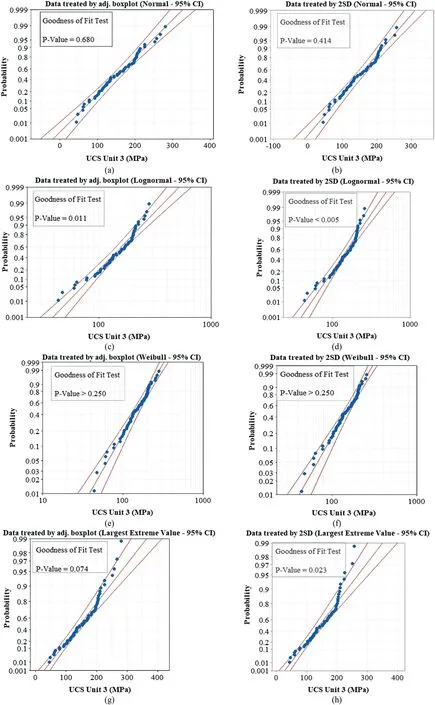
Fig.7.Probability plots of UCS Unit 3 dataset treated by adjusted boxplot and 2SD method.The middle line is the expected percentile from the distribution,and left and right curved lines are the lower and upper bounds of the CIs.
Considering the UCS data,the adjusted boxplot and 2SD methods are compared with each other in every rock unit.According to the probability plot method,the UCS dataset treated by the adjusted boxplot had greaterp-values than the 2SD method(Table 6).The probability plots of the UCS data revealed that although both datasets are following a normal distribution,the dataset treated by the adjusted boxplot is more fit for this distribution (p-value=0.68) than the 2SD method (p-value=0.414)(Fig.7a and b).Some other distributions,such as lognormal,exponential,and loglogistic,were invalid because theirp-values were less than the significance level (<0.05).The probability plot suggested that the adjusted boxplot is a better outlier detection method for UCS data rather than that of the 2SD method.
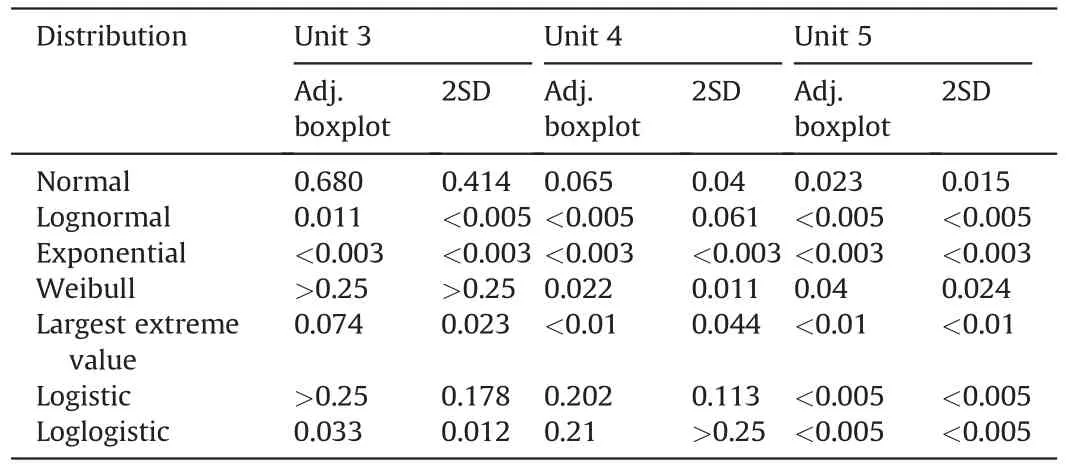
Table 6Summary of probability plots (p-values) for UCS data treated by adjusted (adj.)boxplot and 2SD method in three rock units.
The AD and AIC tests are also conducted to select the best outlier method for the UCS data (Anderson and Darling,1952;Akaike,1974).In both tests,the lesser values of AD and AIC statistics are considered a better fit to the distributions.Fig.8 presents the results of the AD and AIC tests conducted on the UCS Unit 3 data to analyze the adjusted boxplot and 2SD method.As summarized in Table 7,the AD values of the adjusted boxplot dataset are lesser than those of the 2SD method dataset,thereby confirming its better fit to the distributions,though the fit ranking may differ in the two datasets.In the adjusted boxplot dataset,the best fitted probability distribution function is Pert (AD value=0.245),whereas this distribution was less fitting to the 2SD method dataset (AD value=0.269),as presented in Fig.8a and b.The AD test results for the UCS in all rock units are in good agreement with the probability plots (Table 7),which indicates that the adjusted boxplot dataset had better fit than the 2SD method,whereas the AIC test results for the same datasets cannot confirm this finding.Lehmann (2015)conducted a comparative statistical analysis on the geodesy and geophysics data through the use of Monte Carlo simulations,and it was proven that the AIC test obtained more accurate results than the AD test.Therefore,the AIC test results was preferred than the AD test in this study.According to the AIC test,the UCS data treated by the 2SD method are more fit to the distributions (Fig.8c and d,Table 7).Consequently,the 2SD method is preferred to become the best outlier detection method for the UCS dataset in all three rock units.
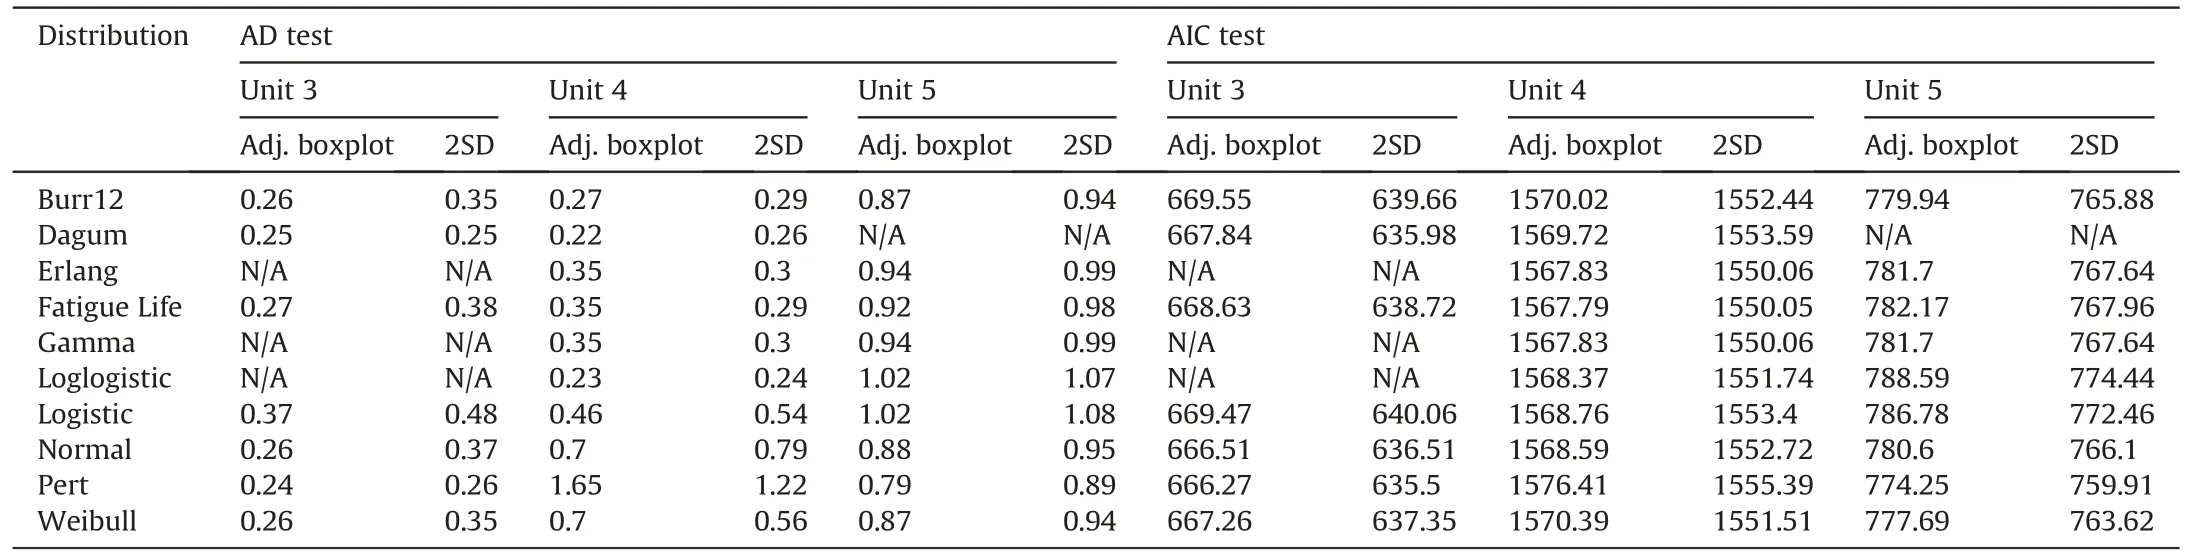
Table 7Comparison of UCS datasets treated by adjusted boxplot and 2SD method based on the AD and the AIC tests in three rock units.
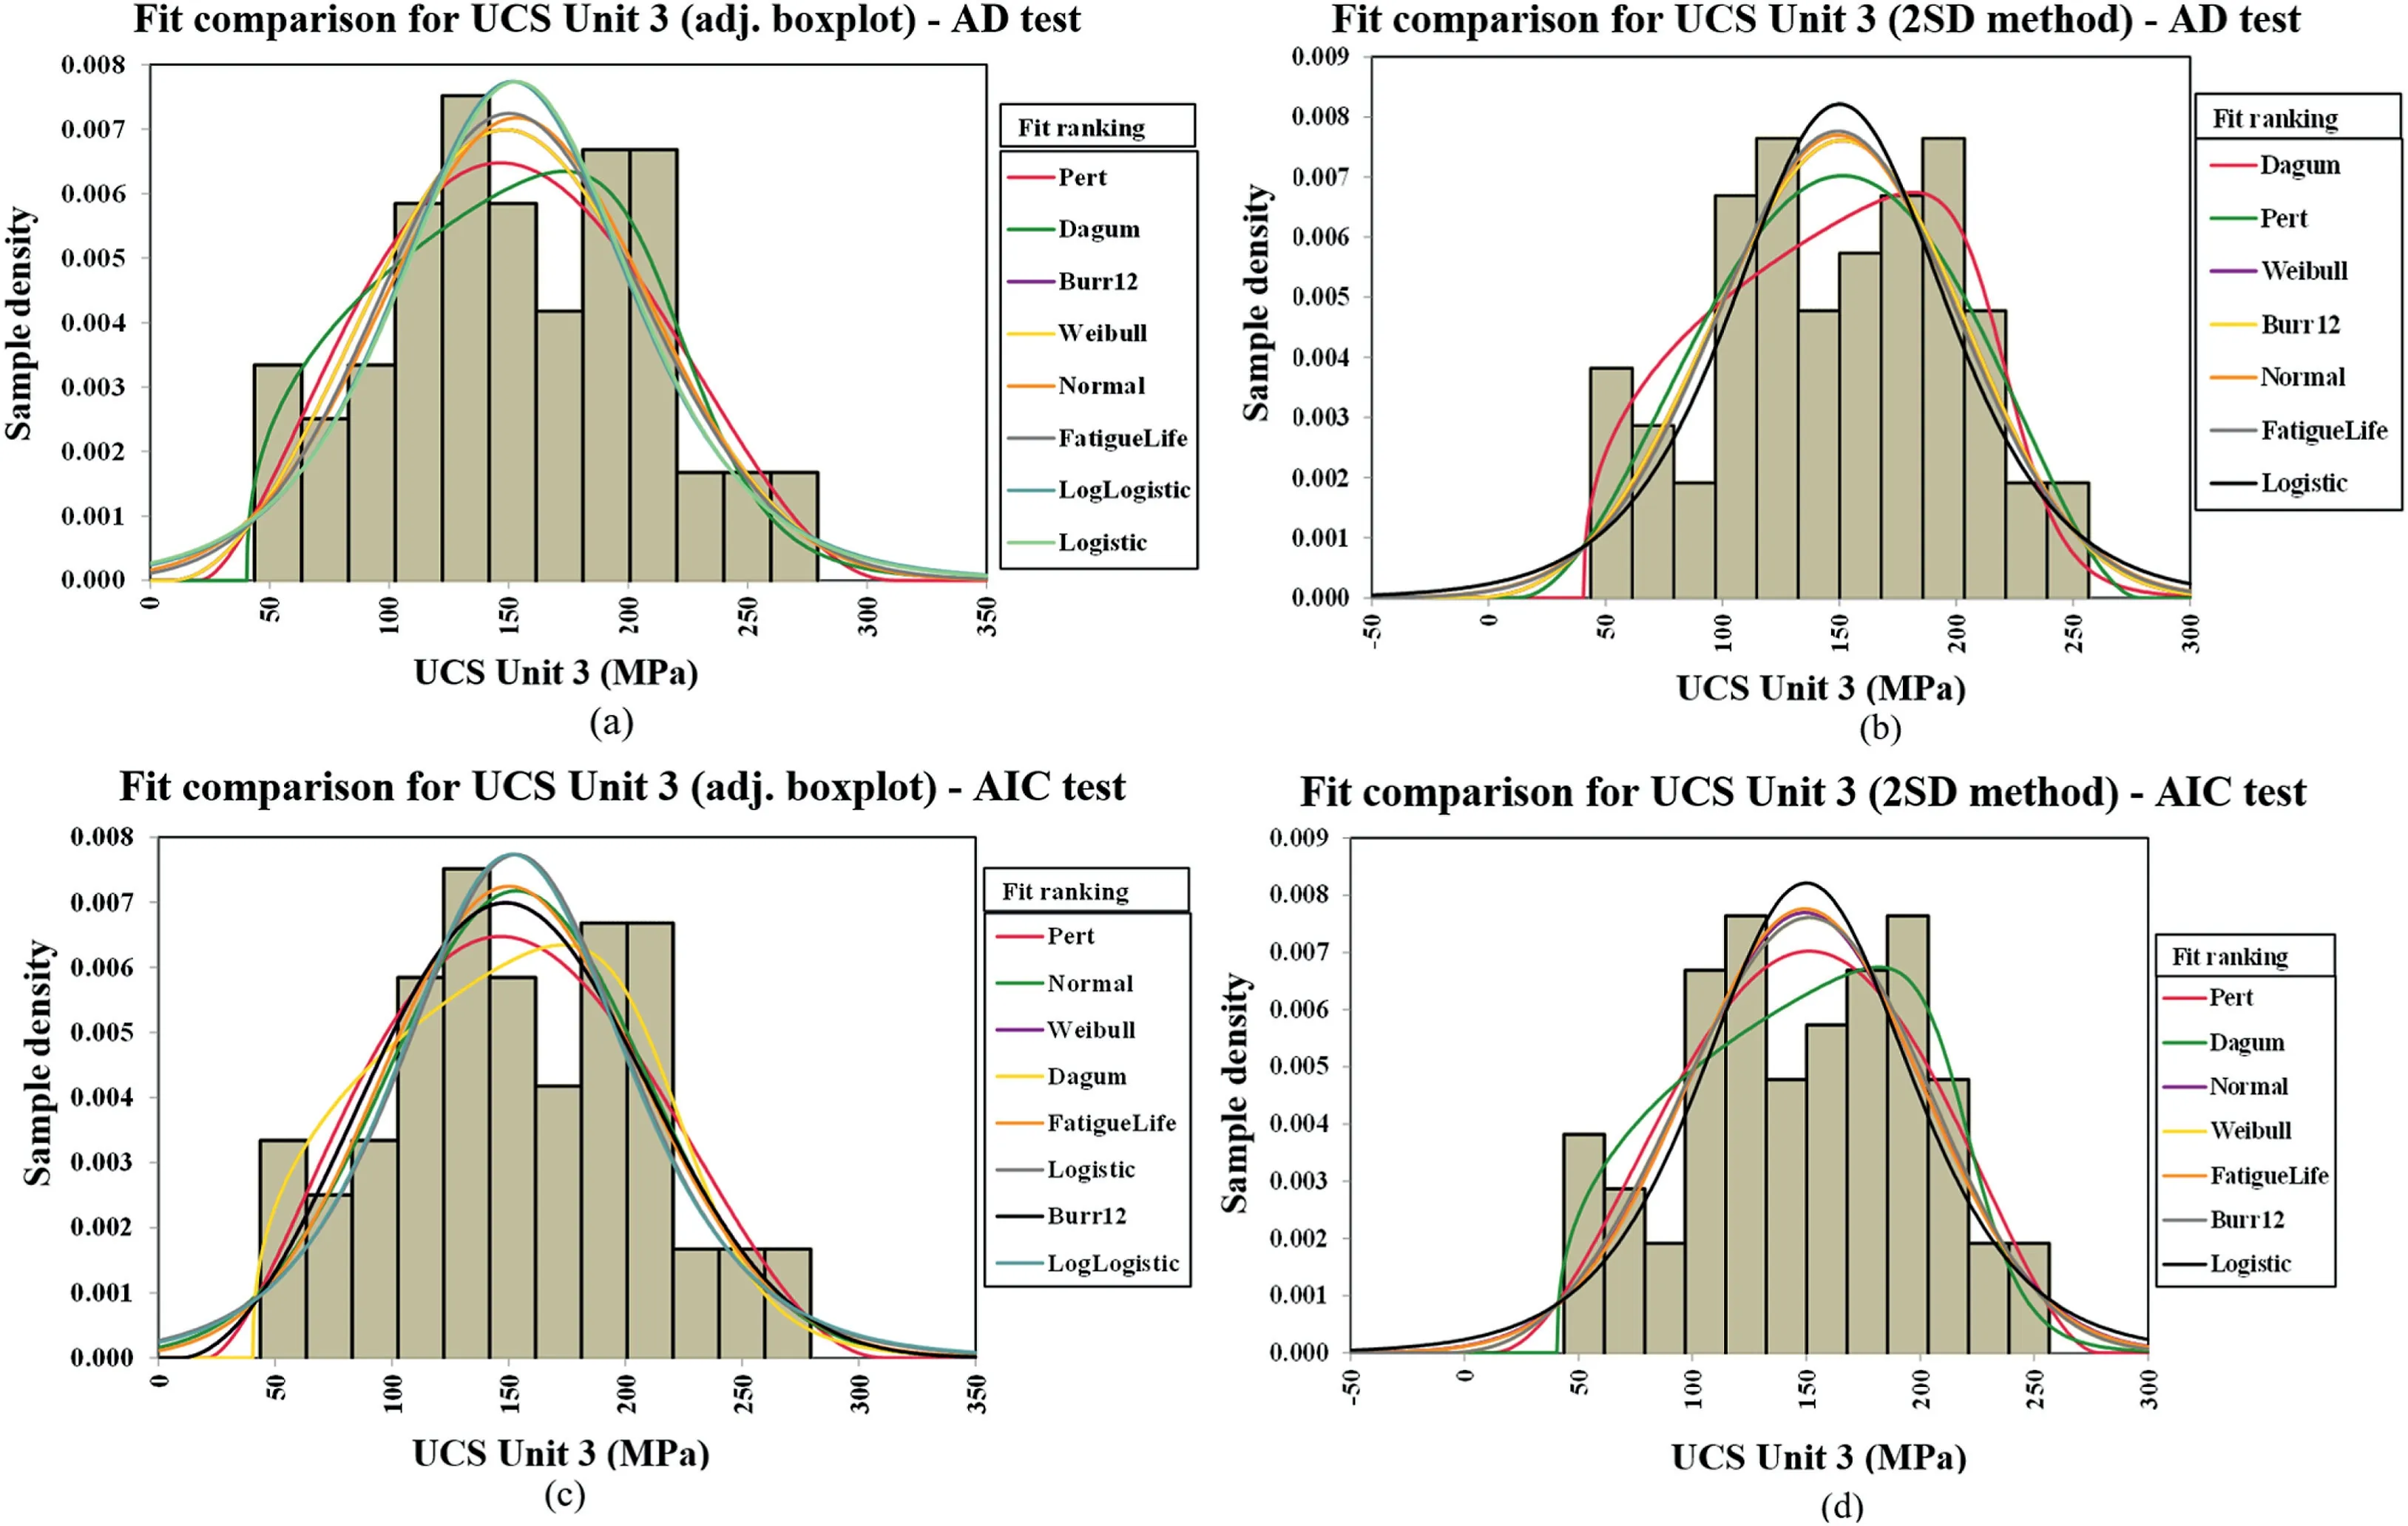
Fig.8.Graphical comparison of UCS datasets (Unit 3) treated by adjusted box plot and 2SD method: (a,b) AD test,and (c,d) AIC test.
In the tensile strength data,Tukey’s boxplot and Gignac’s boxplot were compared.In this case,the probability plots cannot be utilized to determine the best treated data because thep-values of the datasets in Unit 4 were less than the significance level.However,the AD and AIC test results demonstrated that the dataset treated by Tukey’s boxplot was more fitted to the distributions,though the AD values related to the Unit 3 of Gignac’s boxplot in some distributions,such as Burr12,Fatigue Life,and Normal,were a slightly better than that of Tukey’s boxplot(Table 8).Consequently,the Tukey’s boxplot is recognized as the most suitable outlier method for the tensile strength data.
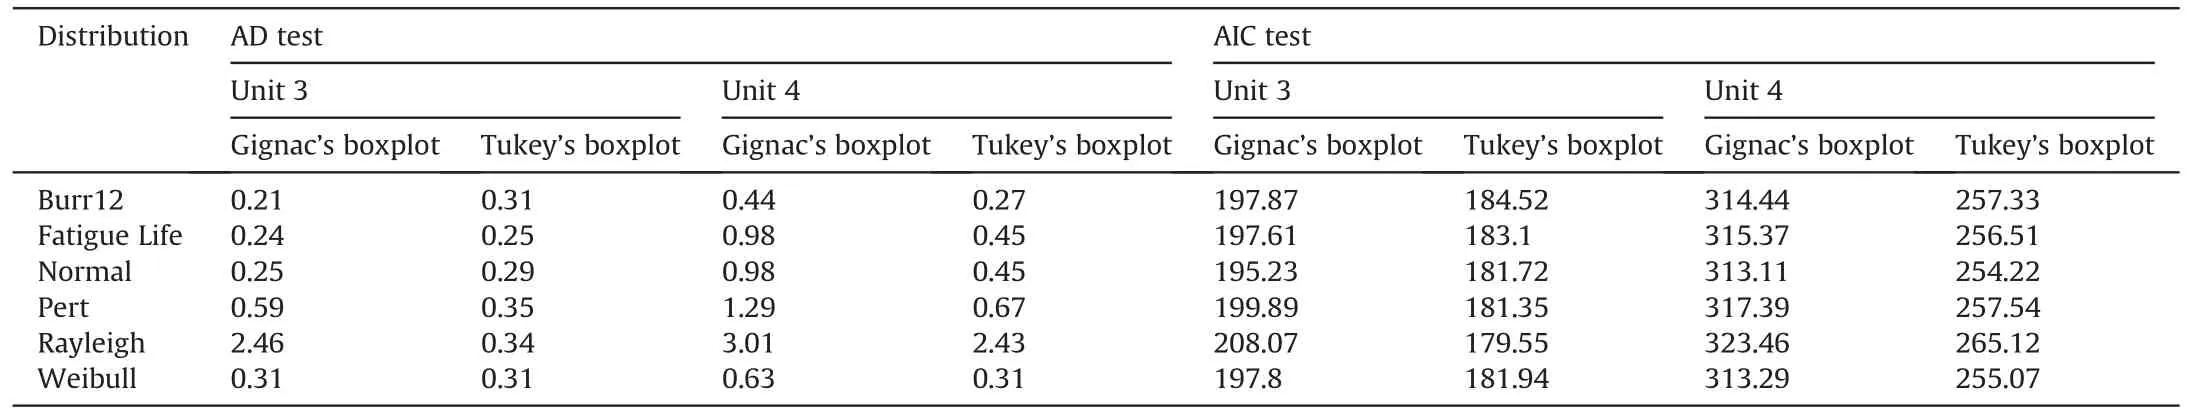
Table 8Comparison of tensile strength datasets treated by Gignac’s boxplot and Tukey’s boxplot based on the AD and AIC tests.
Similar to the tensile strength dataset,the probability plots for the deformability parameters were not also applicable because of the very lowp-values.With regard to the Young’s modulus data,the 2MADe method was determined as the best method for Units 3 and 5 data owing to the fact that the AD and AIC statistical values have had better fit to the distributions,whereas the adjusted boxplot method treated the Unit 4 data better than the 2MADe method.Table 9 summarizes the AD and AIC test results conducted on the Young’s modulus data.Concerning the Poisson’s ratio data,the goodness-of-fit tests showed very close results for the 2MADe method and Dixon’s test.However,the 2MADe method was determined as the best method for Units 3 and 4,and the Dixon’s test was selected because of its better fit to the distributions in Unit 5 (Table 10).

Table 9Comparison of Young’s modulus datasets treated by adjusted boxplot and 2MADe method based on the AD and AIC tests.

Table 10Comparison of Poisson’s ratio datasets treated by 2MADe method and Dixon’s test based on the AD and AIC tests.
After determining the most appropriate geomechanical intact parameters in each rock unit,the most fitted probability distribution function is assigned for every parameter in each rock unit.Fig.9 presents the best fit distribution plotted on the geomechanical parameters,in which the most reliable calculated mean and the standard deviation values were illustrated.Although the related uncertainties are still considerable,the mean values of UCS data in Units 3,4,and 5 are 149.25 MPa,148.37 MPa,and 152.47 MPa,respectively.The distribution fit ranking of the UCS data treated by 2SD method indicates that the Pert distribution is determined as the most suitable one for Units 3 and 5,whereas Fatigue Life distribution is the best fitted distribution for Unit 4,as illustrated in Fig.9a-c.In the tensile strength data,the Rayleigh and normal distributions are selected as the most suitable fitmodels for Units 3 and 4 with mean values of 18.25 MPa and 19.56 MPa,respectively (Fig.9d and e).Furthermore,the best fit models and the most suitable mean values are specified for the deformability parameters.With regard to the Young’s modulus data treated by 2MADe and adjusted boxplot,the normal distribution in Unit 3 (mean value of 74.31 GPa),Dagum distribution in Unit 4(mean value of 65.2 GPa),and Pert distribution in Unit 5 (mean value of 6.15 GPa) were determined,and the best assigned distributions for the Poisson’s ratio data were Pert distribution (Units 3 and 5) and Beta General(Unit 4)distributions (Fig.9f-k).Table 11 presents the calculated mean and standard deviation based on the most fitted probability distribution function for every parameter in each rock unit.
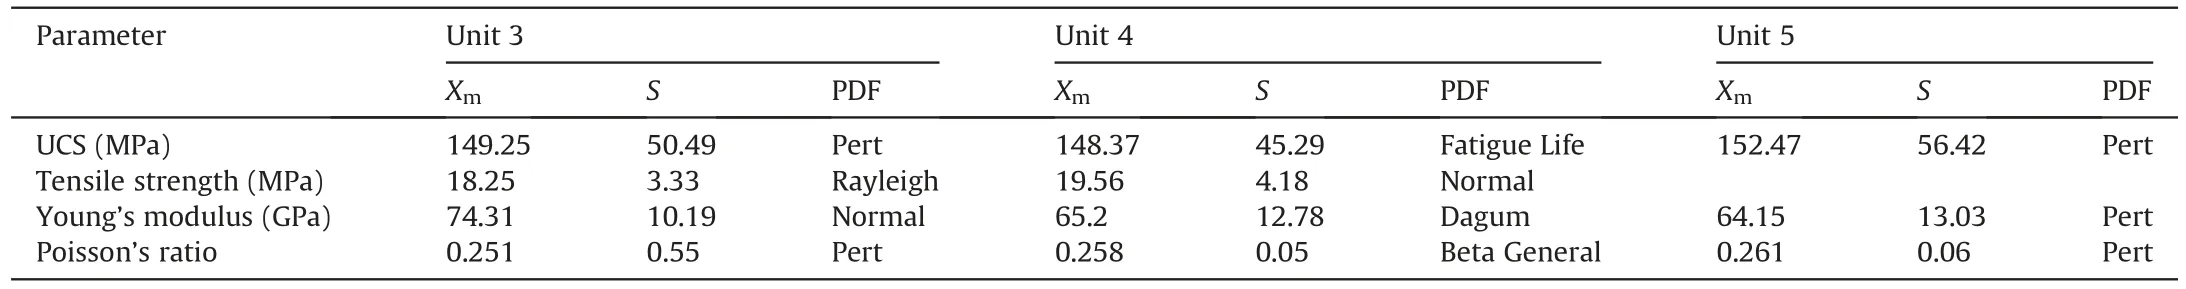
Table 11Most appropriate mean(Xm),standard deviation(S),and probability distribution function(PDF)computed for every geomechanical intact parameters in each rock unit at the Westwood Min.
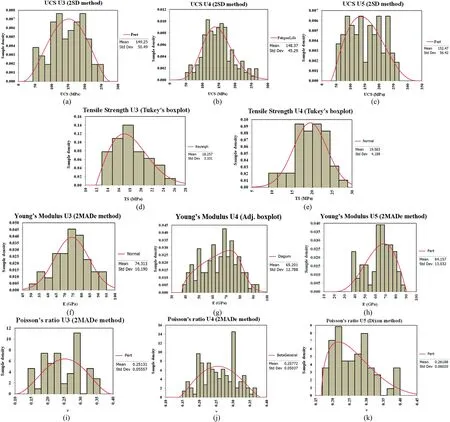
Fig.9.Best distribution assigned for the geomechanical parameters of intact rock.
Based on all statistical analyses conducted on the geomechanical intact data,the following conclusive points can be drawn:
(1) Considering that the intact rock properties significantly contribute to the occurrence of rockburst,analyzing the intrinsic uncertainties of geomechanical characteristics is a key step to predict rockburst in underground excavations,which was statistically analyzed in this paper.
(2) The main objective of applying various data treatment methods was to demonstrate the significant impact of every outlier method on the characterization of geomechanical intact parameters and the related uncertainties.Therefore,by selecting the most suitable data treatment technique for each parameter based on engineering judgements,the more fitted probability distribution function,which has not been focused in any geomechanical research,was assigned.
(3) Given that extracted intact rock samples are the group of specimens taken from the whole population of a rock,asuitable treatment process can assist the experts to estimate the mean and standard deviation of the sample to be closer to its population.
(4) Due to the various degrees of metamorphism,the geomechanical parameters of metamorphic intact rocks most likely show extreme variation,leading to the presence of several abnormal high or low values in the dataset,which need to be fully investigated to check whether these extreme values are statistical and physically acceptable or not.Therefore,the proposed statistical data treatment approach for each parameter considerably eliminated the uncertainties.
(5) Having comprehensively examined the uncertainties of geomechanical parameters through a rigorous statistical analysis,including outlier detection and determination of best-fitting PDFs,further investigation is essential to address the remaining uncertainties.While the statistical data treatment techniques have provided valuable insights into the characterization of geomechanical parameters,additional factors,such as schistosity angle and mineralogy,can significantly influence the associated uncertainties.Therefore,in order to gain a more comprehensive understanding of these uncertainties,the following sections focus to explore the impact of schistosity angle and conduct a detailed analysis of mineralogy.By integrating these aspects into our methodology,we aim to establish a more complete framework that accounts for the intrinsic variability of metamorphic rocks and provides a logical link between the variation in geomechanical parameters and the pertinent geological features.
5.Effects of schistosity and mineralogy on the geomechanical uncertainties
Despite treating the geomechanical laboratory data using the most appropriate outlier detection methods and assigning the most fitted probability distribution function,all geomechanical parameters were still greatly dispersed in different lithological units(Fig.9).In this step,only the uncertainties referred to the datasets of Units 3 and 4 are comprehensively analyzed because these units were more prone to rockburst phenomena at the Westwood mine.To analyze the associated uncertainties,the considerable impacts of the schistosity and the mineralogy will be evaluated.
5.1.Impact of schistosity angle on the dispersion of UCS dataset
The schistosity angle (β),which has a dominant effect on rock strength,should be primarily considered for the analysis of the dispersion of the UCS dataset in the aforementioned rock units.The schistosity angle (β) represents the angle between the schistosity plane and the direction of external forces or loading(Fig.10a).The significance of the schistosity angle lies in its impact on the structural characteristics,shear strength,and overall mechanical properties of rocks.A smaller angle causes a higher anisotropy,affecting the strength and deformability of the rock in relation to the orientation of applied stress,while a larger angle signifies stronger interlocking and enhanced resistance to deformation (Yin et al.,2021).Understanding the physical significance of schistosity angle is essential for assessing stability and designing structures in geotechnical engineering.

Fig.10.(a) The schematic illustration of schistosity angle,and (b) The schistosity range (highlighted) with the highest UCS variation (modified from Hoek,2007).
Several numerical and experimental studies have confirmed that the variation in rock strength is largely correlated to the angle between the schistosity plane and loading orientation,which needs to be considered in the analysis of the uncertainties (Zhang et al.,2011;Saeidi et al.,2013;Ali et al.,2014;Wang et al.,2022).However,the variation in the schistosity angle may not have a huge impact on other geomechanical parameters,as much as it affects the UCS variation.In this study,the schistosity angle of all tested core samples of Units 3 and 4 has been measured by observational approach.Fig.11 displays the schistosity angle of samples in both rock units against their respective UCS values.The schistosity values in both units fluctuate between 30°and 90°.According to the literature,the UCS values are not greatly influenced by the schistosity angle less than 30°or greater than 60°,whereas the highest dispersion can be expected for the rock strength,when the associated schistosity values are between 30°and 60°(Soufi et al.,2018;Koca and Kıncal,2022).This schistosity range which the UCS values shows the maximum dispersion can be called the variation range,as highlighted in Fig.10b.In addition,the schistosity planes have a key role in the failure mechanism of rock,particularly,when the schistosity angle ranges from 30°to 60°,and the weakness planes might dominate the failure behavior,thereby resulting in rock strength that cannot be a suitable representation of that rock type.
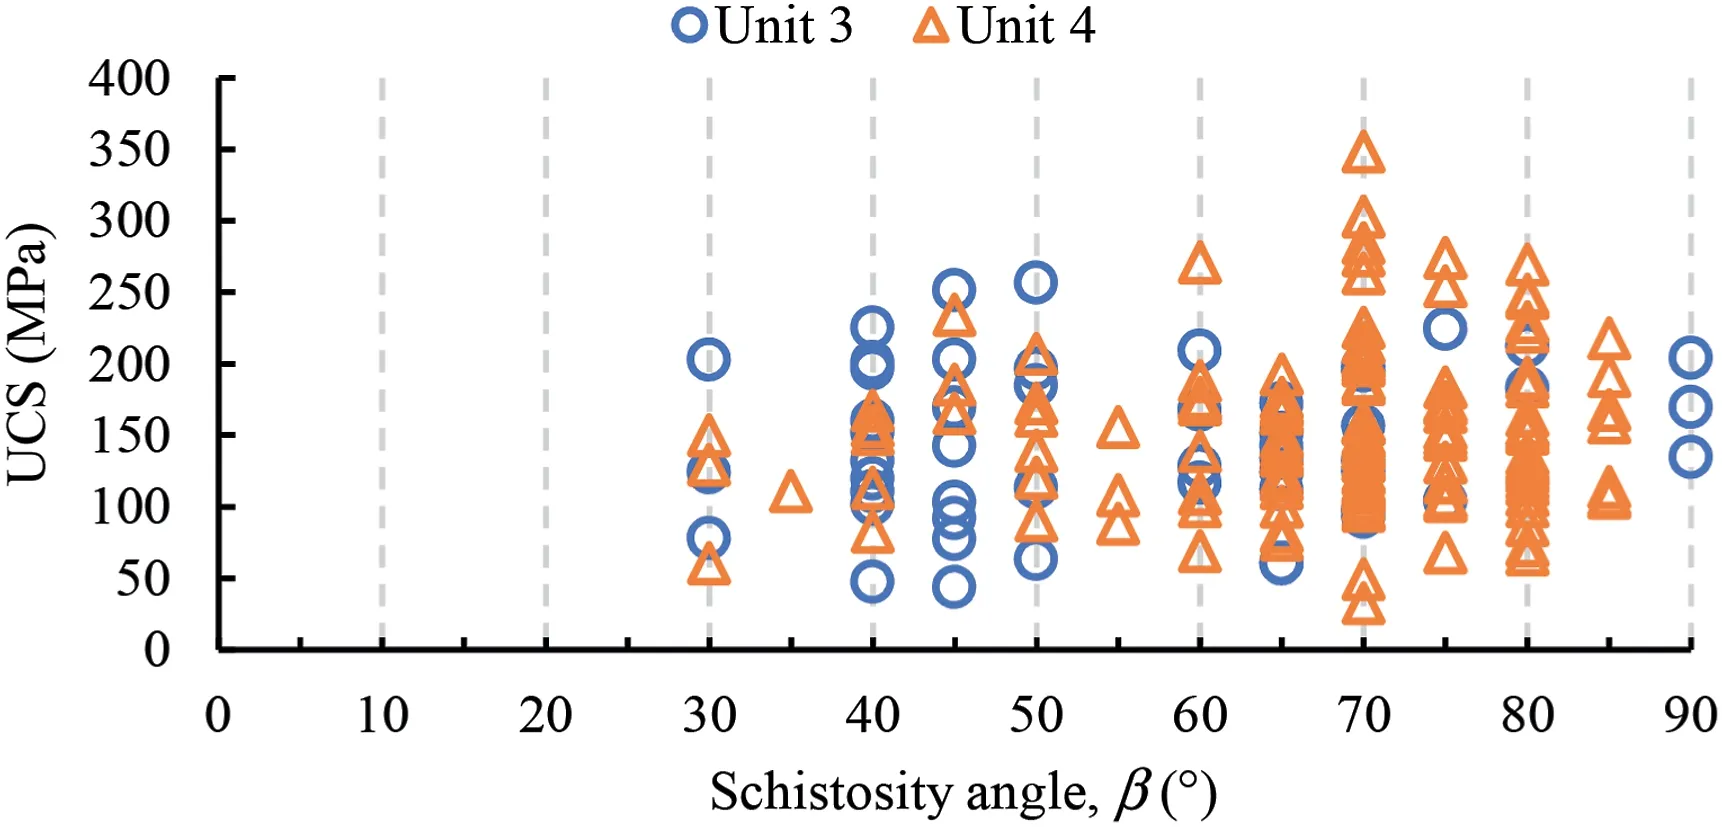
Fig.11.Schistosity angle of core specimens of Units 3 and 4 against UCS.
Consequently,by excluding the UCS values of the variation range(30°≤β ≤60°)from the remaining data,the related uncertainties can be greatly improved,and the negative impact of schistosity plane on the UCS variation is eliminated.Hence,to remove the effect of schistosity on the variation of UCS data of Units 3 and 4,the core samples within the variation range must be eliminated(Zhang et al.,2011;Wang et al.,2022).Fig.12 shows that the schistosity angle of many rock samples in Unit 3 are found in this range(30°≤β ≤60°),whereas most samples of Unit 4 data have a schistosity angle higher than 70°(Fig.12 a and b).Afterwards,the UCS variability was changed in the two studied unit,so that the standard deviation of the UCS data in Unit 3 is currently less than that of Unit 4(Table 12).Consequently,the associated uncertainties in the UCS dataset do not depend on the schistosity angle.
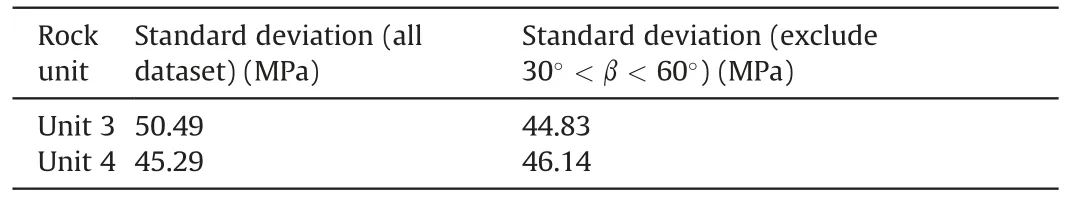
Table 12Standard deviations of the UCS dataset in Units 3 and 4 before and after excluding the shistosity range.
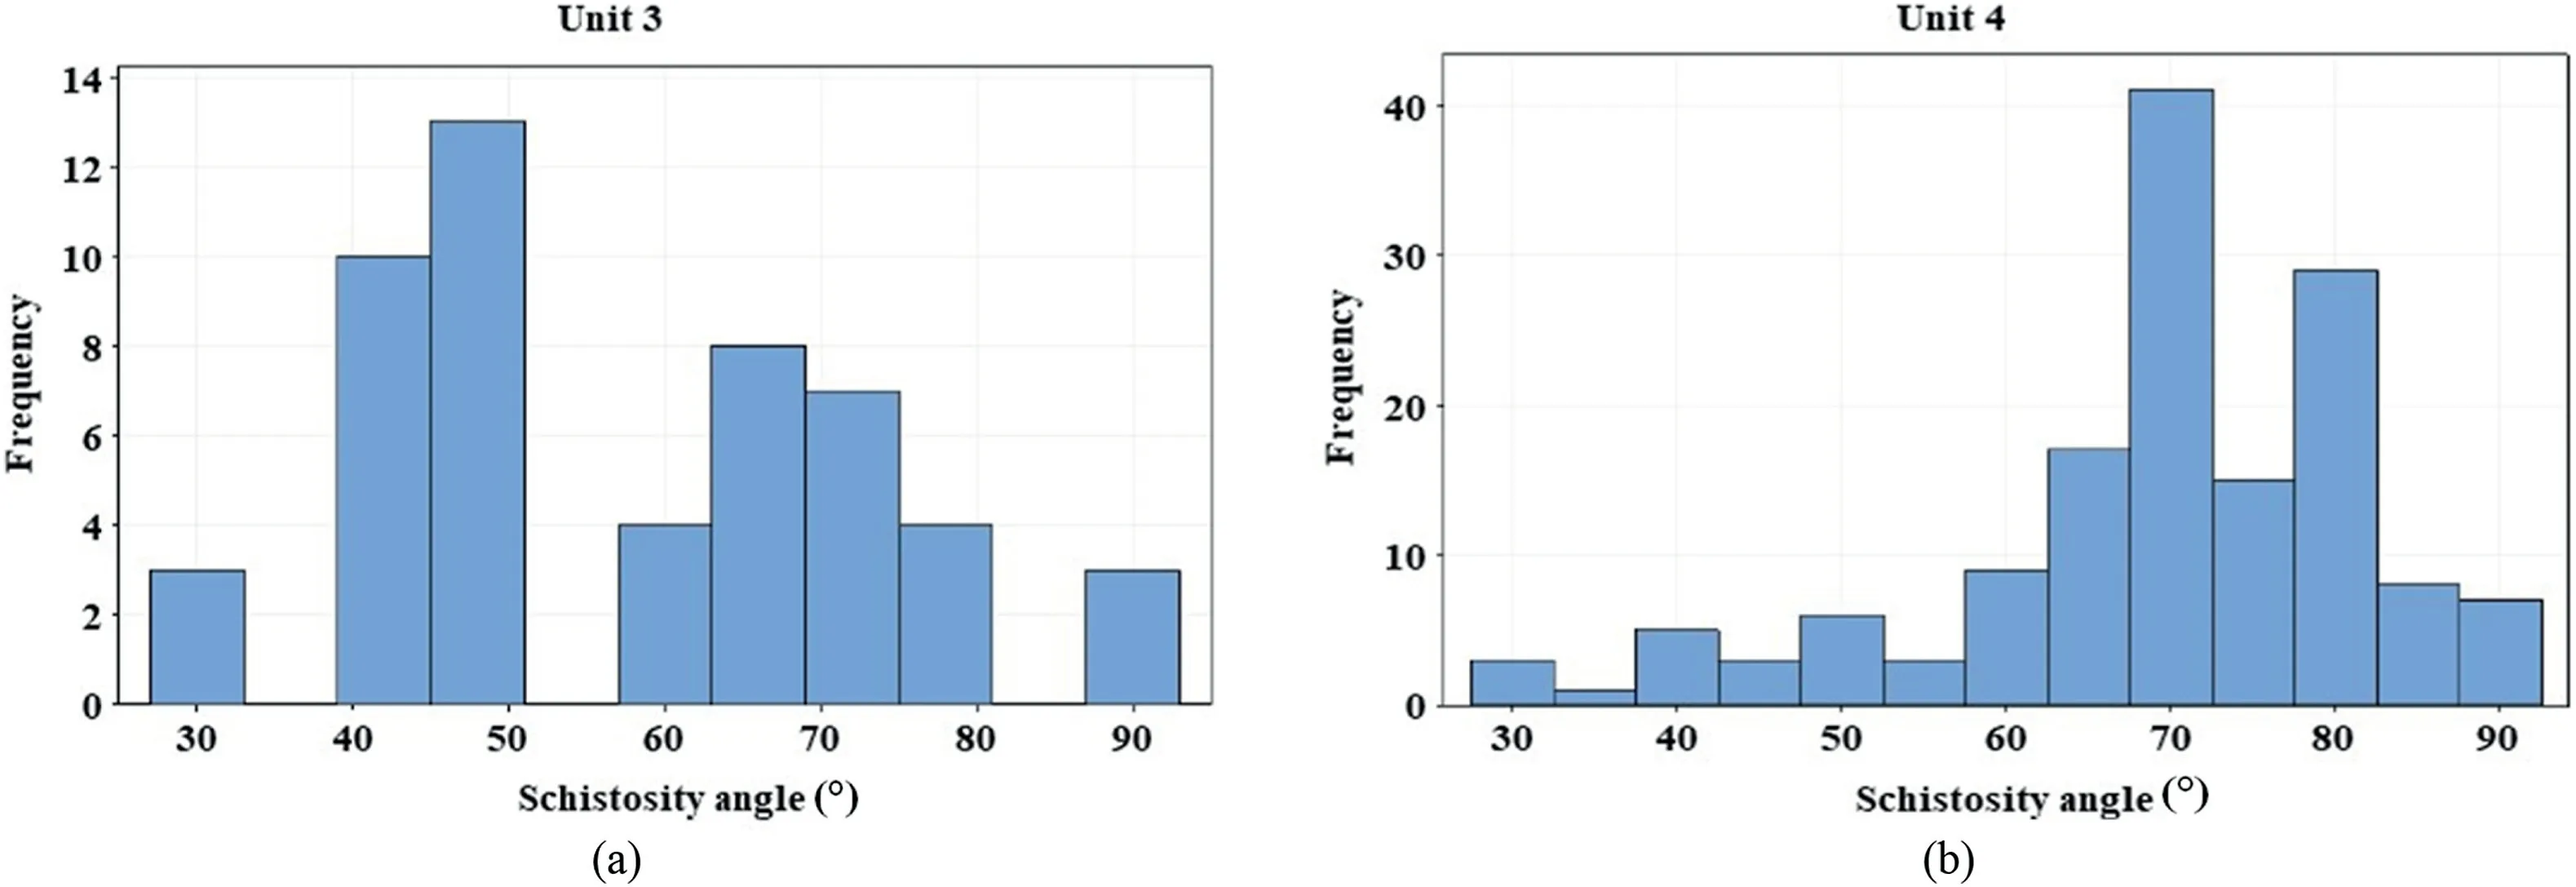
Fig.12.Distribution of core samples in terms of schistosity angle: (a) Unit 3,and (b) Unit 4.
5.2.Effect of mineralogy on the uncertainties of geomechanical parameters
A detailed laboratory investigation has been conducted to assess how different minerals impact the geomechanical parameters of intact rocks.The study primarily involved processing fieldcollected core samples and conducting a range of petrographic analyses,including lithogeochemical and isotopic analyses.These analyses played a crucial role in gaining insights into the mineralogical composition,petrographic textures,and hydrothermal alteration of the rocks around the Bousquet fault at the Westwood Mine,considering that these factors could impact the strength and deformability of rocks through several mechanisms (Goulet et al.,2022).
Hydrothermal alterations,for instance,can weaken rocks either by replacing strong minerals with weaker ones or through the dissolution of minerals,resulting in reduction of shear strength.Conversely,alteration process can strengthen rocks by precipitating cementing minerals,increasing cohesion and resistance to deformation (Del Potro and Hürlimann,2009;Julia et al.,2014).Furthermore,changes in mineral composition and structure during alteration process could also affect the mechanical properties of rock (Coutinho,2020;Mordensky et al.,2022).Additionally,alterations can create anisotropic conditions,causing directional variations in strength and deformability parameters of rock(Bidgoli and Jing,2014).
To demonstrate the role of mineral composition in variation of geomechanical parameters,a petrographic analysis was performed on the selected thin sections of rocks by means of X-ray diffraction(XRD) method at the University of Quebec in Chicoutimi.This analysis also provided a comprehensive mineralogical and textural description of the rocks,showcasing the significant effect of mineral composition in the dispersion of geomechanical data.A representative example of the petrographic characterization for Unit 3,located more than 30 m from the Bousquet fault,is shown in Fig.13a and b.The rock exhibits a banded texture with bands containing a fine-grained matrix rich in quartz-feldspars-chloritesericite-epidote,along with hornblende porphyroblasts.The analyses indicated that as the distance from the fault increases,the abundance of hornblende porphyroblasts gradually intensifies,suggesting a potential connection to the mineral assemblage and its effects on the mechanical properties of the rock (Bidgoli and Jing,2014).At a distance of 10-30 m from the fault,Unit 3 shows bands of cooler quartz-feldspar-sericite-chlorite-epidote,with some bands being richer in sericite and others in epidote which can have a considerable impact on the geomechanical parameters.The epidote content in these bands can reach up to 80% of the rock in certain places.In contrast,Unit 4,located at a distance of 40 m or more from the fault,does not show any signs of hydrothermal alteration (Fig.13c and d)).The samples consist of a very finegrained matrix predominantly composed of quartz,feldspar,and chlorite,with minor amounts of biotite,epidote,and sericite.
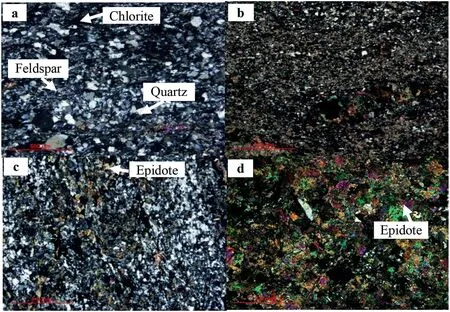
Fig.13.Sample of petrographic thin section images: (a,b) Unit 3,and (c,d) Unit 4.
After performing the XRD experiments,the predominant minerals are identified for each rock unit.As a result,a database that consists of 62 thin-section samples (25 samples in Unit 3 and 37 samples in Unit 4) was found.The XRD analysis results indicated that the main minerals in both lithological units (Units 3 and 4)were identical,but their proportion was considerably different.To investigate the influence of mineralogy on the intact rock strength and the deformability parameters in this study,the minerals are divided into two main groups: hard minerals (e.g.quartz,epidote,amphibole,plagioclase,pyrite,and magnetite) and soft minerals(e.g.feldspar,chlorite,sericite,muscovite,carbonate and biotite).All geomechanical intact data were measured for each thin-section rock sample,which also needs to be treated well before interpreting the XRD results and their effects on the related uncertainties.The treatment process was based on the best outlier method determined for every parameter earlier in this paper.To this end,the chosen best outlier method is applied to treat the data.Consequently,by treating the geomechanical data referred to the thin-section database,we have created four different thin-section datasets for each rock unit,as presented in Table 13.For instance,the adjusted boxplot method and the 2SD method were used to treat the respective UCS data of the thin-section samples,in which only one outlier was detected in data of Unit 3,whereas four outliers were identified in the corresponding dataset of Young’s modulus.Table 13 summarizes all the statistical analyses conducted on the hard and soft minerals along with the calculated mean and standard deviations for each unit,which can be utilized to evaluate the uncertainties of geomechanical parameters in terms of mineral variations.The mineralogy results demonstrated that the higher variation of the UCS data of Unit 4 compared with Unit 3 can be attributed to the dispersion of hard and soft mineral proportions because the standard deviation of Unit 4(19.7)was greater than that of Unit 3(18.4),which is in agreement with the resulted uncertainties of the UCS dataset(Tables 12 and 13).The dispersion of hard and soft minerals related to both units are represented in Fig.14.Nonetheless,no reasonable relationship could be anticipated between soft and hard minerals in both rock units because the UCS values vary (Fig.15).
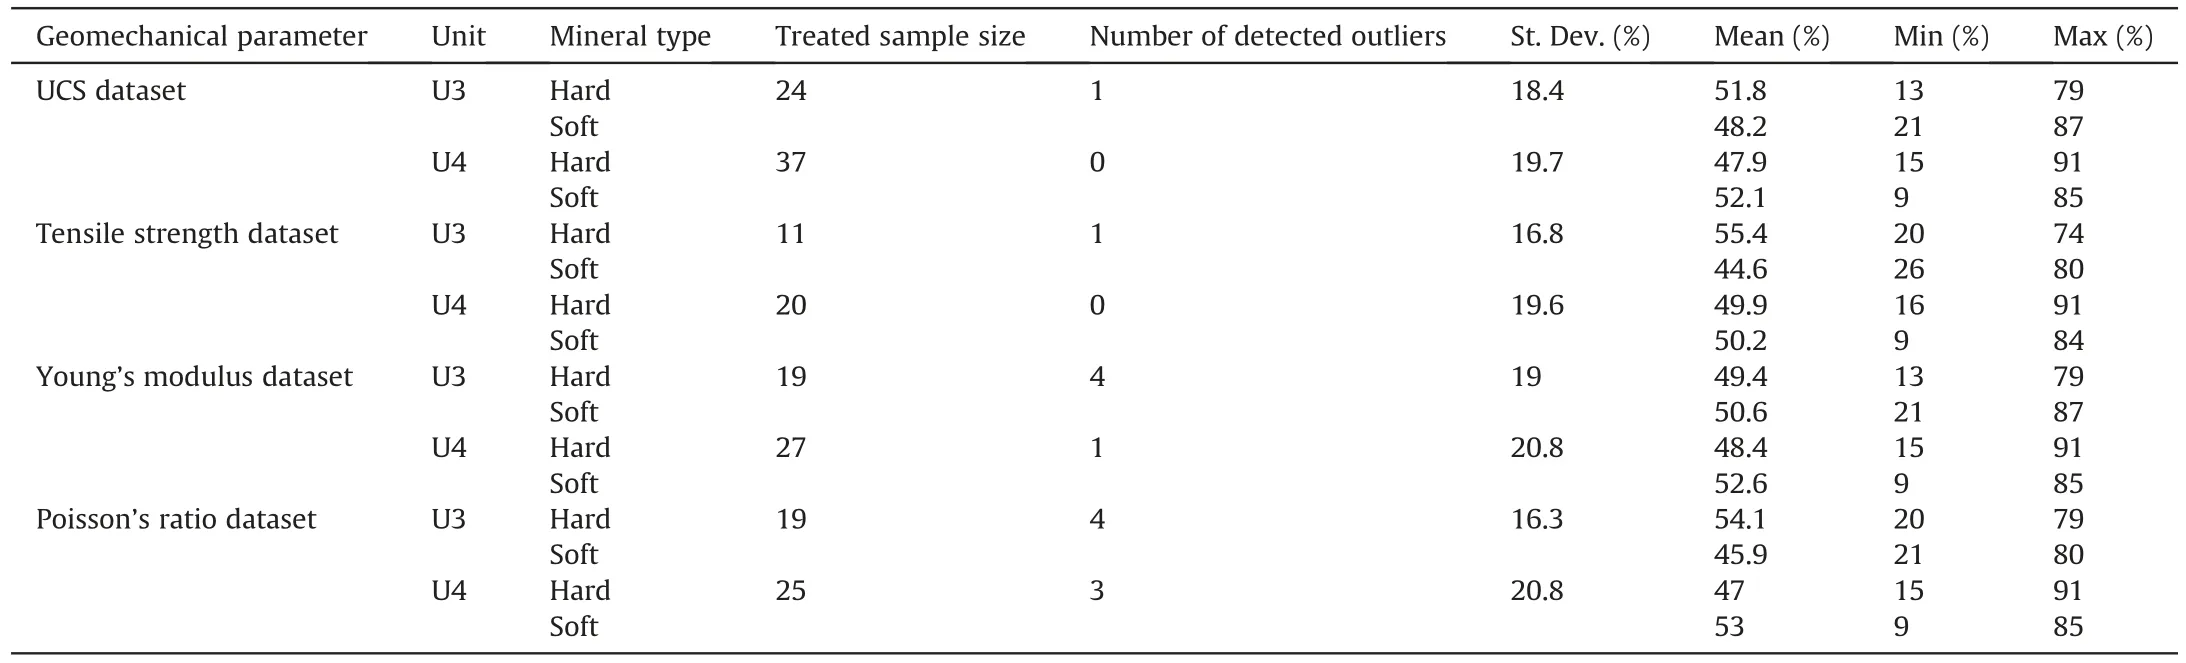
Table 13Mean and standard deviation of hard and soft minerals’ proportion referred to Units 3 and 4.
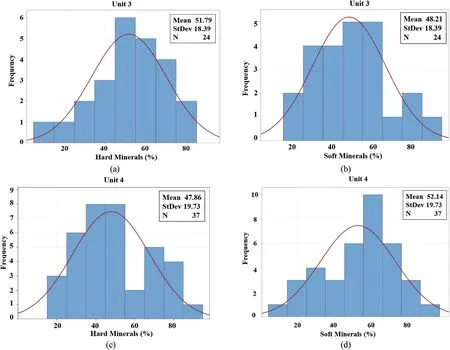
Fig.14.Dispersion of hard and soft minerals: (a,b) Unit 3,and (c,d) Unit 4 referred to samples with the UCS data.
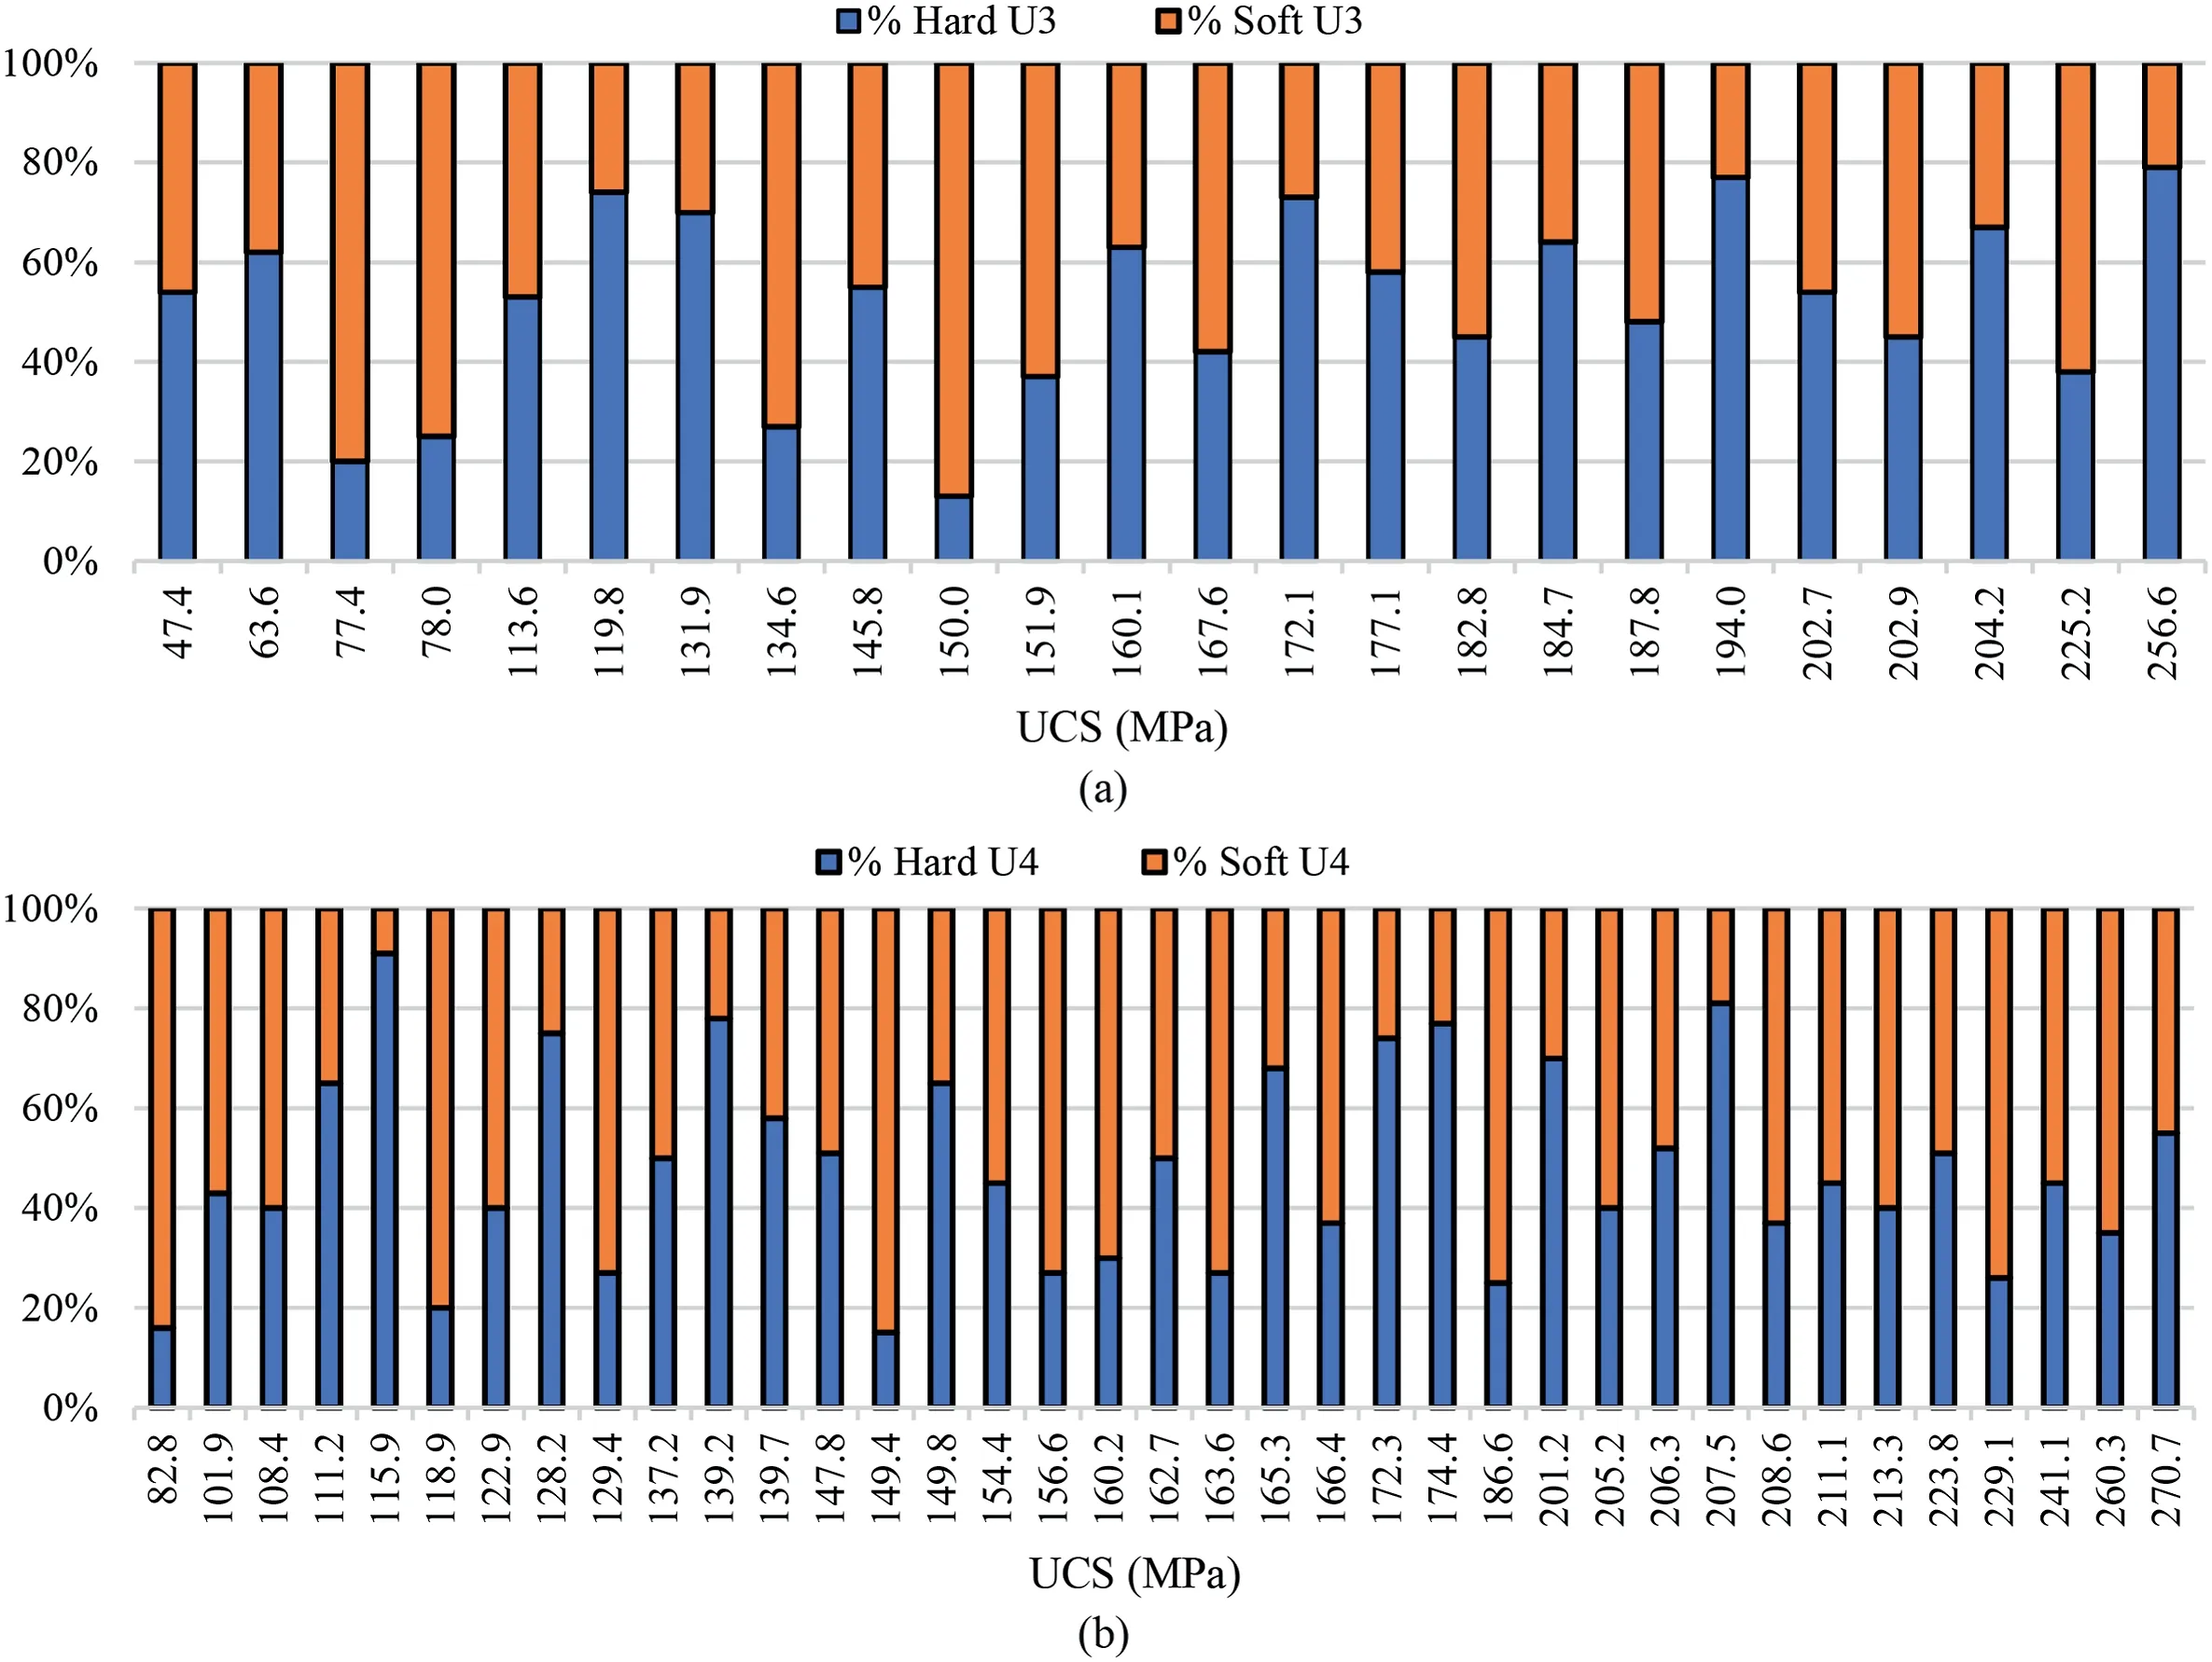
Fig.15.Proportion of hard and soft minerals based on the UCS value: (a) Unit 3,and (b) Unit 4.
With regard to the tensile strength dataset,the uncertainties of both rock units may be fairly explained using the mineralogy analysis(Table 12).To this end,by analyzing the mineral proportion of 31 rock samples and their tensile strength values,the variability of hard and soft minerals in Unit 4(St.Dev.=19.6%)was greater as compared with Unit 3(St.Dev.=16.8%),thereby verifying the more scattered data in Unit 4 (4.18) rather than that of Unit 3 (3.33),as illustrated in Fig.9d and e.Moreover,the uncertainties of the Young’s modulus data sound reasonable because the standard deviation of mineral proportions (either hard or soft) referred to in Unit 4 was greater than that of Unit 3 (Table 13).However,thescatteredness in the Poisson’s ratio data might not be justified with the help of mineralogy analysis,although it should be mentioned that the uncertainties resulted in Units 3 and 4 were so close to each other.Also,no clear trend was observed between the percentage of hard and soft minerals when geomechanical parameters were fluctuated.
6.Discussion
The characterization of geomechanical intact parameters would surely demand an appropriate methodology to analyze the uncertainties in three domains and eliminate any outliers from the raw laboratory data because of the huge natural variabilities of metamorphic rocks related to the degrees of metamorphism.
In the first part,the laboratory results of metamorphic rocks were thoroughly analyzed using 17 data treatment techniques,thereby leading to the selection of the best outlier method for every parameter based on engineering judgment.Among the applied methods,the commonly known treatment method,which is Tukey’s 1.5IQR rule,detected some extra outliers,particularly in the UCS data of Unit 4.Meanwhile,the 3IQR rule was too conservative in the detection of outliers despite the extreme values within the datasets.Only Gignac’s 2.2IQR should be mentioned as a reasonable outlier method rather than the Tukey’s boxplot.Also,the sequential fence method could not be considered a strong method because it has limitations in large datasets (e.g.Unit 4).In general,the best outlier method should address the skewness of the data better because of a high possibility for the raw geomechanical data to be skewed.The only method that considers skewness was the adjusted boxplot method,which was selected as the best outlier method for the UCS and Young’s modulus data.In terms of testbased methods,only Dixon’s test (truncated means approach)was selected as a better method to detect the outliers in the Poisson’s ratio dataset,although this outlier test still had too liberal approach compared with other data.Furthermore,Peirce,Doerffel,and Grubbs tests almost did not detect the outliers in datasets because of the ultra-conservative approach or inapplicability in large datasets.Also,Z-score and its modified method were unsuccessful in labeling any outliers in most datasets.However,the 2SD and the 2MADe methods are specified as the most suitable outlier techniques for the UCS and deformability parameters data,respectively.Subsequently,the statistical goodness-of-fit tests showed that the Pert distribution had the best fit with the UCS data(Units 3 and 5),Young’s modulus data(Unit 5),and Poisson’s ratio data(Units 3 and 5),whereas the normal distribution function was specified as the most appropriate fit model for tensile strength data(Unit 4) and Young’s modulus data(Unit 3).
In the second part of the methodology,the remaining uncertainties were assessed by focusing on the schistosity angle of metamorphic rocks.When the angle between the schistosity plane and the loading direction was observed between 30°and 60°,the UCS dataset showed the highest variation,and by excluding the related data from the UCS dataset,the effect of schistosity on the high uncertainties of the UCS data can be highly mitigated.
In the third part of the methodology,a complete petrographic investigation was performed on the chosen thin-section rock samples to highlight the function of minerals in the related variabilities of geomechanical intact parameters.To evaluate the impact of mineralogy on intact rock strength and deformability parameters,the minerals were grouped as hard and soft minerals.The petrographic analyses confirmed that the variation of hard and soft mineral proportions in Unit 4 was higher than that of Unit 3,thereby conforming to the uncertainties of the UCS,tensile strength,and Young’s modulus in both units.However,the related uncertainties of the Poisson’s ratio data could not be explained by mineralogy analysis,despite the similarities in the uncertainties in Units 3 and 4.
7.Conclusions
In this paper,a suitable methodology was developed to analyze the uncertainties of metamorphic intact rocks.Considering that the geomechanical intact parameters have a crucial role in the occurrences of rockburst,evaluating the inherent uncertainties of geomechanical parameters is a critical step in predicting rockburst in underground openings.Several important conclusions are summarized as follows:
(1) The methodology presented the best data treatment technique for every geomechanical intact parameter in each rock unit.
(2) Engineering judgment has a significant role in selecting the best data treatment method because this process must also follow the rock mechanics principles.Tukey’s boxplot,as the most common data treatment method in many geomechanical studies,were unable to identify the true outliers in most data because the suggested interval values and the number of detected outliers were unacceptable in terms of engineering judgement.Meanwhile,the adjusted boxplot method,as the only method that considers the skewness of the data,is recommended as the best alternative for traditional boxplots because they provide more precise CIs.
(3) The test-based outlier methods almost failed to investigate the uncertainties of metamorphic rocks.Doerffel’s test cannot be a proper method to treat the geomechanical laboratory data because this test cannot label the outliers in the lower threshold of the dataset.
(4) In contrast to normality assumption for the geomechanical data in many studies,the results showed better fit models.
(5) The dominant influence of schistosity planes in metamorphic rocks played a significant role in the uncertainties of UCS data,which greatly varied in specific schistosity ranges.
(6) The mineralogy results showed that the variation of mineral proportions had a crucial effect on the uncertainties of intact laboratory data.However,as the geomechanical parameters change,no logical pattern between the variation of soft and hard minerals in both rock units could be expected.
Declaration of competing interest
The authors declare that they have no known competing financial interests or personal relationships that could have appeared to influence the work reported in this paper.
Acknowledgments
The authors would like to thank the Natural Sciences and Engineering Research Council of Canada (NSERC),IAMGOLD Corporation,and Westwood mine for supporting and funding this research (Grant No.RDCPJ 520428-17) and also NSERC discovery funding (Grant No.RGPIN-2019-06693).We also acknowledge Westwood mine engineers (Mr.Patrick Ferland,Mr.Maxime Martel,and Mrs.Karolan Tremblay) for their support with this study,and the assistance of Dr.Patrick Mercier Langevin from the Geological Survey of Canada in evaluating the mineralogy section.
Appendix A.Supplementary data
Supplementary data to this article can be found online at https://doi.org/10.1016/j.jrmge.2023.09.011.
List of symbols
XmMean
SStandard deviation
nSample size
α Probability
β Schistosity angle
IQRInterquartile range
Q1First quartile
Q2Second quartile or median
Q3Third quartiles
PDFProbability distribution function
dfDegree of freedom
tStudent’st-distribution
MCMedcouple
MiModifiedZ-score
σtTensile strength
EYoung’s modulus
ν Poisson’s ratio
 Journal of Rock Mechanics and Geotechnical Engineering2024年2期
- Journal of Rock Mechanics and Geotechnical Engineering的其它文章
- Evaluation of excavation damaged zones (EDZs) in Horonobe Underground Research Laboratory (URL)
- On the calibration of a shear stress criterion for rock joints to represent the full stress-strain profile
- Effect of dynamic loading orientation on fracture properties of surrounding rocks in twin tunnels
- Experimental study on the influences of cutter geometry and material on scraper wear during shield TBM tunnelling in abrasive sandy ground
- Effect of fracture fluid flowback on shale microfractures using CT scanning
- Mechanical behaviour of fiber-reinforced grout in rock bolt reinforcement