
Evaluation of excavation damaged zones (EDZs) in Horonobe Underground Research Laboratory (URL)
2024-02-29 14:47KojiHataSumioNiunoyaKazuheiAoyagiNoukatsuMiyara
Koji Hata ,Sumio Niunoya ,Kazuhei Aoyagi ,Noukatsu Miyara
a Obayashi Corporation,Technology Research Institute,Technology Division,Kiyose,Tokyo,204-8558,Japan
b Obayashi Corporation,Nuclear Facilities Division,Sinagawa,Tokyo,108-8502,Japan
c Japan Atomic Energy Agency,Horonobe Underground Research Center,Horonobe,Hokkaido,098-3224,Japan
Keywords:Excavation damaged zone (EDZ)Optical sensor Long-term monitoring Acoustic emission (AE)Shaft sinking
ABSTRACT Excavation of underground caverns,such as mountain tunnels and energy-storage caverns,may cause the damages to the surrounding rock as a result of the stress redistribution.In this influenced zone,new cracks and discontinuities are created or propagate in the rock mass.Therefore,it is effective to measure and evaluate the acoustic emission(AE)events generated by the rocks,which is a small elastic vibration,and permeability change.The authors have developed a long-term measurement device that incorporates an optical AE (O-AE) sensor,an optical pore pressure sensor,and an optical temperature sensor in a single multi-optical measurement probe (MOP).Japan Atomic Energy Agency has been conducting R&D activities to enhance the reliability of high-level radioactive waste (HLW) deep geological disposal technology.In a high-level radioactive disposal project,one of the challenges is the development of methods for long-term monitoring of rock mass behavior.Therefore,in January 2014,the long-term measurements of the hydro-mechanical behavior of the rock mass were launched using the developed MOP in the vicinity of 350 m below the surface at the Horonobe Underground Research Center.The measurement results show that AEs occur frequently up to 1.5 m from the wall during excavation.In addition,hydraulic conductivity increased by 2-4 orders of magnitude.Elastoplastic analysis revealed that the hydraulic behavior of the rock mass affected the pore pressure fluctuations and caused micro-fractures.Based on this,a conceptual model is developed to represent the excavation damaged zone (EDZ),which contributes to the safe geological disposal of radioactive waste.
1.Introduction
The mountain tunneling method in Japan is generally based on the new Austrian tunneling method proposed by Rabcewicz(1964,1965).In this method,shotcrete is placed on the excavation wall immediately after the rock excavation,followed by the placement of rock bolts radially from the rock wall.This process maximizes the use of the natural resistance of the rock mass because of the close contact between the support and the bedrock wall.Steel shoring may be added when the rock mass is heterogeneous or vulnerable due to significant weathering and alteration.In large underground caverns for energy storage,pre-stressed anchors are used instead of rock bolts.In the geological disposal of high-level radioactive waste(HLW)(Japan Nuclear Cycle Development Institute,2000;Johnson et al.,2002;NUMO,2021),shafts and horizontal tunnels are constructed using the new Austrian tunneling method.However,to prevent radionuclide migration,it is important to minimize the damage induced by excavation and control the mechanical deformation and groundwater inflow through fractures.
Excavation of mountain tunnels and underground caverns causes excavation damaged zone (EDZ) in hard and soft rocks around the caverns.Tsang et al.(2005) proposed a geohydromechanical processes process for EDZ evaluation for crystalline rock,salt,indurated clay and plastic clay.Perras and Diederichs (2016) proposed a conceptual model of EDZ for sedimentary rocks.Hudson et al.(2008)focused on the EDZ of HLW in crystalline rock.In specific HLW research facilities,the Canadian Underground Research Laboratory (URL) by Young and Collins(2001) is on granodiorite.Shao et al.(2008),Baechler et al.(2011),and Armand et al.(2014) studied clay in the Meuse/Haute-Marne URL in France.Bossart et al.(2002,2004)investigated the mudstone(Opalinus clay)at the Mont Terri Rock Laboratory in Switzerland.
The rock mass contains cracks and discontinuities from the micro-region of the grain boundaries to the macro-region of the formation structure.Therefore,the EDZ contains damaged portions caused by the instantaneous response to blasting and by the stress redistribution.Acoustic emission(AE)is a technique for monitoring the movement of cracks and discontinuities from the micro-to macro-regions.Hardy (1981) described the theory of AE and presented examples of its application.Most conventional measurement methods of stress,displacement,and strain are onedimensional (1D) and cannot be accurately evaluated unless they are performed in the immediate vicinity of the measurement point.To compensate for this disadvantage,an AE method that uses elastic or ultrasonic waves transmitted through the target medium as the measurement target can be evaluated in two or three dimensions.Udd (1995) demonstrated its application to smart structures,and it is expected to be extremely useful for nondestructive testing(ISO/TC 135/SC 9,2009).
Previous studies(e.g.Aoki et al.,1989;Ishida et al.,1992;Talebi and Young,1992;Inaba et al.,1993;Hata et al.,1998,2002,2010;Read,2004) have shown that AE is effective in determining the state and extent of rock damage in hard rock masses such as crystalline rocks.Young and Collins (2001) applied microseismic and AE to EDZ evaluation around full-scale shielding plugs in HLW.In addition to AE measurements,the EDZ has been analyzed by hydraulic tests (Sugihara et al.,2000;Sanada et al.,2012),seismic surveys (Balland et al.,2009),strain measurement and numerical analysis (Yoshioka et al.,1993;Aoyagi et al.,2016),as well as statistical treatment of fractures based on geological observations(Tokiwa et al.,2018).However,few studies have conducted AE measurements in sedimentary soft rocks such as the Neogene sedimentary bedrock.Furthermore,although many EDZ evaluations have been performed for horizontal tunnels,few have been performed for vertical shafts.Therefore,the authors have focused on EDZ evaluation in sedimentary rocks using optical sensors,and remarkable progress has been achieved.The research targets were the shafts of the Horonobe URL (Nakayama et al.,2020),operated by the Japan Atomic Energy Agency.
In this paper,the characteristics of a newly developed optical AE(O-AE) sensor and the results of in situ measurements using the sensor during excavation of the shaft are presented.Based on the theoretical interpretation of the obtained data,a conceptual model is proposed to visualize the hydro-mechanical behaviors of the EDZs around the shaft.The results of this study will contribute to the assessment of facility design and efficient planning of countermeasures,such as excavation of disposal tunnels in geological disposal projects.
2.Development of O-AE for rock mass
In recent years,fiber-optic sensors have been widely used to measure the stress,displacement,strain,and temperature.The development and application of fiber-optic sensors have been described by Hocker (1979) and Udd (1995).Compared with conventional electrical sensors,fiber-optic sensors have advantages such as no requirement of power supply,high insulation,corrosion resistance,long life,and light weight.
Fiber-optic measurements can be classified into point sensing,multiplexed point sensing,and integrated sensing.Fiber Bragg grating is a typical method used for point sensing and multiplexed point sensing.On the other hand,a typical example of integrating sensing is the optical time-domain reflectometer.Various shapes of fiber-optic sensors have been proposed,including linear,loop,and coiled shapes (Jackson et al.,1980;Bucaro et al.,1982;Giallorenzi et al.,1982).Homodyne (Dandridge et al.,1982),heterodyne,and synthetic heterodyne methods (Cole et al.,1982) have also been proposed for signal detection.
Other measurement techniques include acoustic surveys,such as seismic and ultrasonic tests.Examples of acoustic measurements can be found in the studies by Bucaro and Hickman (1979) and Bucaro et al.(1979,1982).Examples of hydrophone measurements have been demonstrated by Bucaro et al.(1977)and Jarzynski et al.(1981).Kageyama et al.(2003,2006) developed a new fiber-optic vibration sensor using the “Doppler effect of light propagating in a curved waveguide”.This sensor is based on the discovery that the frequency of light propagating through an optical fiber varies with the vertical displacement velocity component in the curved portion of the optical fiber.In other words,the Doppler effect also exists in light.Sensors based on this scenario do not belong to any of the conventional optical fiber sensing categories.
On the basis of this principle,Kageyama et al.(2003)developed a first-generation O-AE(see Fig.1a).The results of the tensile tests on bonded steel plates showed that the sensor could be applied as an AE sensor.Fujii et al.(2009) developed an improved secondgeneration O-AE (see Fig.1b).Laboratory rock tests showed that the developed cylindrical O-AE achieved satisfactory performance with a dominant frequency of 150 kHz,which is comparable to that of conventional piezoelectric AE(P-AE)sensors.Further,the results of in situ rock AE measurements conducted by Hata et al.(1998,2002)indicate that an AE sensor between 20 kHz and 90 kHz(with a dominant frequency of 30 kHz) is the most suitable for AE measurements of rock masses.

Fig.1.O-AE development by generation: (a) The first-generation has an outer diameter of 15 mm,inner diameter of 10 mm,and optical fiber wound 10 times;(b) The second-generation is stacked in a cylindrical shape with an outer diameter of 30 mm and thickness of 2 mm to improve the sensitivity;and (c) The third-generation is stacked in an oval shape and is 26-mm long,15-mm high,15-mm thick,and the fiber length is 65 m.
O-AE exhibits a vibration that is unique to its geometry.Therefore,an eigenvalue vibration analysis was first performed to evaluate the geometry and vibration characteristics.The six compared shapes are shown in the upper part of Fig.2.The results of the frequency response analysis for various shapes are also shown in Fig.2.Among the sensor shapes,the cylindrical type(A)and conical types (E) and (F) had peaks in the high-frequency range above 50 kHz and were therefore considered unsuitable for in situ use.Oval type(C)exhibited a peak at approximately 15 kHz.In contrast,the peaks of cylindrical type (B) and oval type (D) were obtained near 10 kHz.Peculiar frequency response characteristics with peaks at multiple locations in the higher frequency range were also observed.These characteristic peak frequencies were due to the deformation modes.Therefore,it is clear that the peak frequency can be controlled by attaching a restraint.Thus,the oval type (D)sensor had a lower frequency and higher sensitivity that met the requirements of in situ measurement.Based on the above studies,a third-generation O-AE dedicated to in situ use was developed,as shown in Fig.1c.An epoxy resin restraint to control the peak frequency was attached to the bottom of the wave-receiving surface(O-AE).The third-generation O-AE was stacked in an oval shape and was 26-mm long,15-mm high,and 15-mm thick,with a fiber length of 65 m.However,it is difficult to confirm the effect of the restraints attached to the wave-receiving surface and the actual sensitivity characteristics using numerical analysis.Therefore,a face-to-face test was used to verify the sensitivity.The output sensitivity of the sensor to the input was examined by placing the oscillation sensor and vibration-receiving sensor in direct contact.A P-AE with a predominant frequency of 30 kHz and proven effectiveness in situ AE measurement was used as the oscillation sensor,and the frequency of the constant-amplitude sine wave was varied using a function generator.For comparison,the P-AE was also subjected to a sensitivity test.

Fig.2.Frequency response analysis results for different sensor geometries.Six types of O-AE were established based on the second-generation O-AE shown in Fig.1b.The cylindrical and oval types are horizontal and vertical,respectively.The lower side of each sensor is the receiving and sensing side of the AE signal wave.For in situ AE measurements in a rock mass,sensitivity characteristics are desired on the lower frequency side.
The results of the face-to-face tests are shown in Fig.3.The solid black and red lines in the figure show the sensitivity characteristics of the cylindrical O-AE(B)and oval O-AE(D).The black dotted lines show the sensitivity characteristics of the 30 kHz P-AE.It was found that the oval type has better sensitivity characteristics below 50 kHz than the cylindrical type.The O-AE not only has comparable sensitivity characteristics but also is more sensitive than the P-AE in the frequency range of 50 kHz-80 kHz.Based on the above results,the O-AE sensor was considered to have the same or better performance than the conventional P-AE.

Fig.3.Sensitivity results from face-to-face testing.Comparison of cylindrical type (B)and oval type (D),which have excellent sensitivity characteristics on the lowfrequency side;Oval type (D) has better sensitivity characteristics.(This sensitivity characteristic is equal to or better than that of the 30 kHz P-AE,which has a proven in situ sensitivity characteristic.)
3.Development of O-AE for rock mass
The studied site is the Horonobe URL (Nakayama et al.,2020),located in Hokkaido,Japan.The Japan Atomic Energy Agency has been conducting research and development activities at the offsite Horonobe URL in northern Hokkaido,Japan,to enhance the reliability of HLW deep geological disposal technologies in sedimentary rocks.The three-dimensional (3D) layout of the underground facilities is shown in Fig.4.As of February 2022,excavation of the 350 m gallery was completed,the east and ventilation shafts were excavated to a depth of 380 m,and the west shaft to a depth of 365 m.

Fig.4.Outline of underground facilities at the Horonobe URL and 350 m galleries (Nakayama et al.,2020).Three access shafts have been constructed at this site.Research and development related to HLW have been conducted in each of the east and west access shafts and 350 m galleries.
Research and development encompass a wide range of activities,including the establishment of a model of the hydromechanical behaviors of the rock mass around a cavern.The purpose of this study was to evaluate the EDZ after excavation of a cavern and to develop a conceptual model of the EDZ.
3.1.Excavation method
The area is approximately 350 m below the east shaft,as shown in Fig.4,which is the target of the measurements.The diameter of the east access shaft is 7.3 m.The east access shaft,which was deeper than 350 m,was excavated mechanically using an excavator.The main support components of the shaft were a concrete lining with a design roll thickness of 400 mm and steel supports.Therefore,the inside diameter of the east access shaft is 6.5 m.The east and west access shafts have the same inner diameter,and the ventilation shaft has an inner diameter of 4.5 m.The planar layout is 70 m between shaft centers,with each cavern center at the apex of an equilateral triangle.The machine used for excavation was the free-section drilling rig,which was attached to the end of a work platform called a scafford to excavate the bedrock.The excavated small pieces of rock were loaded into kibble by loading device called the shaft mucker and transported to the surface.A short-step method was applied as the construction method.The starting condition was the construction of the lining concrete 1 m above the bottom of the shaft.First,excavation was performed to a depth of 1 m from the initial condition and a steel support was erected at a distance of 1.5 m from the bottom.Subsequently,another 1 m was excavated,steel supports were erected at a distance of 1.5 m from the bottom in the same manner,and a concrete lining was constructed with a casting length of 2 m.The shaft was constructed by repeating this process (Aoyagi et al.,2019).
3.2.Geological conditions at EDZs (measurement sites)
The rock mass distributed at the measurement depth is siliceous mudstone (the Wakkanai formation) of the Neogene age.Its physical properties are shown in Table 1 (Aoyagi and Ishii,2019).The rock properties were obtained from laboratory tests using rock samples obtained from boreholes drilled in 350-m galleries.The physical properties in the table are the averages of the values obtained from ten rock specimens obtained in 350-m depth.In addition to the laboratory tests,surface based investigations by Ota et al.(2007),in situ stress measurement in the URL (Aoyagi et al.,2013),and in situ direct deformation and shear tests by Niunoya et al.(2016) were also conducted.In summary,the stress state around the URL is that a maximum horizontal stress was approximately 7.3 MPa and a minimum horizontal stress was approximately 5.1 MPa,with the direction of the maximum initial stress being in east-west direction (Ota et al.,2007;Aoyagi et al.,2017).The permeability of the no-fractured rock section was approximately 10-10m/s to 10-11m/s (Aoyagi et al.,2019).The groundwater level around the underground facility decreased owing to the excavation.However,in a borehole approximately 135 m away from the east shaft,the groundwater level was confirmed to be almost hydrostatic at a depth of approximately 350-380 m(Yoshino et al.,2015).The water inflow rate in the 350 m gallery was approximately 70 m3/d during the maintenance phase when the tunnel excavation was completed.In addition,flammable gases were dissolved in the groundwater and released by degassing during rock excavation and borehole drilling.

Table 1Mechanical physical properties of siliceous mudstone(Aoyagi and Ishii,2019).These rock mechanical and geophysical properties were calculated as the average values from ten rock tests.
3.3.Practical long-term monitoring and measurement equipment
An O-AE,optical pore pressure (O-PP) sensor,and optical temperature (O-T) sensor were applied to the EDZ measurements.Table 2 lists the specifications and features of various optical sensors.Fabry-Perot optical sensors were used for the O-PP and O-T.The Fabry-Perot scheme consists of two parallel mirrors separated by a cavity in an optical fiber.Changes in the cavity spacing due to external pressure or temperature changes cause frequency modulation of the light reflected from the mirror.Hariharan (1991)showed that the pressure and temperature could be evaluated by measuring this frequency modulation.

Table 2Specifications and features of optical sensors.The detection method of each optical sensor is shown.Specifications of each optical sensor,such as signal transmission distance,measurement range,accuracy,and resolution,are shown.
In the measurement of mountain tunnels,a measurement device is generally buried in a borehole,regardless of whether it is an electrical or non-electrical device.However,when measurements are taken for HLW geological disposal,the borehole itself is exposed to the risk of radionuclide migration.Therefore,three types of optical sensors were incorporated into a single measurement probe to minimize the number of measurement boreholes and disturbing effects of the borehole on the stress and strain in the rock mass.This measurement probe is referred to as the multi-optical measurement probe (MOP;see Fig.5).
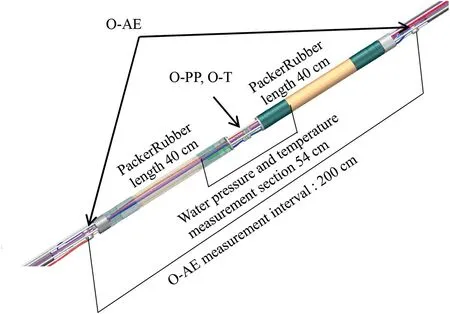
Fig.5.Illustration of MOP.O-AE,O-PP,and O-T are incorporated.This combination can be used at multiple stages to extend the measurement area in axial direction of the device.
3.4.Elastic wave attenuation characteristics at the measurement site
In AE measurements,it is important to understand the elastic wave propagation characteristics of the measurement target,i.e.the distance attenuation characteristics of elastic waves.In particular,in porous materials such as sedimentary rock,the received AE signal waves are strongly affected by distance attenuation.An understanding of the attenuation characteristics enables selection of the monitoring range and determination of the suitability of the acquired data.In other words,a higher predominant frequency of the sensor results in a high-frequency-dependent measurement and a shorter distance for the AE signal to propagate to the sensor.However,if a bandpass filter is used to acquire data on the lowfrequency side,the error becomes large when evaluating the position of the rising edge of the AE signal wave.In other words,it is not possible to ensure sufficient accuracy when performing a localization analysis.
Therefore,the elastic wave attenuation characteristics of the actual rock mass were investigated at the side of the gallery near the east shaft.First,the P-AE,with the same sensitivity as the O-AE,was placed at a distance of 2 m from the side of the rock mass.Subsequently,the attack to the rock mass using hammer were applied at a distance of 1 m from the farthest point of the P-AE,causing elastic waves (pseudo-AE signal waves) to oscillate in the rock mass.The AE signal waves reached some of the P-AEs,and the elastic wave propagation and attenuation characteristics were investigated.A 4-channel digital oscilloscope was used for the elastic wave attenuation test.Therefore,two types of tests were conducted: one with a measurement layout of 1 m,2 m,3 m,and 4 m from the strike point to the P-AE,and another with a measurement layout of 2 m,3 m,4 m,and 5 m from the strike point to the P-AE.Fig.6 shows an example of the measurement results.To show the critical distance for measurement due to environmental conditions,results are shown for measurement layouts of 2 m,3 m,4 m,and 5 m from the strike point to the P-AE.The arrows in the figure indicate the position of the initial reading of the AE signal.The maximum amplitude of the received AE signal progressively decreased as the distance from the hammer strike point increased.When the separation between the hammer strike points and the AE receiving point reached 5 m,it was difficult to read the position of the rising edge of the AE signal wave as it approached an environmental noise of 1.5 mV at the measurement point.These results were organized according to the propagation distance and maximum amplitude of the AE signal wave,as shown in Fig.7.
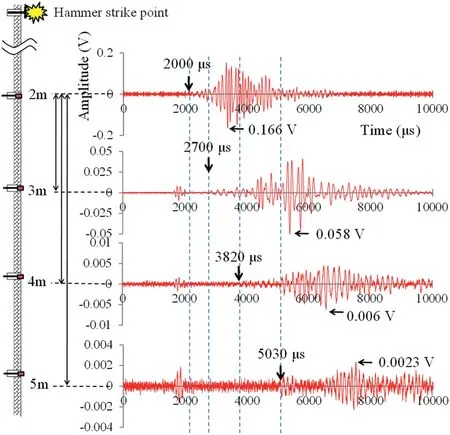
Fig.6.An example of propagation attenuation by elastic waves (pseudo-AE signal waves).As the distance from the hammer strike point increases,the maximum amplitude of the vibration received by the P-AE gradually decreases;at a distance of 5 m,it reaches 0.0023 V,approaching the environmental noise.

Fig.7.AE detection limit.The maximum amplitude of the vibration sensed by the P-AE becomes progressively smaller as the distance from the hammer blow position (0)increases.The relationship is A=6 × 0.19d,where A is the amplitude and d is the distance.At 5 m,the amplitude becomes 0.0023 V,which is close to the environmental noise (0.0015 V);hence,the detection limit of P-AE is 5 m.
It was found that the elastic wave attenuated at the rate of 0.19 times/m depending on the distance from the hammering point.Hence,it was concluded that the AE detectable area on the measured ground extended to a distance of approximately 5 m from the AE source.The energy of the hammer strike and the actual AE energy generated within the rock mass by the EDZ scenario did not match;however,a trend of attenuation could be observed.
3.5.Layout of MOP measurement
Based on the results presented in Section 3.4,the EDZ measurements during shaft excavation were conducted around the east access shaft,as shown in Fig.4b.Vertical boring was conducted along the east shaft axis from the experimental drift,as shown in Fig.8,and the MOP shown in Fig.5 was embedded prior to the shaft excavation.Vertical boreholes S1,S2,and S3 were located at the apex of a triangle with a side of 2.6 m.Boreholes S1 and S3 were drilled by approximately 1.5 m from the shaft wall,and borehole S2 was drilled approximately 4 m from the shaft wall.O-AEs were located at three points in each borehole: the upper (368.5-m depth),middle (370-m depth),and lower (372-m depth) sections.In addition,O-PP and O-T were installed between the middle and lower sections of boreholes S2 and S3.Borehole S1 was at the same horizontal separation from the shaft wall as borehole S3.Therefore,the O-PP and O-T measurements were omitted.

Fig.8.Location of MOP.Three O-AEs,one O-PP,and one O-T were placed in one MOP.As the S1 and S3 boreholes were equidistant from the shaft wall,only three O-AEs were placed in the MOP in the S1 borehole.
3.6.AE signal waveform processing method
The frequency of occurrence,maximum amplitude,andmvalue,reported by Ishimoto and Iida (1938),and the frequency response and location of AE occurrence were used to extract the characteristics of the AE signal.The frequency of AE occurrence was calculated by discriminating the signal wave with reference to the environmental noise at the location and calculating the number of occurrences per unit time.The event count calculation method was applied,wherein one scenario was regarded as one count.Themvalues are frequency distributions by scale for propagating waves such as earthquakes.The maximum amplitude values and frequency of occurrence are organized in logarithmic graphs,and the relationship is represented by a linear regression equationNAm=k,whereAis the maximum amplitude,Nis the total number of earthquake events fromAtoA+dA,andmandkare constants.For example,the value ofmdecreases as the number of large earthquakes increases,i.e.a parameter indicating the proximity to the damaged area.Therefore,it has the same meaning as thebvalue presented by Gutenberg and Richter (1949).The frequency response is shown as a spectrum obtained from frequency analysis of the signal wave.Typically,AE signal waves contain various frequency components.The conversion from the time-domain wave data to the frequency domain enables the quantitative evaluation of micro-fractures and crack propagation.In contrast,the location of AE initiation and propagation can be identified through location analysis.This allows the elucidation of the crack initiation scenario in the rock mass during shaft excavation and over time after excavation.In other words,it is possible to evaluate the EDZ based on the strength of the AE.
4.Measurement results of EDZ
4.1.Discrimination of AE signal waves
Numerous AE signal waves were recorded immediately after the start of the excavation of the east access shaft.The shafts were excavated mechanically,and the groundwater contained dissolved methane gas and generated bubbles;therefore,the observed data were considered to include AE not caused by the development of the EDZ.Forty-five million AE signal waves were observed during the excavation.Therefore,it is necessary to appropriately and efficiently extract the AE emitted from the rock mass(rock AE).The obtained AE signal waves can be classified into approximately five types of occurrence patterns,as shown in Fig.9.

Fig.9.AE signal waveform patterns observed during shaft excavation.Primarily,the generated AEs can be classified into five shapes.Of these,(a) is AE signal when the fractures are induced in rock mass,whereas the others are AEs caused by mechanical vibrations and fluid movement in the rock.
Based on in situ AE measurements by Hata et al.(1998,2002,2010),the abrupt AE signal wave was considered to have originated from the rock mass owing to stress redistribution.The periodic overlapping AE signal waves were found to be construction machinery noise by comparing with the operation of the excavation machinery during the construction cycle.Further,the signal waveforms classified as continuous,spindle,and short-duration types were considered to be AEs caused by events other than those described previously.Small-amplitude continuous and spindle-shaped signal waves have been observed in rock caverns at great depths and under high water pressure and are considered to be caused by fluid behavior.Burlini et al.(2007)and Benson et al.,(2008)conducted studies on volcanic microtremors and suggested that AEs caused by fluid behavior are of a continuous type and are characterized by high resonance.Therefore,AE signal waves with these characteristics are assumed to be related to the groundwater flow and combustible gas ejections rather than to rock AE induced by damage of rock mass.
Therefore,to accurately and efficiently extract only the rock AE from numerous AE signal wave data observed,automatic discrimination was performed using the peak frequency,waveform shape characteristics,and resonance characteristics of the AE signal waves.
4.1.1.Peak frequency quantification
Air-conditioning equipment and groundwater pumps were in constant operation in the URL.Frequency analysis of the vibrations emitted from all machinery,including the excavator,showed that the peak frequency was less than 25 kHz.Therefore,the AE signal waves with peak frequencies above 25 kHz were discriminated as AE signal when the fractures were induced in rock mass.
4.1.2.Waveform shape quantification
The value obtained by dividing the duration shown in Fig.10 by the peak amplitude is defined as an index that represents the shape of the AE signal wave(waveform shape index).This index was used to discriminate between single and continuous AEs.
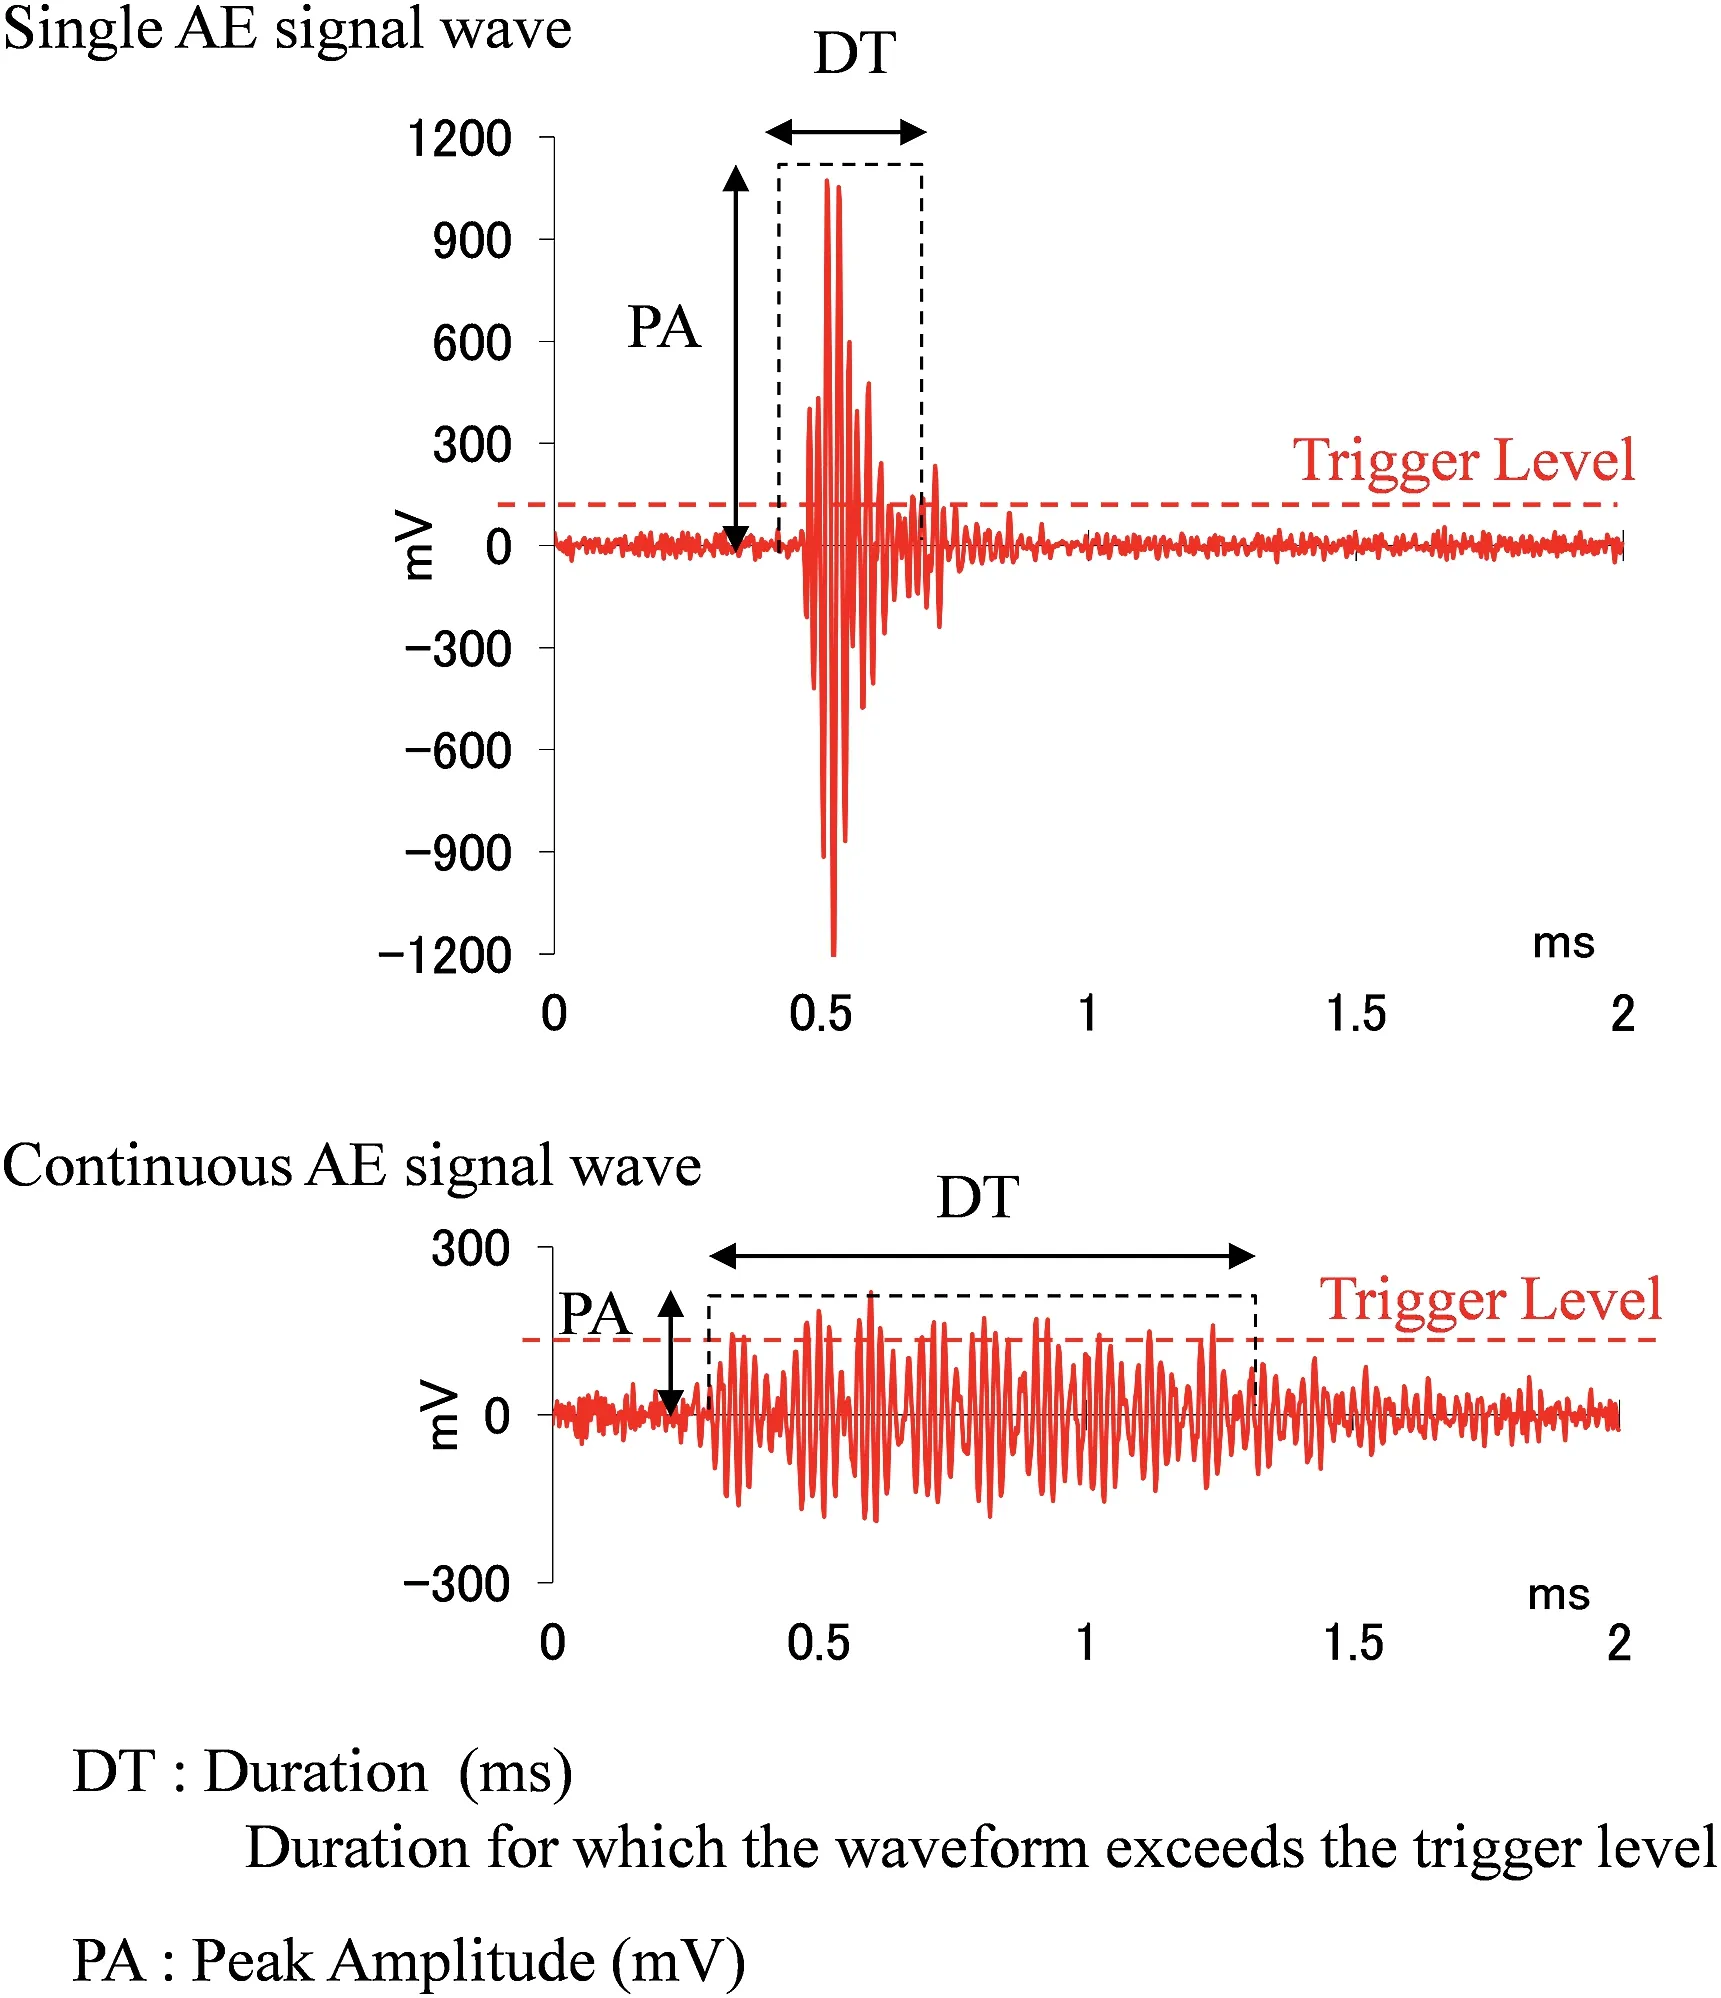
Fig.10.Waveform shape characteristics.The shape of AE that occurs suddenly and solitarily differs significantly from that of AE that occurs continuously.The relationship between duration and peak amplitude is used to quantitatively discriminate their shapes.
4.1.3.Resonance quantification
The AE signal waves contain various frequency components.Hence,it is necessary to concentrate on a single frequency component.The spectral half-width was used to quantitatively characterize the AE signal wave spectrum.The spectral half-width is the width between the two ends of the spectral peak at 50% intensity,as shown in Fig.11.It is a measure of the sharpness of the monochromatic and resonant properties of the spectrum.Yoshikawa (1991) and Kataoka (2014) showed that the spectral half-width is widely used in the fields of optics and material properties as an indicator for evaluating the instrument performance and material properties.
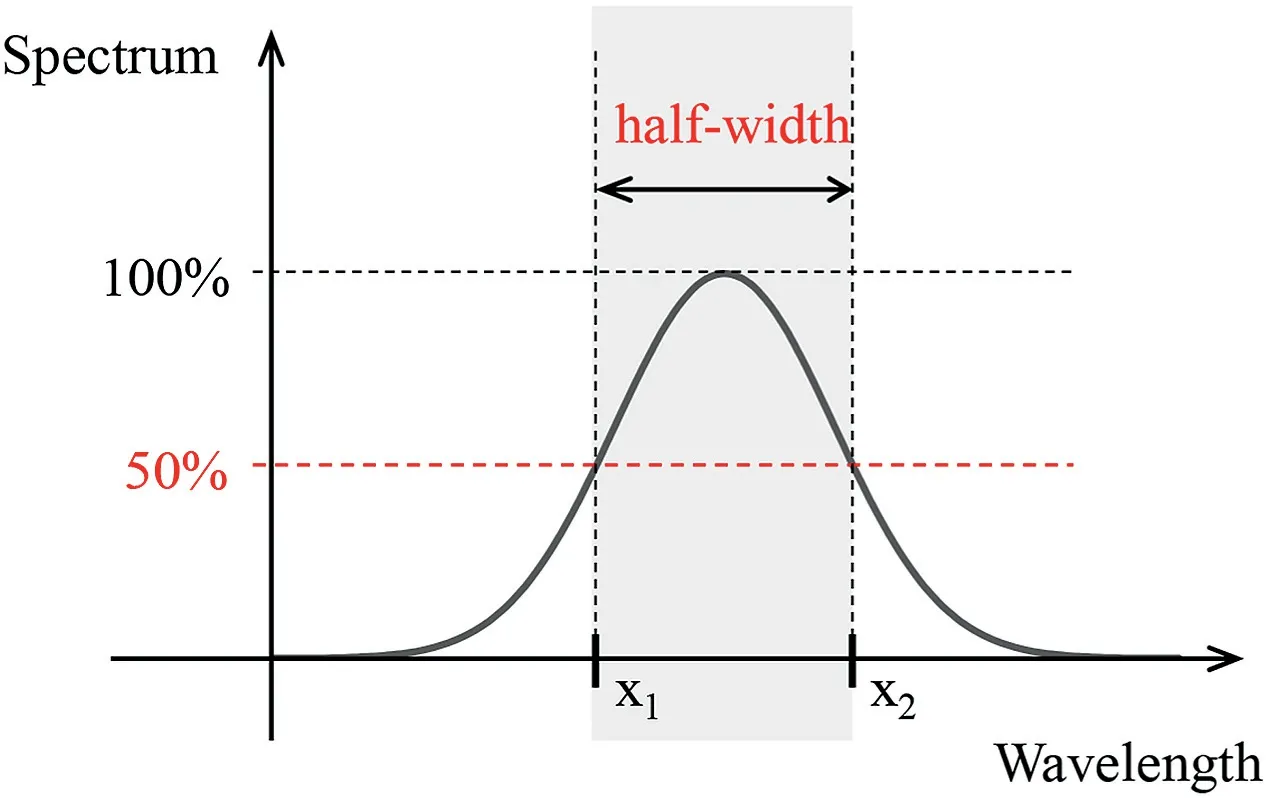
Fig.11.Resonance characteristics.The half-width of the spectrum is the width of the frequency that corresponds to 50% or more of the spectral intensity.
Applying the three evaluation parameters described above(peak frequency,waveform shape characteristics,and resonance characteristics),numerous measured AE data were automatically discriminated,and only valid data were acquired.The discrimination conditions for the three evaluation parameters are listed in Table 3.These conditions were used to eliminate the mechanical vibrations generated in the shaft and noise generated by the movement of the fluid containing the dissolved methane gas in the rock mass.

Table 3Conditions for AE discrimination.By properly utilizing the three parameters of peak frequency,waveform shape,and resonance,it is possible to identify the AE caused by mechanical vibration and liquid movement in the rock mass.
4.2.Behavior of AE,pore pressure,and temperature change during shaft excavation
The results of the measurements of AE,pore pressure,and temperature during the shaft excavation are shown in the “under excavation” period of Fig.12 for borehole S1,which is in close proximity to the shaft.The AE signal waveforms were discriminated according to the conditions shown in Table 3,and 2.35 million events,i.e.AE signals were evaluated as the AE signal when fractures were induced in rock mass,which was equivalent to 5%of the recorded wave.The uppermost row in the figure shows the progress of the shaft excavation.The figures below show the variation of pore pressure and temperature along with time.The bottom three figures show the frequency of AE signal received in the upper,middle,and lower sensor in borehole S1.The installation depths of the O-AE are shown in Fig.8.The upper position is gland level(G.L.)-368.5 m,the middle position is G.L.-370 m,and the lower position is G.L.-372 m.

Fig.12.Measurements of rock AE,pore pressure,and temperature during shaft excavation and post-excavation maintenance phase (borehole S1).Shaft excavation progress is shown in the upper panel.O-PP and O-T measurements for holes S2 and S3 are shown in the middle panel.O-AE results are shown in the lower panel.Time series of AE occurrence frequency corresponding to each of the three O-AE installation depths are shown.
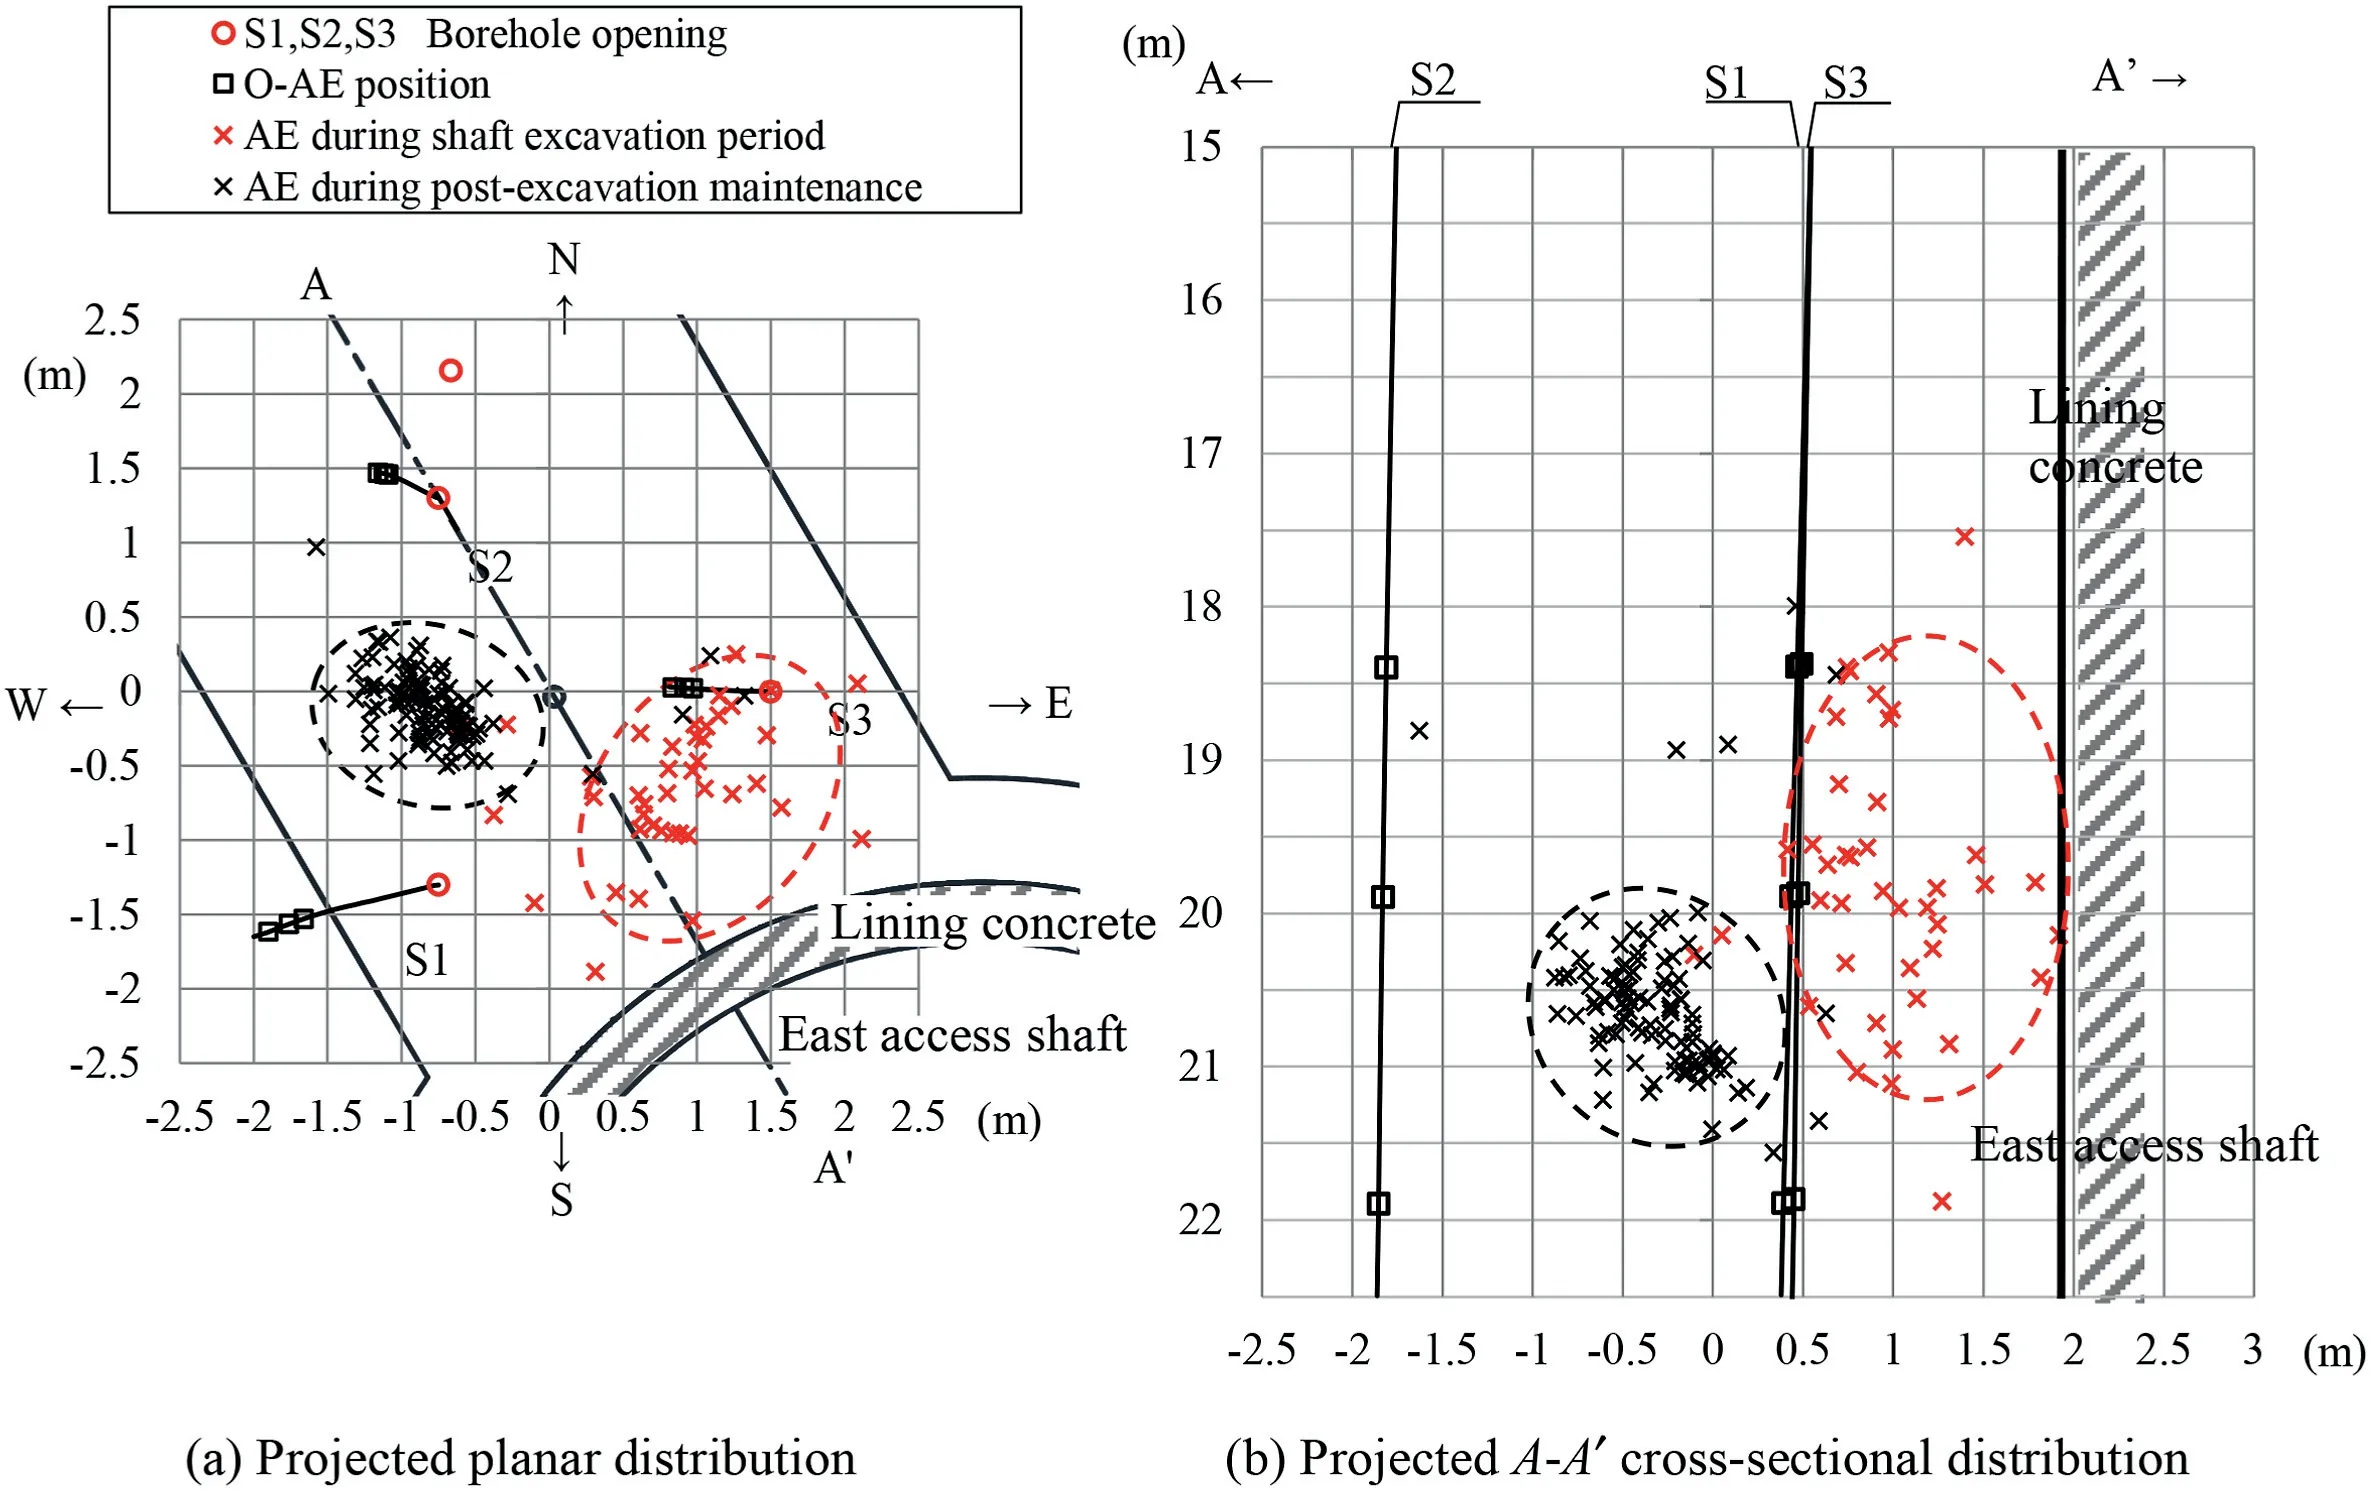
Fig.13.3D location of AE sources.
In the AE measurements,the location of AE generation tended to move downward with increasing depth (from upper to lower) as the excavation progressed.That is the damage to the rocks around the cavern,caused by the excavation activity,which shifted from above to below the surface.A similar trend was observed in borehole S3.Nevertheless,the AE generation was lesser and the distribution area of the AE generation shifted from the upper to the lower positions.However,in borehole S2,the number of occurrences was considerably smaller than that in these two boreholes,and no clear migration trend was observed.This may be attributed to the fact that only relatively large amplitudes of AE reach the site due to the propagation characteristics of elastic waves movingthrough the rock.Details of the measurement results are given in Hata et al.(2020).
The pore pressure in borehole S3 increased rapidly and decreased several times.The increase and decrease in the pore pressure occurred at approximately the same time as and immediately after the onset of the AE.The local stress concentration and relaxation may have caused the initiation,propagation,and closure of microcracks,resulting in pore pressure changes.In addition,pore pressure was slightly increased and decreased in borehole S2.The influence of the stress redistribution was found to be significant rather than the extent of the EDZ.
Concerning the temperature measurement,an increase of 1.4°C was observed in borehole S3.However,in borehole S2 it showed almost no change,although the temperature increased by 0.2°C.It is considered that changes in the air temperature by ventilation in the shaft owing to the shaft excavation propagated into the ground,in particular near the shaft wall.
4.3.Behavior of AE,pore pressure,and temperature change during maintenance after shaft excavation
The results of the AE measurements,pore pressure,and temperature along time for approximately 250 d after the shaft excavation are shown in Fig.12 for the “post-excavation maintenance”period in borehole S1.The pore pressure and temperature shown in the figure were measured in boreholes S2 and S3.They are shown together to see the relationship between the AE data and the trends of these changes.
In the AE measurements,AE was barely detected at the upper and middle depths.After the shaft excavation,the rock around the cavern reached a stable condition.However,at a lower depth,AE was observed to some extent after the excavation was completed.Borehole S3 showed a similar trend.At the upper and middle depths,the stress redistribution was smooth and comprehensive.In the lower depth,stress redistribution has not converged because of the immediate proximity of the excavation face,and small numbers of AEs are estimated to continue to occur.The scenario of smallscale AE continuing to occur around the corner of the face is consistent with that observed by Hata et al.(1998,2002).In contrast,the AE was sporadic in borehole S2 as well as in the excavation phase.It is inferred that the effect of shaft excavation was small.
The pore pressure measurements showed a long-term trend of change in boreholes S2 and S3.During excavation,a rapid increase or decrease in pore pressure was observed in borehole S3,which was found to have a strong correlation with AE generation.However,after the excavation was completed,only a gradual increase or decrease in pore pressure was observed.AE occurred on a small scale,but was not correlated with fluctuations in pore pressure.
The temperature measurements showed a gradual and continuous decrease in both boreholes S2 and S3.Borehole S3 showed a larger temperature decrease of 7°C than borehole S2.This may be owing to the existence of EDZ fractures affected by the ventilation temperature from outside the facility as observed in excavation phase.
4.4.3D AE source location
Multiple sensors should receive the AE signal from the same source to determine its location.Considering the attenuation owing to the propagation distance and sensor layout,the AE magnitude must be large.It was found that the received AE signal waves did not propagate simultaneously beyond the 5-channel O-AE in this measurement layout unless at least one of the AE amplitude values exceeded approximately 800 mV.Therefore,following the automatic discrimination of AE signal waves,the events were mechanically discriminated using a threshold value of 800 mV for the maximum amplitude for source identification.Consequently,149 AE signal waves that satisfy these conditions were extracted.These AE signal waves were confirmed by visual inspection as propagating components of the AE emanating from a single source.The location of the 3D source was then determined.A source determination method for the source location of oscillatory waves was implemented in the earthquake field in addition to a table lookup method in which the region was divided at the grid points,and sequential calculations were performed.In this study,the nonlinear least-squares method proposed by Sasaki et al.(1987)was used to analyze a 3D source location similar to that used by Feng et al.(2019).Although S-waves are frequently used in earthquakes,Pwaves are preferred when there are structures such as shafts and horizontal tunnels at the site,and the propagating waves are likely to reflect off the free surface,making it impossible to identify the time of arrival of the initial motion.A seismic wave velocity of 2.26 km/s obtained from a separately conducted in situ seismic wave test was used.
Fig.13 shows the results of the AE source location analysis projected onto the plane and theA-A′section.The AE locations generated during excavation of the shafts are indicated by red crosses,and those generated during the maintenance period after the completion of the excavation are indicated by black crosses.The AE sources were concentrated at two locations.During shaft excavation,AE sources were concentrated approximately 1.5 m from the shaft wall.However,those concentrated 2-3 m from the wall (black crossed line in the figure) began to occur one month after the excavation was completed and continued for more than four years.The AE that occurred during excavation was attributed to the localized failure of the rock mass due to excavation.However,the AE that occurred after excavation was long-term and infrequent,suggesting that it was not a failure scenario caused by the rapid propagation of the existing fractures.In other words,creep deformation is considered to be caused by the relationship between the strength of siliceous mudstone and the initial and secondary stresses after the stress redistribution.
4.5.Mechanism of pore pressure fluctuation
As shown in Fig.12,the pore pressure increased up to a depth of approximately 370 m in boreholes S2 and S3 and then began to decrease in the latter half of the excavation.After completion of the excavation,the pore pressure continued to decrease in borehole S3,which was located close to the shaft.However,the pore pressure in borehole S2 exhibited an upward trend from the middle of the excavation.The pore pressure variation mechanism shown in Fig.14 was examined to deduce the related characteristics.In addition,Hata et al.(2020) made detailed observations of cracks and discontinuities appearing on the wall surface during shaft excavation.As a result,they separated existing and new fractures and confirmed the distribution of existing fractures in the vicinity of the O-AE installation.
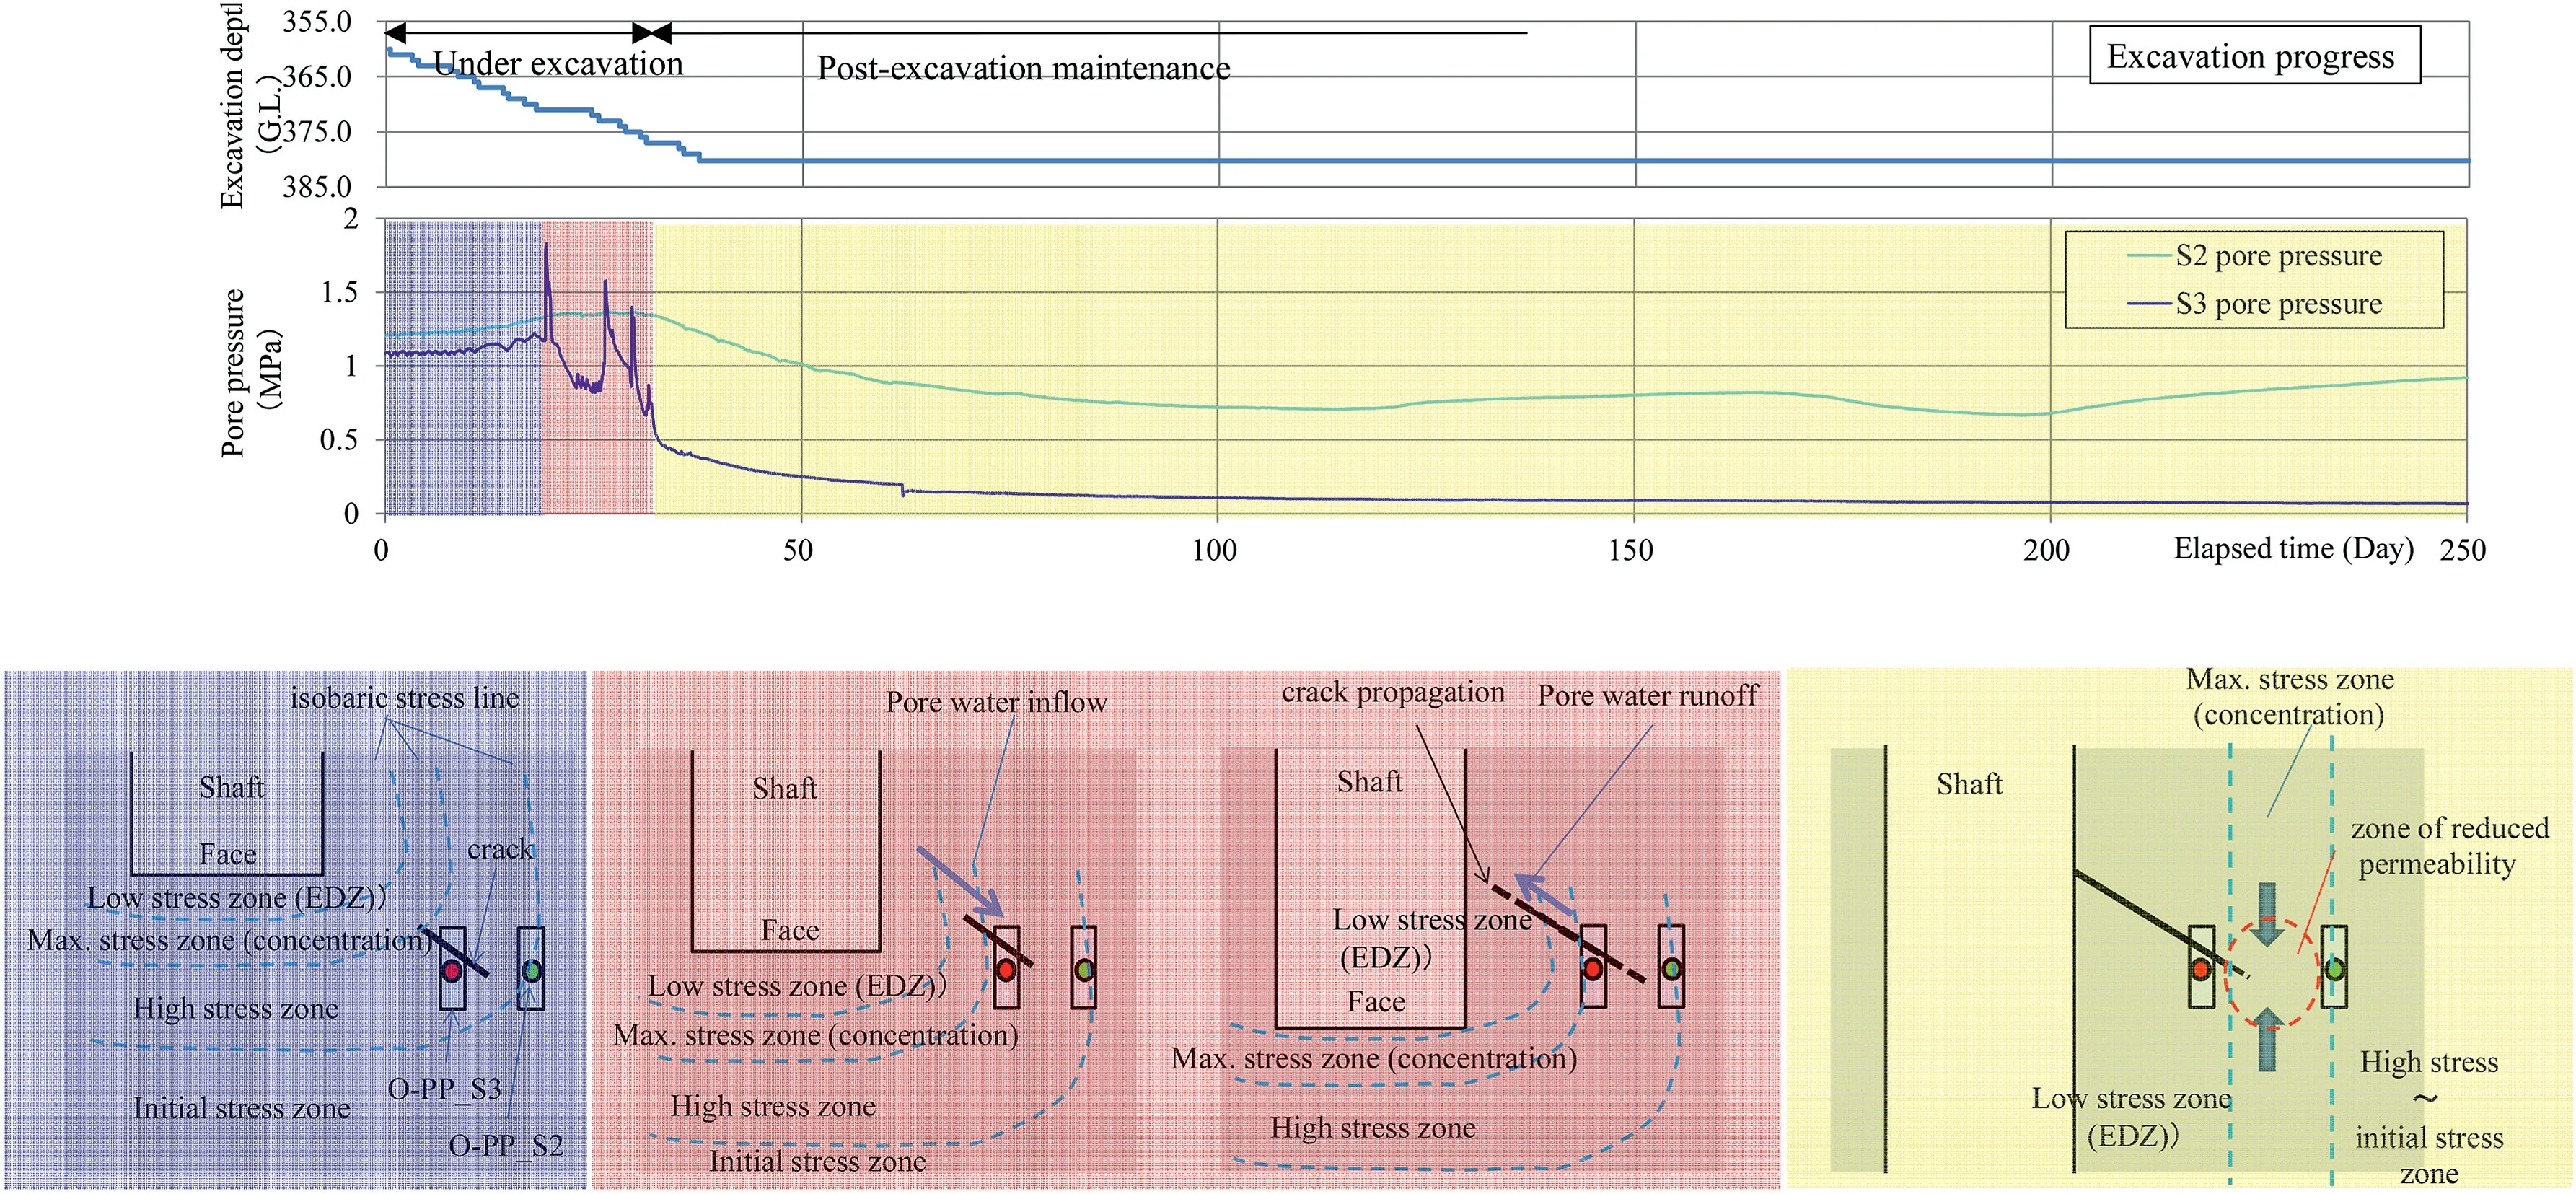
Fig.14.Mechanism of pore pressure fluctuation.The rapid increase in pore pressure in the red-shaded area is expected to be due to the inflow of pore water from the high stress region.Subsequent expansion of the EDZ and outflow of pore water is expected to have resulted in a sudden decrease in pressure.In the yellow-shaded area,the crack width and pore space are expected to shrink due to stress concentration,resulting in reduced permeability.
In the area around borehole S3,the stress concentration propagated gradually with progress in the shaft excavation during the period indicated by the blue shading in Fig.14,and the pore pressure gradually increased as the stress concentration area shifted.The water pressure in borehole S2 suddenly increased to 1.8 MPa at the boundary between the blue-and red-shaded areas.As shown in Fig.12,numerous AE signals were detected synchronously with increase in the pore pressure.In addition,numerous AE signals of fluid origin were detected.This scenario is considered to be caused by the rapid inflow of high-pressure groundwater through the fractures existing near the sensor installation,resulting in a sudden increase in the pore pressure.During the period shaded in red,the stress redistribution was further enhanced and the stress concentration in the rock mass was relieved,resulting in the development of the EDZ.This is considered to result in groundwater discharge and rapid pore pressure reduction.
Stress redistribution causes continuous stress concentration and stress relaxation.As a result,where stress concentrations are high,crack growth exceeds the strength of the rock mass,and where stress relaxation occurs,crack activity ceases or the crack closes.This repeated propagation and closure is considered to have resulted in multiple water pressure spikes and drops.Furthermore,during the subsequent period shaded in yellow,the effect of stress redistribution was reduced,and the rapid hydraulic pressure fluctuations ceased.Nevertheless,the pressure continued to decrease gradually.In borehole S3,the decrease in the pore pressure stopped 60 d after the start of the shaft excavation(approximately 23 d after excavation was completed),and the pressure approached almost 0 MPa.This was presumably due to the unsaturated conditions in the measurement section and water sampling line caused by the inflow of water or methane gas from the fractures.Pore pressure has not recovered,as it has remained almost 0 MPa until February 2023.On the other hand,in borehole S2,the pore pressure decreased after the excavation was completed and started to increase at 163 d(200 d after the excavation),and recovered to 76%of the initial pore pressure at 213 d(250 d after the excavation)in the Fig.14.The pore pressure then recovered to the initial pore pressure approximately one year after the excavation was completed.Thereafter,the pore pressure decreased and increased repeatedly,and as of February 2023,the pore pressure was 80% of the initial pore pressure.
5.Hydro-mechanical behaviors of EDZ
5.1.Relationship between in situ permeability tests and water level fluctuations in boreholes
Three boreholes(F,G,and H)were drilled around boreholes S1,S2 and S3 for the hydraulic tests to investigate the increase in hydraulic conductivity in the EDZ induced around the shaft wall.The angle of borehole F was 82°from the horizontal line to detect the hydraulic conductivity near the shaft wall.The minimum distance from the shaft wall to borehole was 0.66 m.Boreholes G and H were drilled vertically and located 4.2 m and 7.5 m from the shaft wall,respectively.Hydraulic tests are conducted in boreholes sections F-1,F-2,G-1,and H-1,as shown in Fig.15.Considering the hydraulic conductivity of the rock mass at the site,pulse testing was used as the basic method.In borehole F which was drilled within the EDZ,a constant-flow injection test was performed after the excavation because high hydraulic conductivity was estimated in the section.In addition to the hydraulic tests,the groundwater level in borehole was measured along time by water hydrometer.
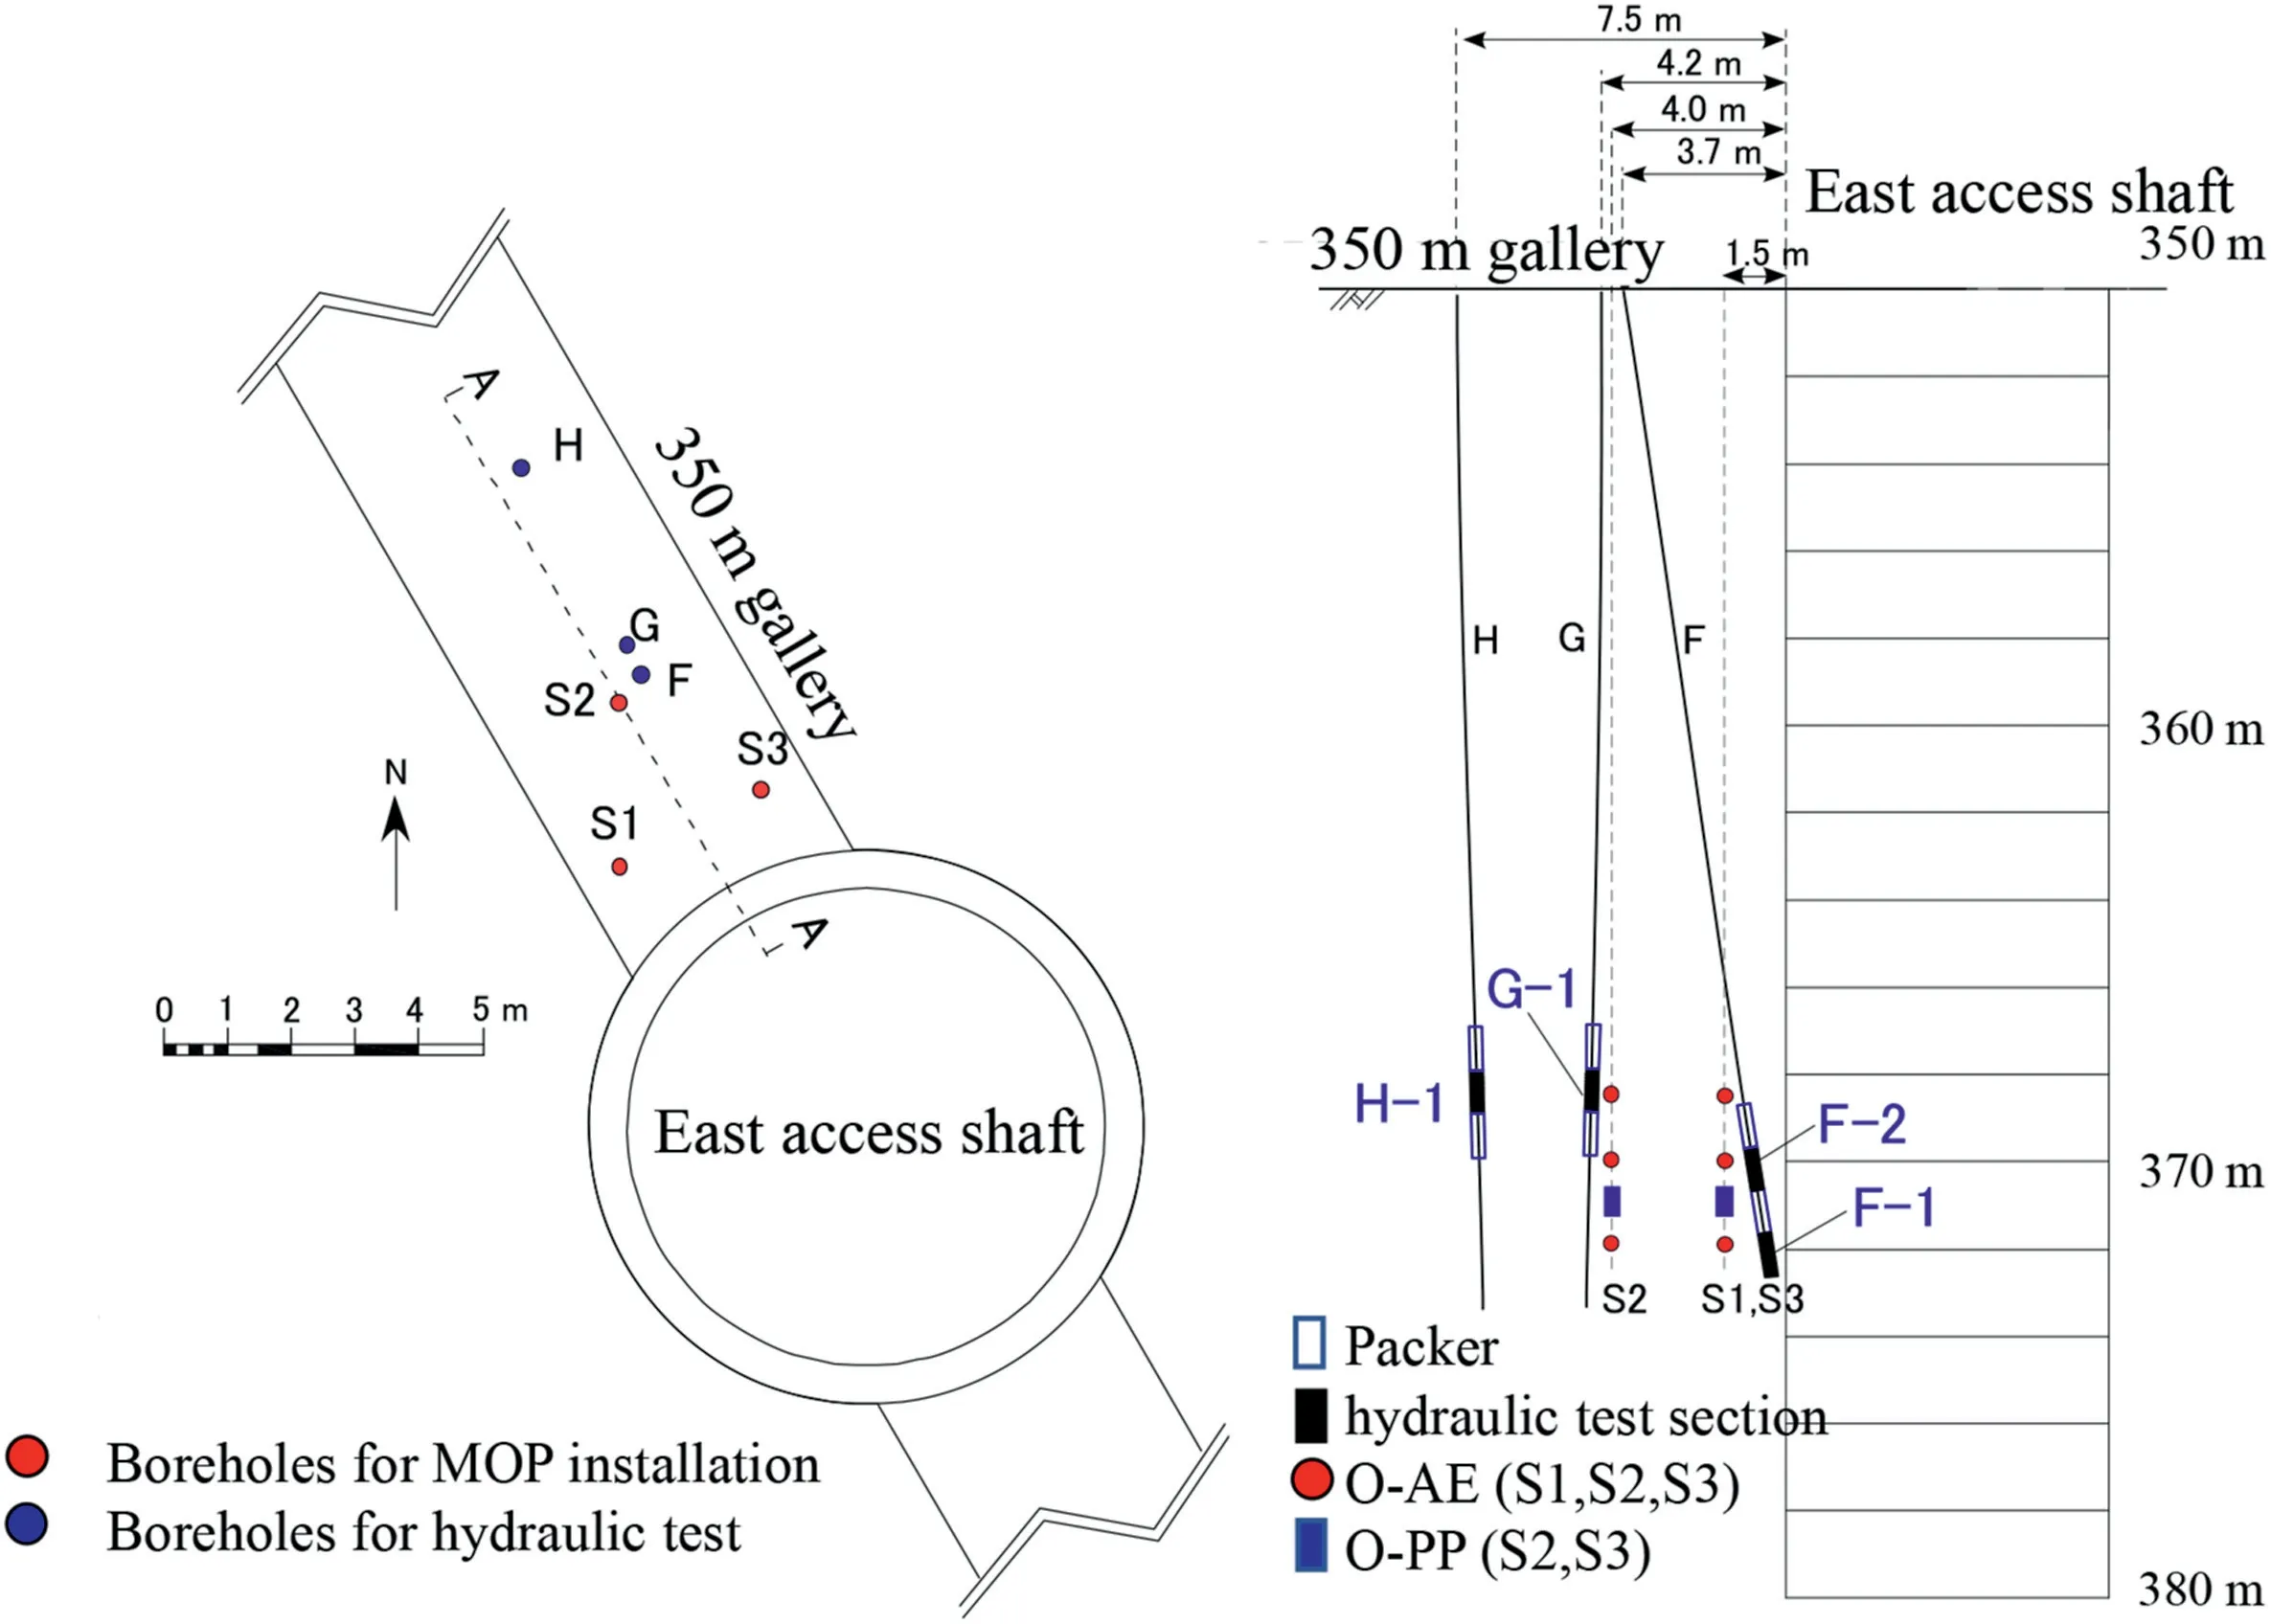
Fig.15.Layout of in situ hydraulic test.Hydraulic tests were conducted in boreholes F,G and H.O-TT measurements were acquired from the space between boreholes G and F.
The results of the hydraulic tests performed before and after the shaft excavation are shown in Fig.16.After the shaft excavation,the hydraulic conductivity ranged from 8.8×10⁻⁹m/s to 2.5×10⁻⁷m/s in the area approximately 1.2 m from the shaft wall which are 24 orders of magnitude higher than those measured before the shaft excavation,i.e.8.1 ×10-12-3 ×10-11m/s before the shaft excavation.In contrast,no significant changes were observed before and after the shaft excavation more than 4 m away from the shaft wall (boreholes G and H).

Fig.16.Result of the hydraulic tests performed before and after excavation of the shaft.
Fig.17 shows the measured groundwater level in boreholes F,G,and H during excavation.The groundwater level in borehole decreased rapidly to 0 m when the shaft was excavated to a depth of 371 m.This is caused by the development of EDZ fractures instantaneously occurred during shaft excavation which create water pathway.In boreholes G and H,the water level remained constant and did not change during the shaft excavation.This is consistent with the measurements in Fig.12,which showed slight increase or decrease in the pore pressure in borehole S2 but no significant changes.
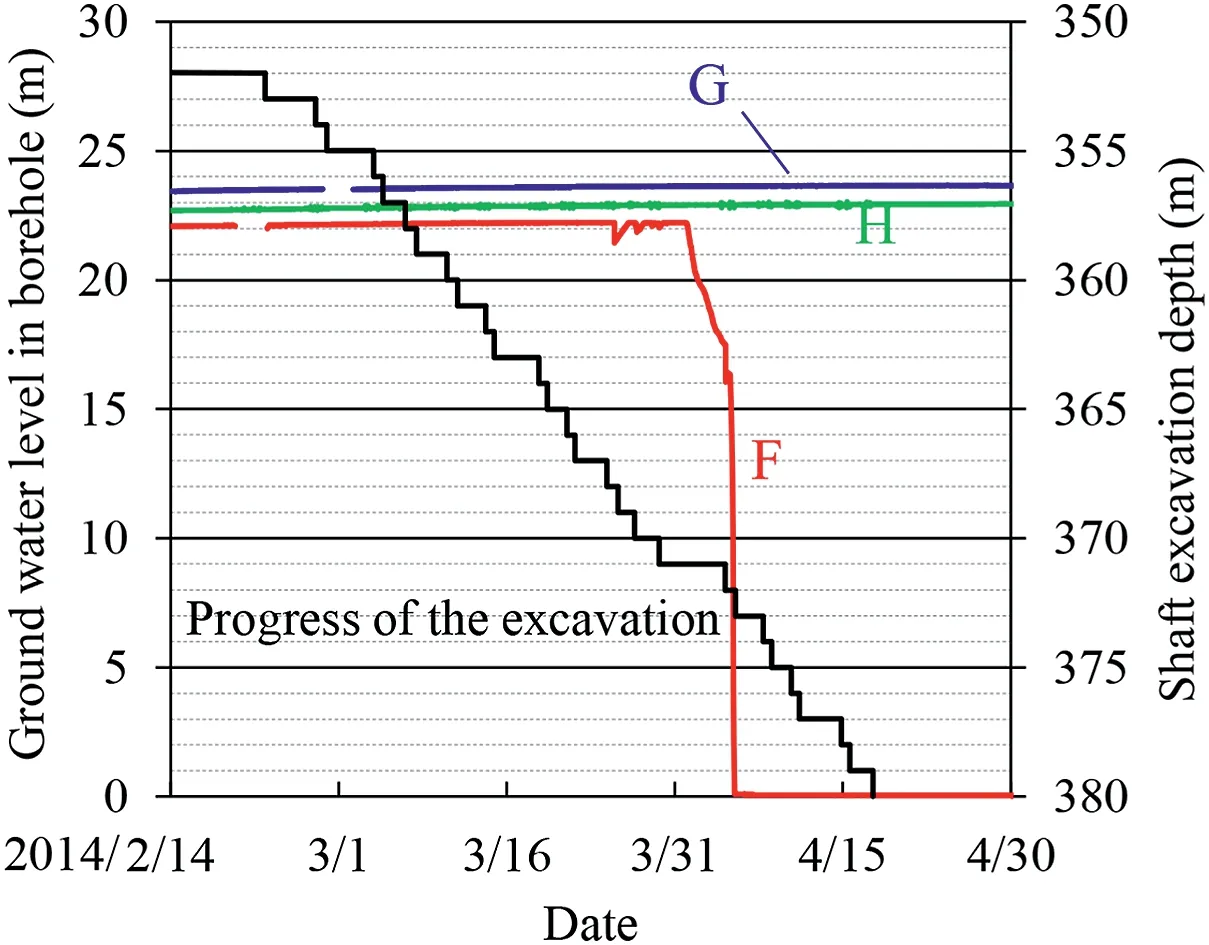
Fig.17.Ground water level in the borehole along time.
Comparisons of the results are shown in Fig.16,the AE occurrences in Fig.12,and the 3D AE source locations in Fig.13.For targeting 3D AE source locations,the amplitude value of a pair of received AEs is about 800 mV or higher.Hata et al.(2010,2020)measured AE generated during the process of fracture in a rock uniaxial compression test and were able to discriminate between elastic and inelastic ranges based on the difference in AE signal wave levels,i.e.the amplitude value of a pair of received AEs is about 3000 mV or higher.In this study,unstable fracture is observed in the rock mass where large-amplitude AE signal waves are generated;the increase of hydraulic conductivity by 2-4 orders of magnitude after excavation near the wall in Fig.16 and the concentration of relatively large-amplitude AE near the wall in Fig.12 suggest that crack initiation and propagation cause groundwater flow,and that this may be the cause of the cracks.The relatively large amplitude AE concentrated near the wall in Fig.12 is consistent with the situation where the pore pressure in S3 drops rapidly due to the flow of groundwater caused by the crack initiation and propagation and its connection with the shaft wall,eventually converging to 0 MPa.The pore pressure fluctuates up and down after excavation Nevertheless,the fluctuation is moderate,which is consistent with the fact that the hydraulic conductivity at a distance of more than 4 m in Fig.16 does not change significantly before and after excavation.In other words,it can be said that stress redistribution progresses slowly and that the fractures and pore spaces created during excavation close gradually,in addition to groundwater supply.The hydraulic field tends to recover to the initial regional hydraulic field.
The evidence of the development of EDZ fractures can be explained by the geological observation on the wall of the shaft during excavation(Aoyagi et al.,2019).As a result,tensile fractures were mainly observed on the wall.Tokiwa et al.(2014,2018)revealed that these tensile fractures were generated by excavation.Furthermore,by examining the results of the numerical analysis of a 3D sequential excavation,Aoyagi et al.(2017) and Aoyagi and Ishii (2019) provided mechanistic evidence that fractures caused by gallery excavation are tensile or hybrid (tensile/shear) fracture.
5.2.Evaluation through coupled mechanical and seepage flow analysis
A coupled mechanical and seepage flow analysis simulating the excavation of the east access shaft from 350 m to 380 m depth was performed using software FLAC3D version 4.0 (Itasca Consulting Group Inc.,2009) which is a 3D continuum numerical analysis using the fast Lagrangian method.The analytical model consists entirely of hexahedral elements.The physical properties used in the analysis are listed in Table 4.
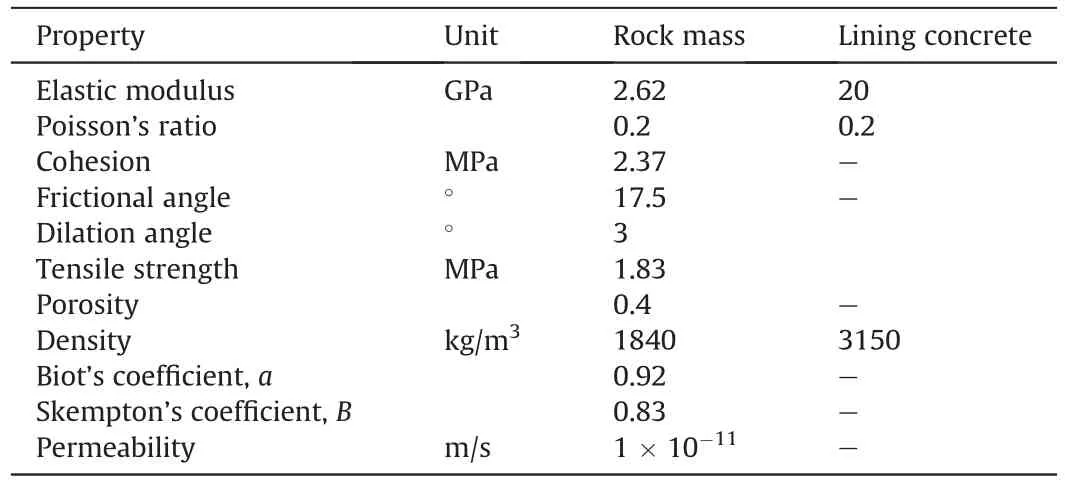
Table 4Physical properties for numerical analysis.The input properties for the numerical analysis are shown separately for rock mass and lining concrete.
The initial stresses were determined based on the hydraulic fracturing test presented by Kondo et al.(2013) and the rock density of 1840 kg/m3taking the depth dependency into account,with the maximum horizontal stress set at 1.3 times the vertical stress in east-west direction and the minimum horizontal stress set at 0.9 times the vertical stress in north-south direction.
The steps in the numerical analysis were faithfully modeled using the short-step method(Aoyagi et al.,2019),which is a construction cycle for shaft excavation.Based on the work records of the excavation of the east access shaft,undrained conditions were set at the wall and face during shaft excavation,and drained conditions were set from the erection of the support structure after the excavation to the next excavation.After excavation was completed,the drainage from the sidewall and face was reproduced for approximately 13 d to determine the distribution of the pore pressure along time.The failure criterion was the Mohr-Coulomb formula,and tensile cut-off was established based on the mechanical property listed in Table 1.To simplify the numerical analysis,the steel supports (Aoyagi et al.,2016)were not modeled.The failure zone and pore pressure distribution around a depth of 370 m detected by numerical analysis,measured by the O-AE and O-PP at the time of excavation completion (depth of 380 m),are shown in Fig.18.From Fig.18a,failure zones of 0.3 m in east-west direction and 1.5 m in north-south direction would occur after the excavation was completed.Fig.18b shows that the pore pressure decreases in the rock mass around the shaft owing to drainage during the shaft excavation.
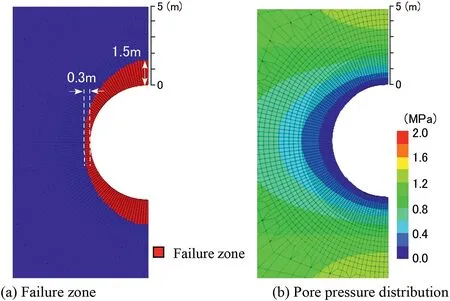
Fig.18.Results of the failure zone and pore pressure distribution after completion of shaft excavation.
The change of the pore pressure measured by O-PP sensors and the result of numerical analysis along time are indicated in Fig.19.The measurement results show that in borehole S3,the pore pressure increased and decreased several times during the excavation process.After the excavation was completed,the pore pressure decreased to approximately 0.24 MPa.However,the numerical results showed that the pore pressure increased to a maximum of approximately 1.6 MPa when the face reached approximately 369 m.Thereafter,as the excavation progressed,the pore pressure decreased rapidly,eventually decreasing to approximately 0.73 MPa.The increase in the pore pressure is considered to be caused by a sudden stress concentration and instantaneous undrained behavior of rock mass around the shaft wall which can be observed in the low-permeability sedimentary formation(Martin and Lanyon 2003;Rutqvist et al.,2009).Thus,it is estimated that this behavior leads to the decrease in effective stress,which means that the development of the tensile and hybrid fracture occurred instantaneously after excavation of the shaft.
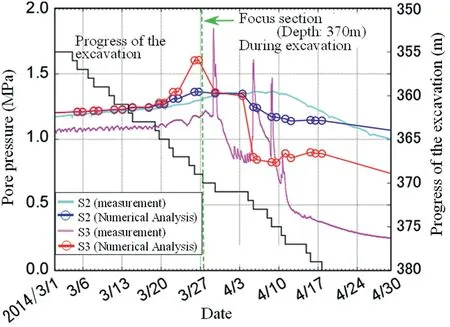
Fig.19.Change in pore pressure measured by O-PP and result of numerical analysis along time.
The repeated rapid rise and fall in the pore pressure over a short periodisdifficulttoreproduceinanumericalanalysis.However,inthe present numerical analysis,the trend of the change inpore pressure is almost consistent with the measured result.In contrast,in borehole S2,the gradual increase and decreaseinthe pore pressure obtained by the numerical analysis were almost consistent with the measured results.The stress concentration effect due to the excavation was also observed at a distance of 4 m from the shaft wall,which may have caused a slight increase or decrease in the pore pressure.
6.Conceptual hydro-mechanical model of EDZ
The authors integrate the results of AE source location,hydraulic tests,and failure zone estimated by numerical analysis and generate the conceptual hydro-mechanical model of the EDZ around the shaft as indicated in Fig.20.The results showed good agreement between the areas of concentration of AE sources,the extent of the failure zone estimated by the numerical analysis,and areas of increased hydraulic conductivity.The pore pressure fluctuation mechanism indicated in Fig.14 also reinforces the presented conceptual model and shows the overall behavior of the hydro-mechanical EDZs.
In the construction of a geological repository for HLW,such a conceptual model will contribute to the evaluation of the damage condition caused by tunnel excavation and the adequacy of the support design,as well as assist in the efficient planning of countermeasures.In addition,it can provide an initial condition of the EDZ to the long-term assessment of the migration of radionuclides for the HLW disposal after the backfilling of the facility,which can enhance the reliability of long-term safety assessment of HLW disposal.Furthermore,the MOP,in situ permeability tests,and numerical simulations presented in this study are useful in understanding the hydro-mechanical properties and scenarios of EDZs.
7.Summary and conclusions
In this study,an O-AE was developed for the measurement of rock masses,and EDZ evaluations were conducted on sedimentary soft rocks using MOPs that enable long-term monitoring.The following results are obtained:
(1) During the shaft excavation,the AE tended to occur toward the excavation depth.The pore pressure near the shafts showed several rapid increases and decreases with the progress of excavation,and a temperature increase of 1.4°C was observed.
(2) During the maintenance period after the shaft excavation was completed,AE was barely detected in the upper and middle sections and only slightly detected in the lower section.The effects of stress redistribution were assumed to continue over a long period of time.The pore pressure showed a long-term trend of change,and the temperature showed a gradual decreasing trend.
(3) A 3D localization analysis was performed based on 149 AE events and the source location was successfully determined.The results showed that the AE events were concentrated within 1.5 m from on the shaft wall during the excavation and the area between 2 and 3 m from the shaft wall after the excavation.
(4) The hydraulic conductivity increased by two to four orders of magnitude larger than the intact rock with excavation in an area approximately 1.2 m from the shaft wall.
(5) A conceptual model of the EDZ was developed to visualize the extent and properties of the hydro-mechanical properties of the EDZ during the shaft excavation by integrating the AE source concentration area,the area of enhanced hydraulic conductivity,and the extent of the failure zone estimated by the numerical analysis.
The results of this study can be applied to HLW disposal projects as well as to assess the integrity of tunnels and large underground caverns.They can be used to efficiently evaluate the validity of the facility design and planning countermeasures during the excavation of caverns.They can also provide an initial condition of the EDZ to the long-term assessment of the migration of radionuclides for the HLW disposal after the backfilling of the facility.In the future,confirmation of the long-term durability of the optical instruments used for measurements in this study will continue.Furthermore,the mechanism of AE generation during the movement of the gaswater mixture in the rock mass should be elucidated for further advancement of the EDZ evaluation.
Declaration of competing interest
The authors declare that they have no known competing financial interests or personal relationships that could have appeared to influence the work reported in this paper.
Acknowledgments
Dr.Kimikazu Tsusaka (currently employed at INPEX Corporation),who was employed at the Horonobe Underground Research Center during this study,was instrumental in planning the MOP installation and site coordination.Mr.Kenji Hagiwara and Mr.Takayuki Motoshima of the Taisei,Obayashi,and Sumitomo Mitsui Construction joint venture assisted in coordinating the excavation process during the MOP installation and in planning and supervising the in situ permeability tests and water level measurements.Mr.Hirokazu Fujii of Lazoc Inc.assisted in the design and fabrication of the MOP,its installation,and organization of the measurement data.The authors express their deepest gratitude to all parties involved in this study.
 Journal of Rock Mechanics and Geotechnical Engineering2024年2期
- Journal of Rock Mechanics and Geotechnical Engineering的其它文章
- Determination of uncertainties of geomechanical parameters of metamorphic rocks using petrographic analyses
- On the calibration of a shear stress criterion for rock joints to represent the full stress-strain profile
- Effect of dynamic loading orientation on fracture properties of surrounding rocks in twin tunnels
- Experimental study on the influences of cutter geometry and material on scraper wear during shield TBM tunnelling in abrasive sandy ground
- Effect of fracture fluid flowback on shale microfractures using CT scanning
- Mechanical behaviour of fiber-reinforced grout in rock bolt reinforcement