
Binary outcome variables and logistic regression models
2011-07-18 11:38XinhuaLIU
上海精神医学 2011年5期
Xinhua LIU
·Research Methods·
Binary outcome variables and logistic regression models
Xinhua LIU
Biostatistics in Psychiatry(5)
Biomedical researchers often study binary variables that indicate whether or not a specific event,such as remission of depression symptoms,occurs during the study period.The indicator variable Y takes two values,usually coded as one if the event (remission)is present and zero if the event is not present(non-remission).Let p be the probability that the event occurs(Y=1),then 1-p will be the probability that the event does not occur(Y=0). The odds that an event will occur is a quantity defined as the ratio of the probabilities for the presence versus the absence of the event,that is,odds =p/(1-p).Unlike probability p which ranges between zero and one,the odds take non-negative values with values above one indicating the degree to which the target event is likely to be present and values below one indicating the degree to which the target event is likely to be absent.To compare the odds in two groups,one may use the odds ratio,OR=odds1/odds2,where odds1=p1/(1-p1)and odds2=p2/(1-p2)with p1and p2representing the probabilities that the target event is present in group 1 and group 2,respectively.When OR=1 the odds of the event occurring in the two groups are equal; OR>1 indicates that the event is more likely to occur in group 1 than in group 2,while OR<1 indicates the event is more likely to occur in group 2 than in group 1.
In studies with binary outcome variables,to compare the occurrence of the outcome of interest in two groups investigators collect data to estimate the odds ratio and test the null hypothesis of H0:OR=1.Based on the estimates of p1and p2(proportions or rates of occurrence of the event of interest in the two groups),the odds ratio can be computed as a ratio of two estimated odds.As an example,consider a clinical trial of the efficacy of a new treatment for major depression with remission of depressive symptoms as the primary outcome.If the remission rate is 60%in the new treatment group and 42%in the standard treatment group,then the odds of remission is 1.5(0.60/0.40)with the new treatment and 0.7241(0.42/0.58)with the standard treatment.The odds ratio is therefore estimated as 2.0715(1.5/0.7241).Based on the remission rate and the sample size in each group,a 95%confidence interval of the odds ratio can be constructed and a test statistic can be calculated for testing significance.
Logistic regression models are often used to predict the odds that a particular event will occur. The models assume that the odds of occurrence depend on a weighted sum of predictors,where the unknown weights or coefficients are the model parameters.The simplest logistic model has only one predictor X,with the form

The odds of event occurrence are functions of predictor X with coefficients α and β.The model parameters can be interpreted as the intercept(that is,α)and the slope associated with X(that is,β). When the predictor variable X is dichotomous (i.e.,it onlytakes values of zero and one),then α is log(odds)for the group with X=0,and α+β is log(odds)for the group with X=1.Note that since y=log(z)is the natural logarithmic function of z,the inverse function is z=exp(y).Consequently exp(β)is the odds ratio comparing the odds of event occurrence between the two groups(X=1 vs.X=0).In contrast,when the predictor variable X is continuous,then

is the odds ratio for one unit increase in X.The parameter β deserves special attention,as it indicatesthe association between predictor X and the outcome.Specifically,β=0 yields constant odds,indicating independence between event occurrence and the predictor X.The odds of event occurrence will increase with increasing X if β>0,while the odds of event occurrence will decrease with increasing X when β<0.
The multiple logistic regression models may include more predictors,X1,…,Xm(m>1),which can be written as

When none of the predictors is a function of other predictors(that is,the included variables are independent of each other),the predictors in the model are additive and the model is considered an additive model.The coefficient of each predictor(i.e.,β1,β2,…βm)is interpreted as the log(OR)for a unit change in the predictor while keeping the other predictors constant.As an example,consider a study of a new treatment for major depression.Suppose that the primary outcome is the remission of depressive symptoms in the six months after the treatment.Let X1be a group indicator with zero for standard treatment and one for a new treatment; and let X2be the baseline score of depressive symptoms.The logistic model with two main predictors has the form,

The quantity exp(β1)will be the odds ratio comparing the odds of remission of depressive symptoms among subjects receiving the new treatment with that of subjects receiving the standard treatment for those subjects who have the same baseline score of depressive symptoms.Similarly,exp(β2)is the odds ratio comparing the odds of remission of depressive symptoms between those who received the same treatment but differed by one unit score on the baseline scale for depressive symptoms.
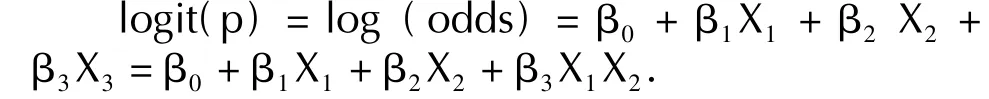
When a predictor is created as a function of original predictor(s)or is closely correlated to another predictor in the model,caution has to be made when interpreting model parameters because the interaction of these variables changes the interpretation of the odds ratios.As an example,let X3= X1X2,which is the term for the X1by X2interaction. Then the logistic model with three predictors becomes
Models like this that include interaction terms are called interactive models.In the above example,consider a patient with baseline score m for depressive symptoms,that is,X2=m.The treatment effect for this patient is given by the odds ratio comparing the odds of remission of depressive symptoms with the new treatment compared to that with standard treatment,which turns out to be exp (β1+m β3)according to the interactive model given above.To see this,we substitute X2=m into the model,resulting in two terms related to treatment effects:β1X1and β3X1m;combining the two terms,we have the overall treatment effect term given by (β1+m β3)X1.Thus the treatment effect for this patient on the odds ratio scale is exp(β1+m β3).
Now consider another patient whose baseline score is one unit higher than the mean,i.e.,X2=m +1.The treatment effect for this patient is given by exp(β1+(m+1)β3).Therefore,under the interactive model,these two patients do not have the same treatment effect.How different are the treatment effects between these two patients?The ratio between the treatment for the second patient,exp(β1+(m+1)β3),and the treatment effect for the first patient,exp(β1+mβ3),is exp(β3),which shows that β3is the interaction between treatment and baseline score for depressive symptoms.More specifically,for every unit increase in baseline score,the treatment effect changes by a factor of exp (β3).
The additive model with two main effects predictors is a special case of the interactive model with β3=0,which indicates that the association of the baseline depressive symptoms with the outcome does not differ between standard and new treatment groups.Therefore,testing the null hypothesis H0:β3=0 versus the alternative hypothesis H1:β3≠0 will determine whether or not the interaction term needs to be included in the model.(Editor’s note:Further discussions of interactive models will be given in a future column in this series.)
In prospective studies logistic models may also help predict the probability of event occurrence for given values of the predictors,because p=1-{1/[1 +exp(η)]}with η=β0+β1X1+…+βmXmcan be calculated using the estimated parameters of β0,β1…βmfrom the study data.For example,using the previous additive model with two predictors of remission from depression after treatment where model parameters β0,β1and β2have values of-0.143,0.716 and-0.025,respectively,a patient with a baseline depressive symptom score of 10 who was receiving the new treatment would have a predicted probability of remission of 0.580(=1-{1/[1 +exp(-0.143+0.716-0.025x10)]})while a patient with a baseline score of 10 receiving standard treatment would have a predicted probability of remission of 0.403(=1-{1/[1+(exp(-0.143-0.025x10)]}).
The major statistical software packages such as SAS,SPSS,STATA,R,S+all include procedures toimplement logistic regression analyses that fit models to the data collected.In addition to describing the specified model,the output usually includes estimated model parameters,95%confidence intervals,p-values for testing hypotheses on the model parameters of interest,goodness of fit measures and other important information.
1. Hosmer DW Lemeshow S.Applied Logistic Regression.2nd ed. John Wiley&Sons,Inc.,NJ,USA,2000.
2. Fleiss LJ,Levin B,Paik MC.Statistical Methods for Rates and Proportions.3rd ed,John Wiley&Sons,Inc.,NJ,USA,2003.
Dr.Xinhua Liu is an associate professor at the Department of Biostatistics in the Mailman School of Public Health at Columbia University.Her research interests include 1)statistical analysis of various type of data in the epidemiological,clinical and laboratory studies related to metal health and environmental health sciences;2)development of statistical methods with applications in psychiatric research;3)modeling functional decline of patients with Alzheimer's disease;4)evaluating concordance correlation among raters for measurement subject to right censoring;5)non-parametric selection of items in the screening scales,etc.
第九届西部精神医学论坛征文通知
第九届西部精神医学论坛预定于2010年7月在四川省成都市召开,本次会议由西部精神医学协会主办。会议征文内容:
板块一:精神病学
1.精神疾病治疗新技术;
2.精神病院的管理及相关法律问题;
3.精神病患者的康复和回归;
4.司法精神病学的理论和实践;
5.精神病学教学法研究;
6.精神科合理用药。
板块二:联络会诊医学
1.心身健康;
2.心身疾病的教学法研究;
3.心身疾病的危险因素研究;
4.心身疾病的临床综合干预;
5.心身疾病的全面康复;
6.健康管理。
板块三:社会心理
1.女性及儿童青少年心理健康;
2.灾后危机干预;
3.网络与生活;
4.恋爱、婚姻家庭及性心理;
5.民众心理教育。
请将论文及摘要、正文、参考文献以E-mail形式发往论坛秘书组张波老师邮箱zb_73@126.com(咨询电话:18980602051),并请注明同意以何种形式(全文/摘要)在论文集(光盘)上登出。论文征集截稿时间:2012年5月15日前(以电子邮件日期为准)。
西部精神医学协会
2011年10月8日
10.3969/j.issn.1002-0829.2011.05.012
Department of Biostatistics,Mailman School of Public Health,Columbia University New York,NY,USA.
E-mail:xl26@columbia.edu
猜你喜欢
学苑创造·A版(2022年8期)2022-06-21
基层中医药(2021年8期)2021-11-02
世界睡眠医学杂志(2021年4期)2021-07-03
世界睡眠医学杂志(2021年1期)2021-03-18
世界睡眠医学杂志(2021年1期)2021-03-18
科学生活(2020年7期)2020-08-11
世界睡眠医学杂志(2019年12期)2020-01-13
实用老年医学(2016年9期)2016-10-14
陕西教育·高教版(2015年9期)2015-02-28
中国全科医学(2011年18期)2011-08-15

- 上海精神医学的其它文章
- 精神分裂症的全基因组关联分析研究
- ComParison of the neuroPsychological characteristics of two subtyPes of mild cognitive imPairment
- Randomized controlled trial comParing quetiaPine with lithium and clozaPine with lithium in the treatment of female Patients with mania
- Changes in the level of micro RNA-206 gene exPression in Patients with tyPe I biPolar disorder before and after treatment and comParison with a control PoPulation
- Case-control study of changes in bone mineral density in drug-naïve Patients in the first-ePisode of schizoPhrenia during the first year of treatment with risPeridone
- Differences in the levels of suPeroxide dismutase and brain-derived neurotroPhic factor in first-ePisode schizoPhrenia,chronic schizoPhrenia and normal control subiects