
DEVELOPMENT AND PRELIMINARY APPLICATION OF OBJECTIFYING SYSTEM FOR TCM COLOR INSPECTION
2012-10-08 12:10ZhengDongmeiDaiZhendongWangHongmo
Zheng Dongmei,Dai Zhendong,Wang Hongmo
(1.College of Mechanical and Electrical Engineering,Nanjing University of Aeronautics and Astronautics,Nanjing,210016,P.R.China;2.Software School,North University of China,Taiyuan,030051,P.R.China;3.School of Chinese Medicine,Capital University of Medical Sciences,Beijing,100069,P.R.China)
INTRODUCTION
Color inspection(CI)is adiagnosis method of traditional Chinese medicine(TCM), which diagnoses the illness through observing the patient′s face color.It can recognize thelocation,property and evolution of disease,so it is the key point in clinical examination[1]. However,traditional CIis carried out by doctor′s eyes in the natural light and depicted in doctor′s words.Therefore,it is subjective and lack of objective quantitative information. Along with further development of the TCM clinical modernization,the new requirement of objective and quantitative color inspection of traditional Chinese medicine(CITCM)is proposed.In order to increase its clinical value,it is the inevitable direction that CITCM is studied by the modern scientific technologies.
The methods for objectifying researches on CITCM can be classified into the following two categories:(1)Early methods,which began in the 1970s,color measureinstruments are used for measuring complexion[2-3];(2)Recent method,which began after 2000s,digital image processing technologies are used. Spectrophotometer,colorimeter and photoplethysmograph used for studying CITCM all belong to the early methods[3].In the early methods,thestandard of color measurement varies according to the different instruments,also the measured spot is not unified,so the measurement results cannot be compared and the data cannot directly perceived through the senses.In the recent methods,facial image is taken under a standard artificial light source imitating daylight and the chromaticity of special region(SR)is achieved through image processing technologies. Therefore,the results are more intuitive and robust.
Image processing technology has been successfully applied to medical field. Digital image processing based modern tongue inspection has achieved laudable findings.Tongue imaging and analysis instruments have been developed to acquire digital color tongue images.Approaches have also been created for quantitative analysis and qualitative description of tongue′s color,fur,thickness,moisture,curding,greasiness,and cracks[4].Relative to the tongue research,the objectification study of CITCM based on the digital image technologies has just started.The only domestic research of Shanghai University about TCM has been reported.They designed and manufactured a black box used to take facial images,and its inner wall was painted black.A ring-like LED with color temperature of 4 000—11 000 K was selected as light source.A facial image program was developed to classify complexion as blue,red,yellow,white and black.They made a preliminary diagnosis of skin color[5].
Three kinds of improvements to the CITCM study are made in this paper.Firstly,a standard light source setting imitating daylight is manufactured,so that facial images can be taken more clearly without variation of environment.Secondly,according to the CITCM SR definition theory, an image processing program is developed,which is used to extract the CI SRs corresponding to five internal organs, and calculate the chromaticity.Thirdly,83 samples of 30 young and 53 elderly peolpe are carried out to test the system,and the experimental results show the significant difference of SRs between the young and the elderly people.
1 IMAGE ACQUIRING DEVICE
As a kind of device to acquire CITCM images,it mainly includes five parts: Light source,integrating sphere,CCD digital camera,box-type base, and test equipments. The following gives a brief introduction of the device buildup,which emphasizes its form.
1.1 Construction of device
Fig.1 is theschematic drawing of color image acquiring device in the CITCM objectification system. The high-pressured xenon lamp with color temperature of 5 500 K and color rendering index of 95% is selected as the light source,which can generate light beam like daylight.There are two independent xenon lamps,and their beams areguided into theintegrating sphere respectively by two groups of Quartz fiber whose optical transmissibility≥80%.
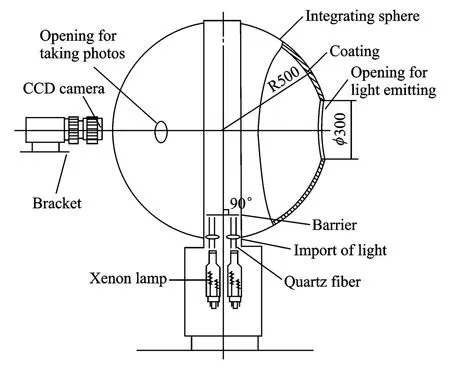
Fig.1 Schematic drawing of CITCM image acquiring device
The integrating sphere provides a standard lighting condition, which can diffuse light uniformly. The shell of integrating sphere is made up of stainless steel of 3 mm thickness and 1 000 mm diameter.Theinner wall is coated with PTFE aerosol resin evenly,whose reflectivity is bigger than 0.98 within 450—800 nm and bigger than 0.96 within 380—450 nm.According to the size of human head, one 300 mm diameter opening is made for taking facial images.On the opposite position and on the left and the right sides at an angleof 45°to the centre of the circle,there are three 60 mm diameter openings for CCD digital camera.Two 22 mm diameter holes for entrances of light beams are at the bottom of the integrating sphere,and two barriers are installed upon each hole to prevent the light beam transmitting directly into the sphere.The total opening surface area is 7.99 dm2,much lower than 10%of 314.16 dm2sphere surface area,and meets the design requirement.
EOS50D SLR camera and EF 50 mm f/1.4 standard USM lens are selected for taking color image, which are all produced by Canon Corporation.The camera offers high quality and normal shooting mode, whose resolution is divided into large(4 752 pixel×3 168 pixel),medium(3 456 pixel×2 304 pixel)and small(2 352 pixel×1 568 pixel)types.Image files are saved as RAW or JPEG format. The digital camera is put on a bracket fixed on the sphere shell,and its lens is put into the shot hole.
Box-type baseis under the device supporting and fixing the integrating sphere.Xenon light sources are in the box.When it works at higher temperature,the heat cannot affect human facial blood circulation to avoid causing color interference.
Testing equipments of image acquiring device include a full digital Chroma meter XYC-I and a color-checker card.XYC-I can test tristimulus values, chromaticity, color difference, color temperature,and illumination of light.The colorchecker card is a range of color standard. It includes a total of 24 pure color blocks which are saturated color,unsaturated color,colored,noncolored.In this paper,card images are taken in different illumination of light source environment to test the chromaticity uniformity of color photos.
1.2 Image gathering
When gathering CITCM images, the laboratory is darkroom environment, the temperature is about 25℃.We set the standard light environment illumination 1250Lx,the color temperature 5 500 K,the CCD camera shutter speed 1/80 s,aperture 2.8,ISO 100,white balance to daylight type,high quality shooting mode,and JPEG image file format.CITCM image collection requirements: The staff cannot put on facial make-up,do strenuous activities and drink on thesampling day.They must wash their faces and have a rest for 20 min before taking photos.Image shooting attentions:Do not wear glasses and hat,do not cover facial features and forehead by hair,relax facial muscles,keep natural expression,sit in a chair in front of the acquiring device,turn the head to face the sphere opening,keep the face perpendicular to the ground,and open eyes looking at the opposite camera hole.
2 CITCM DIGITAL IMAGE PROCESSING
The theory of CITCM is that facial color can reflect human disease,because different SRs of the face intrinsically linked with the five internal organs. The elliptical region between two eyebrows,the region between two eyes,the region on the bridge of nose,and the tip area of the nose are corresponding to the lungs,the heart,the liver,and thespleen respectively.Two kidneys are related to the left and the right cheeks.
In this section,an algorithm is described for detecting human faces using color information,then identifying and pin-pointing facial features through segmentation,last extracting SRs by morphology techniques and calculating their chromaticity in RGB and Lab color spaces.The algorithm is divided into three steps: (1)Supervised skin/non-skin color classification,(2)eyebrow,eye,nostril and mouth localizations[6],(3)SR extraction[7]and chromaticity calculation.The following provides a detailed explanation of the algorithm.
2.1 Supervised skin/non-skin color classif ication
Fig.2(a)is taken by the CITCM image acquiring device,and its scene is a uniform background. The image is an upright"mugshot".Facial pattern appears as a frontal facial view,and two eyebrows,two eyes,nose and mouth are visible within the facial region.

Fig.2 Skin/non-skin color classification
A common representation of color images is used by red(R),green(G),and blue(B)tristimulus values.First Fig.2(a)is converted to gray image in accordance with the formula:Gray=0.30× R+ 0.59× G+ 0.11× B,then its histogram is obtained(Fig.2(b)).In Fig.2(b),the first peak is black hair part and the background,and the second peak is facial region whose chromaticity rangeis from 150 to 230.The lowest valley between the first and the second peaks is selected as the threshold value utilized for classification.Then,the skin segmentation is performed on a pixel-by-pixel basis in accordance with Eq.(1),where a pixel is classified as skin if its chromaticity is bigger than threshold k,otherwise,it is classified as non-skin. Those regions within the skin map classified as non-skin colored are defined as"holes",so,theeyebrows,eyes,nostrils and mouth can be seen in the"skinsegmentation"map shown in Fig.2(c).

The converted result is a black and white binary image,the skin pixel value is 0,other pixel value is 1.Thereare some small interfering holes or dots in skin region except facial features,but these holes usually are smaller than facial features. Through statistics of some training images,a universal filtering threshold is yields,which can eliminate those interference regions.Finally,images after filtering only have facial features in skin region.The results indicate that color can serve as a powerful initial classifier for locating skin regions.
2.2 Eyebrow, eye, nostril and mouth localizations
After the facial pattern is classified,the next goal is to identify and pin-point facial features.This procedure is composed of three steps.The first step separates facial features and generates independent features images.In black and white facial image contours, there are seven independent"holes"appearing different connected regions.Every faculty of seven facial features can be separated and independent facial feature images are generated by labeling each independent connected region. In the second step, the coordinates of every facial feature can befound by scanning each independent facial feature image in row and column sequence respectively.In the third step, the coordinates are sorted in accordance with the position of facial features.
If upper left corner of an image is defined as the origin of coordinates, the facial feature coordinates on image are shown in Table 1.Each line of numbers is used to indicate the position of every facial feature.For example,the data of positions(2,1),(2,2)are row and column coordinates 381,114,which indicate the extreme left point of the left eyebrow.From Table 1,it can be seen that the coordinates are fully consistent with the position of features on face.
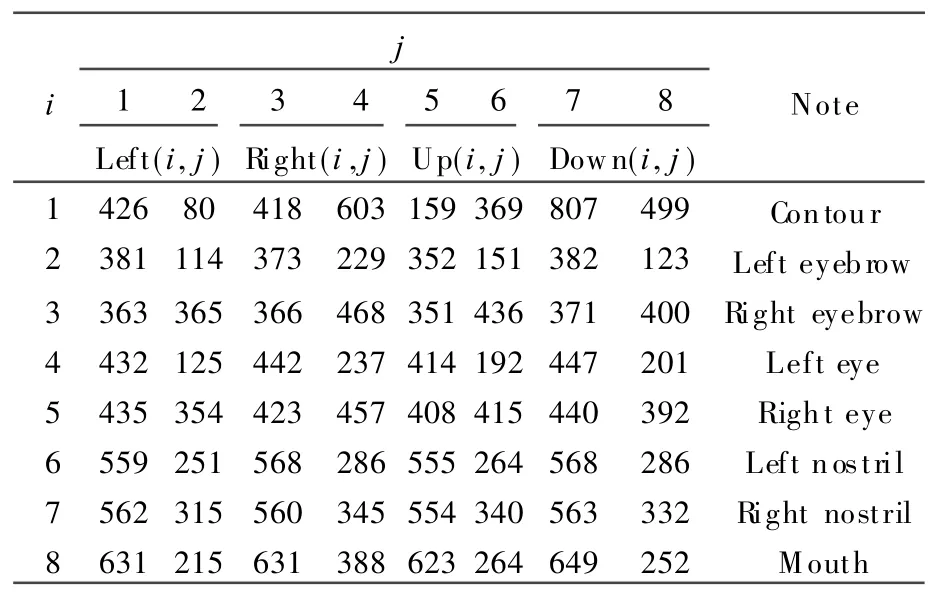
Table 1 Coordinates of facial features
2.3 SR extraction and chromaticity calculation
On the basis of the coordinates in Table 1,any facial region can be extracted.This procedure can be implemented in the following four steps:(1)Mask image making,(2)mask operation on the original image,(3)edgedetection of SR,(4)SR indication on the original image.Take the glabella elliptic region as an example, the following gives detailed instructions for extracting SR of lungs.
In the first step,create a black background with samesize of the original image,calculate the ellipse center point and the major axis according to coordinates of left and right eyebrows in Table 1,the formulae are as follows

where r and c denote the row and column coordinates of the regional center points,w and l the region width and height. Then make an ellipse of given position and size.Because the image is a bit map,whose actual processing object is pixel,so the ellipse drawing do not use the graphics command,but is based on the parameter equations.Finally,the binary image morphological dilation and filling operations are used on the ellipse to generate a mask SRimage of lungs.
In the second step,scanning mask image point-by-point,if the mask pixel value is 1,retain the original RGB pixel values of the same position,and all the remaining pixels are set to 0.The result is a generated SR image of lungs.
The third step is to detect the SR edge of lungs. Scanning mask image point-by-point,leave the pixel whose value is 1,but whose neighbours are not all of 1.Then,a SR edge image is obtained.
The fourth step is to do mask operation on original image by using SR edge image,and the SRlocation of lungs is indicated.Fig.3 marks the SR positions corresponding to five internal organs.
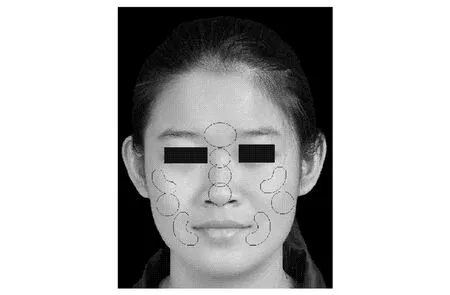
Fig.3 Location image of SRs corresponding to five internal organs
Finally,the chromaticity of SR is calculated corresponding to lung organ in RGB and Lab color space.Put all the color pixel values of SR imageinto three new arrays representing R,G,B chromaticity respectively.Calculate their means of each array as the RGBchromaticity of SRusing Eq.(3).Then translate RGBvalueinto Lab color space,which includes three color channels: L channel is a lightness,a channel color is from red to dark green,b channel is from blue to yellow.Chromaticity of ten SRs is shown in Table 2.Every column shows the chromaticity of one SR in the RGBand Lab color space,but every row is a kind of color values of ten SRs.
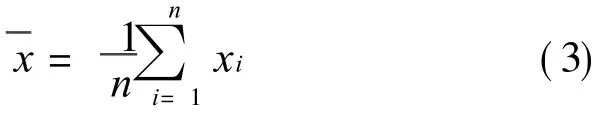
where xi denotes the R,G and B chromaticity of SRimage,the mean of chromaticity,and n the number of pixel of SRimage.
The data in Table 2 show that: (1)The chromaticity values of ten SRs are consistent with human skin color model,R> G,G> B;(2)Each column data are not same,indicating that thereis a considerable diversity in different SRs.

Table 2 Chromaticity of SRs in RGB and Lab color space
3 RESULTSAND ANALYSIS
After the above development is completed,83 samples are collected and images are processed.The sampling people are divided into two groups.The first group of 30 young people(Group I)is at the average age of 24±2,and the second group includes 53 elderly people(Group II)whose average ageis 72±4.
3.1 Chromaticity in RGB and Lab color spaceof 83 samples
The probability distribution map of ten SRs chromaticity is shown in Fig.4.X-axis is the sequence number of SR chromaticity in RGB and Lab color space,and the chromaticity of R,G,B,L,b and a is from right to left in sequence.Y-axis is the accumulative frequency of each chromaticity.
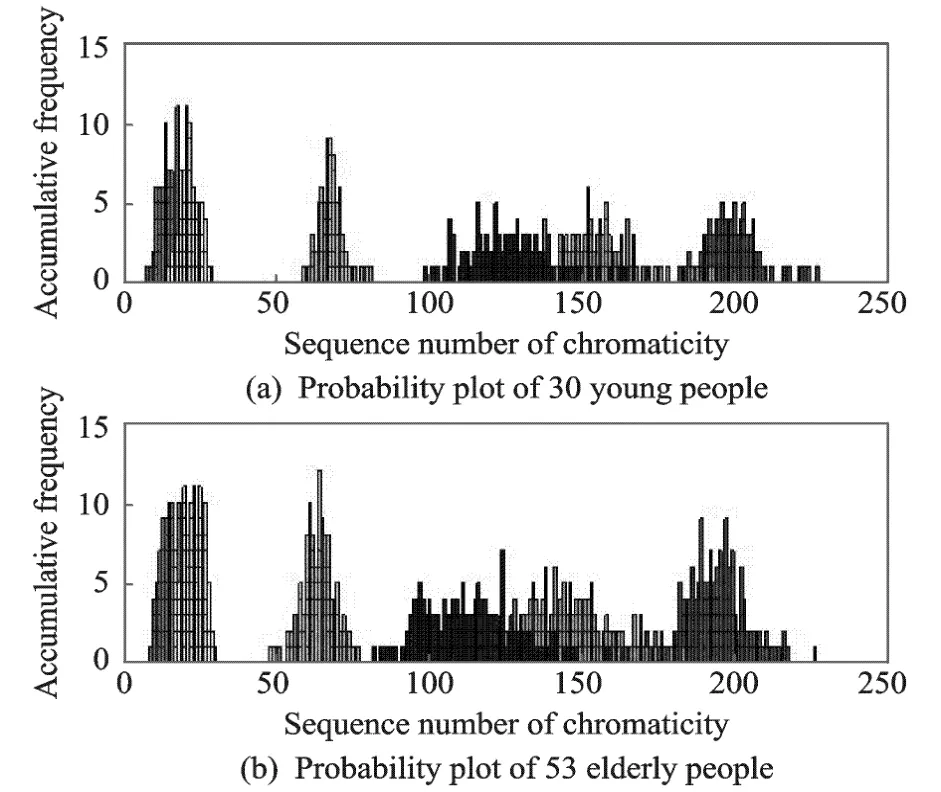
Fig.4 Probability plot of SR chromaticity
Fig.4 shows that the R,G,B and L chromaticity of the young is bigger than that of the elderly,but the a and b chromaticity of the young is less than that of the elderly. It demonstrates that complexion of the young is brighter than that of the elderly and the complexion of the elderly is more red and yellow.This is consistent with observations in our daily lives.
The chromaticity in RGB and Lab space of the overall grouping samples are shown in Table 3. The data reveal the differences in color between grouping samples.
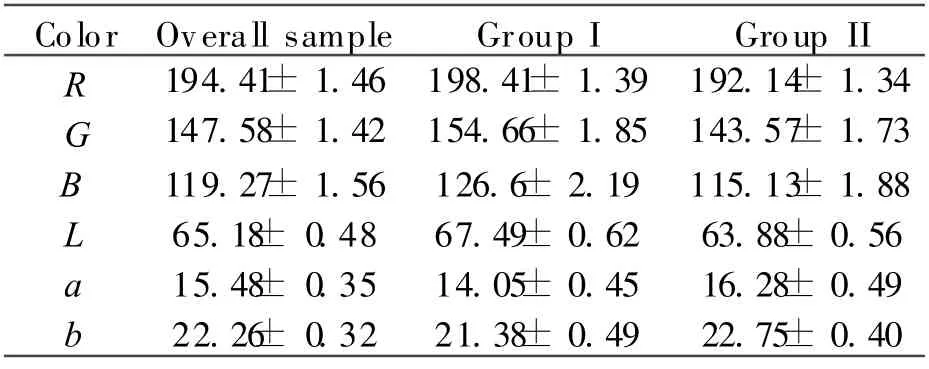
Table 3 Mean chromaticity of diff erent groups
Domestic and foreign scholars have conducted the research on the skin color of different races.The Lab average values of the black and the white people are 37.93,12.15,14.45,66.38,13.32 and 16.93.But the yellow race is between both values.The Lab mean of Japanese cheek skin are 63.98,11.94 and 16.86 measured by Yumiko[8],however the data of Chinese left cheek color are 55.65,13.24 and 17.59 measured by Lin zhongxian[2].The facial color values of 83 samples in this paper are 65.18,15.48 and 22.26.The difference between them is caused by different measuring methods and measuring parts.
3.2 Comparison of SR chromaticity between young and elderly people
Fig.5 is the error bar map of some SRs corresponding to lungs,heart,liver,spleen and kidneys.The left bar denotes mean chromaticity and its error of the young, the right bar attributes the elderly.It shows a clear contrast of R,G,B,L,a and b chromaticity between each SRof the young and the elderly.

Fig.5 Contrast plot of SRchromaticity between young and elderly people
A group independent sample test is carried out with 60 variables for the young and the elderly group by SPSS software.All significant differences are shown in Table 4(keeping the three digits after the decimal point).The data of each column are P of every SR,which reveal the differences of R,G,B,L,a and b chromaticity between the young and the elderly. Table 4 shows that the complexion difference is apparent as there are at least three items of P<0.05 in every column,but the kidney SR have the great statistical discrepancy because there are five even six items of P<0.05.That is,the complexion difference of check between the young and the elderly is the most significant.
According to TCM theory,the kidneys store abundant vigor in people′s youth.When human body gradually grows up and matures,thekidney is slowly deficient.After the middle age,the body is gradually aging. An investigation has been conducted on 235 people over 20-year old,the kidney deficiency rate of 30-year old people is 58%,40-year old is 71%,50-year old is 80%,60-year old is 90%,and 70-year old is 95%.It can be seen that percentage of the kidney deficiency rate increases when the age increases progressively.The facial symptoms of kidney deficiency are appearance of early aging,black pouches,dull complexion,skin rough and dry,appear wrinkles,spots,middle-aged acne,and lacks of elasticity.The significant difference of kidney SR between the young and the elderly in this paper is consistent with the above conclusion.
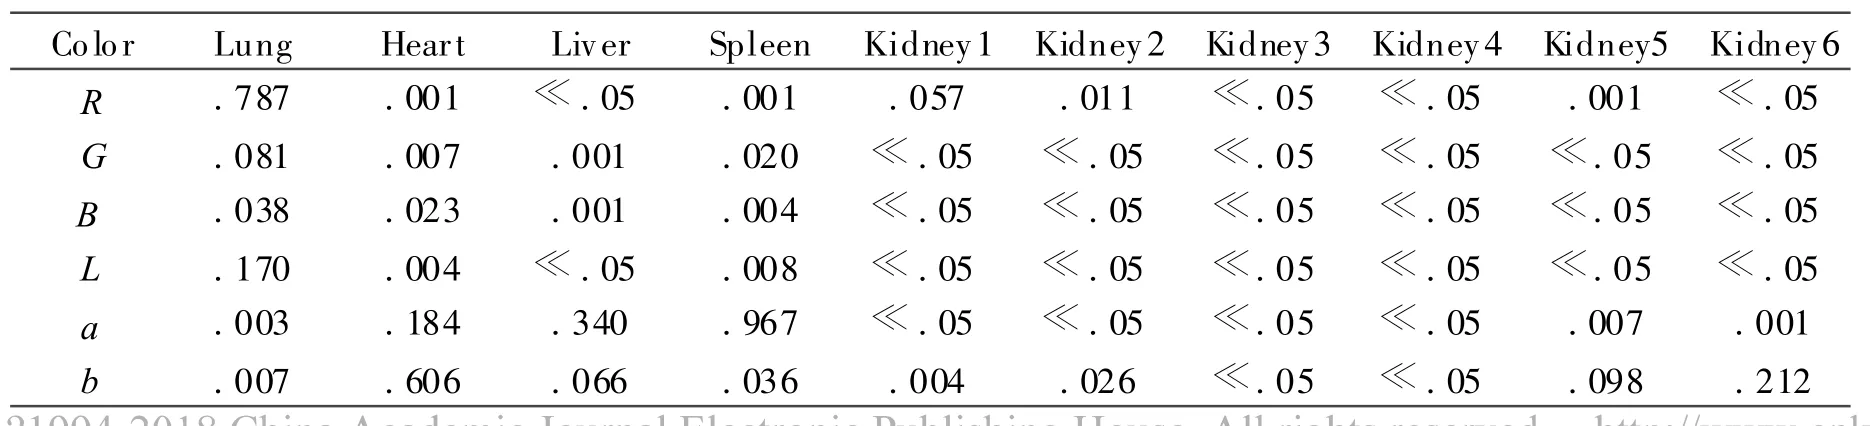
Table 4 Statistical signif icant dif ference of SRs between young and elderly people
4 CONCLUSION
For the need of objectification research in CITCM,an objectifying system is developed.It consists of two parts:An imageacquisiring device under a standard lighting condition,and the special purpose software developed by a combined useof thedigital image processing technology and the SR theory of CITCM.The standard light environment is mainly composed of the xenon lamp with 5 500 K color temperature and adjustable illuminance within the range of 500—4 000 Lux,and an integrating sphere with the reflectivity greater than 96%. The image processing procedure can be divided into three steps. Firstly, the skin color/non-skin color classification is performed by using color threshold. Secondly, the facial features are located by using image segmentation and coordination sorting.Thirdly,the SR extraction and chromaticity calculation are achieved by utilizing mask operation. Subsequently, 83 samples of the normal young people and the elderly face image are sampled and processed.The chromaticity difference between the young and the elderly is analyzed.Statistical discrepancy indicates that the cheek complexion has the greatest differencein all SRs.This result verifies that percentage of the kidney deficiency rate increases when the age increases progressively.The experiment shows that the systemis effective on the CITCM objectifying study and is the basis for the further research.
[1] Wang Hongmo,Traditional Chinese medicine facial complexion diagnosis[M].Beijing:China Academic Press,2009.(in Chinese)
[2] Ling Zhongxian, Peng Ruixiang, Sun Xiuru.Determination of Chinese adult skin color chromaticity[J].Chinese Science Bulletin,1979,10:475-477.(in Chinese)
[3] Shao Longquan,Zhao Xinyi,Zhao Yimin,et al.Collection and analysis of maxillofacial skin chromatic value of the residents in Xi′an area[J].Journal of Practical Stomatology,1999,15(4):274-276.(in Chinese)
[4] Shen Lansun,Cai Yiheng,Liu Changjiang,et al.Recent advances in TCM tongue manifestation information acquisition and analysis [J]. World Science and Technology/Modernization of Traditional Chinese Medicine and Materia Medica,2007,9(5):97-101.(in Chinese)
[5] Li Fufen,Di Dan,Wang Yiqing,et al.Computer based information acquisition and recognition for complexion diagnosis [J]. World Science and Technology/Modernization of Traditional Chinese Medicine and Materia Medica,2008,10(6):71-76.(in Chinese)
[6] Phimoltares S,Lursinsap C,Chamnongthai K.Face detection and facial feature localization without considering the appearance of image context[J].Image and Vision Computing,2007,25(5):741-753.
[7] Wong K W,Lam K M,Siu W C.An efficient algorithm for human facedetection and facial feature extraction under different conditions[J].Pattern Recognition,2001,34(10):1993-2004.
[8] Rubegni P, Cevenini C,Barbini P, et al.Quantitative characterization and study of the relationship between constitutive-facultative skin color and phototype in Caucasians [J].Photochemistry and Photobiology,1999,70(3):303-307.
 Transactions of Nanjing University of Aeronautics and Astronautics2012年4期
- Transactions of Nanjing University of Aeronautics and Astronautics的其它文章
- RELIABILITY EVALUATION MODEL BASED ON DATA FUSION FOR AIRCRAFT ENGINES
- MATHEMATICAL MODEL OF 4He QUANTUM INTERFEROMETER GYROSCOPE
- EFFICIENT NUMERICAL METHOD FOR DYNAMIC ANALYSIS OF FLEXIBLE ROD HIT BY RIGID BALL
- TASK ALLOCATION BASED ON PHEROMONE
- FLIGHT CONFLICT FORECASTING BASED ON CHAOTIC TIME SERIES
- FPGA BASED REAL-TIME VIDEO IMAGE ACQUISITION AND STORAGE SYSTEM