
Characteristics of phosphorus adsorption by sediment mineral matrices with different particle sizes
2013-06-22 13:25YangXIAOXiaolianZHUHaokeCHENGKaijieLIQiLUDongfangLIANG
Water Science and Engineering 2013年3期
Yang XIAO, Xiao-lian ZHU Hao-ke CHENG Kai-jie LI* Qi LU Dong-fang LIANG
1. State Key Laboratory of Hydrology-Water Resources and Hydraulic Engineering, Hohai University, Nanjing 210098, P. R. China
2. College of Water Conservancy and Hydropower Engineering, Hohai University, Nanjing 210098, P. R. China
3. National Engineering Research Center of Water Resources Efficient Utilization and Engineering Safety, Hohai University, Nanjing 210098, P. R. China
4. Department of Engineering Mechanics, Shanghai Jiao Tong University, Shanghai 200240, P. R. China
5. MOE Key Laboratory of Hydrodynamics, Shanghai Jiao Tong University, Shanghai 200240, P. R. China
Characteristics of phosphorus adsorption by sediment mineral matrices with different particle sizes
Yang XIAO1,2,3, Xiao-lian ZHU2, Hao-ke CHENG2, Kai-jie LI*2, Qi LU2, Dong-fang LIANG4,5
1. State Key Laboratory of Hydrology-Water Resources and Hydraulic Engineering, Hohai University, Nanjing 210098, P. R. China
2. College of Water Conservancy and Hydropower Engineering, Hohai University, Nanjing 210098, P. R. China
3. National Engineering Research Center of Water Resources Efficient Utilization and Engineering Safety, Hohai University, Nanjing 210098, P. R. China
4. Department of Engineering Mechanics, Shanghai Jiao Tong University, Shanghai 200240, P. R. China
5. MOE Key Laboratory of Hydrodynamics, Shanghai Jiao Tong University, Shanghai 200240, P. R. China
The particle size of sediment is one of the main factors that influence the phosphorus physical adsorption on sediment. In order to eliminate the effect of other components of sediment on the phosphorus physical adsorption, the sediment mineral matrices were obtained by removing inorganic matter, metal oxides, and organic matter from natural sediments, which were collected from the Nantong reach of the Yangtze River. The results show that an exponential relationship exists between the median particle size (D50) and specific surface area (Sg) of the sediment mineral matrices, and the fine sediment mineral matrix sample has a larger specific surface area and pore volume than the coarse sediment particles. The kinetic equations were used to describe the phosphorus adsorption process of the sediment mineral matrices, including the Elovich equation, quasi-first-order adsorption kinetic equation, and quasi-second-order adsorption kinetic equation. The results show that the quasi-second-order adsorption kinetic equation has the best fitting effect. Using the mass conservation and Langmuir adsorption kinetic equations, a formula was deduced to calculate the equilibrium adsorption capacity of the sediment mineral matrices. The results of this study show that the phosphorus adsorption capacity decreases with the increase ofD50, indicating that the specific surface area and pore volume are the main factors in determining the phosphorus adsorption capacity of the sediment mineral matrices. This study will help understand the important role of sediment in the transformation of phosphorus in aquatic environments.
sediment mineral matrix; particle size; specific surface area; pore volume; phosphorus adsorption
1 Introduction
Phosphorus is a major nutrient in aquatic systems, which needs to be managed to avoid eutrophication. The distribution and transport of soluble reactive phosphorus (SRP) in riversare strongly influenced by processes involving the interactions of phosphorus with suspended and bed sediments (House et al. 1995). Sediments can act as a sink or source in phosphorus transport and transformation within the bed layer and water column (Withers and Jarvie 2008).
Natural sediments consist of a number of components, including minerals, organic matter, and activated metal (hydro-) oxides (Zhang et al. 1990), which play a major role in the adsorption of phosphorus onto sediments. Among these components, the minerals usually have a dual contribution to the sorption of pollutants. Namely, they not only serve as a very effective sorbent of environmental pollutants for their high porosity and large surface area (Koeppenkastrop and De Carlo 1992; Schroth and Sposito 1998; Evans et al. 2004; Sánchez-Martín et al. 2008), but also as the matrix of organic matter and metal (hydro-) oxides (Jenne 1968; Tang et al. 1981). Thus, they indirectly affect the pollutant adsorption onto sediments. Consequently, for a better understanding of the interaction of phosphorus with sediments, it is necessary to study the characteristics of phosphorus adsorption by the sediment mineral matrix. Some studies have demonstrated that the adsorption capacity of sediment was related to sediment components, such as organic matter, Fe/Al/Mn hydroxides, clay, and CaCO3(Wang et al. 2007; Wang et al. 2012). However, less research has been conducted on the surface properties of the sediment mineral matrix, and the phosphorus adsorption by the sediment mineral matrix.
The objectives of this study were to investigate the variation of the specific surface area and pore volume of the sediment mineral matrix with its particle size, and the adsorption kinetics and isotherm of phosphorus by the sediment mineral matrix.
2 Materials and methods
2.1 Sampling and pretreatment
The sediment samples were taken from 5 cm below the bed level at three sites on the Nantong reach of the Yangtze River, mixed thoroughly in an air-sealed plastic bag, and transported to the laboratory. Collected samples were then air-dried and stored at 4℃.
The sediment samples were gently stirred to break up the large particles and divided into three groups using mechanical vibratory sieving: D0 (0 to 63 μm), D3 (63 to 92 μm), and D4 (92 to 125 μm). The pipette method was used to further divide D0 into two sub-groups: D1 (0 to 30 μm) and D2 (30 to 63 μm).
The inorganic matter, metal oxides, and organic matter, which were attached to the surface of natural sediments, were removed via chemical extraction methods to obtain the sediment mineral matrix samples. The specific extraction procedure is as follows (Fang et al. 2008):
(1) The graded sediments were put into beakers with 30% hydrogen peroxide and stirred with a glass rod until the bubbling phenomenon stopped.
(2) The upper solutions were removed, and 200 mL of deionized water was added into the beakers. The sediment samples were then moved to centrifuge tubes and centrifuged for 5 min. The upper solutions in the centrifuge tubes were removed, and the gathered sedimentparticulates were put into the beakers again.
(3) Hydrochloric acid was added into the samples in the beakers and stirred with a glass rod until the bubbling phenomenon stopped.
(4) Steps (2) and (3) were repeated three times.
After the extraction, the inorganic matter, metal oxides, and organic matter were regarded to be completely removed. The obtained sediment mineral matrix samples were dried and stored in vials prior to the adsorption experiments.
2.2 Sediment mineral matrix analysis
The particle size analysis of the sediment mineral matrix was performed using a LS 13320 Saturn Digisizer. The specific surface area, pore distribution, and pore volume of the sediment mineral matrix samples were analyzed with a JK-BW nitrogen adsorption instrument.
2.3 Sorption kinetic measurements
The dried sediment mineral matrix samples (each of them had a mass of 0.1g) were put into a series of 200-mL reaction bottles with 100 mL of inorganic phosphorus solution (anhydrous KH2PO4) with an initial phosphorus concentration of 2 mg/L. The pH values of the solutions were maintained at 7.50±0.05 by adding 0.01 mol/L of NaOH and 0.01 mol/L of HCl. Each test was carried out three times, and the average results were recorded if the results of the three tests varied within a certain range. All reaction bottles were sealed and incubated at 18±0.3℃ in a thermostatic oscillator at a rotational speed of 190 r/min. The sample solutions were taken at different time (5, 10, 20, 30, 60, 120, 180, 240, 480, and 720 min) and centrifuged immediately at a rotational speed of 5 000 r/min for 10 min. The supernatant was immediately filtered through 0.45-μm Whatman GF/C filters for phosphorus analysis. The total phosphorus concentration in the sediment mineral matrix samples was monitored using the molybdenum-blue complex method (Murphy and Riley 1962).
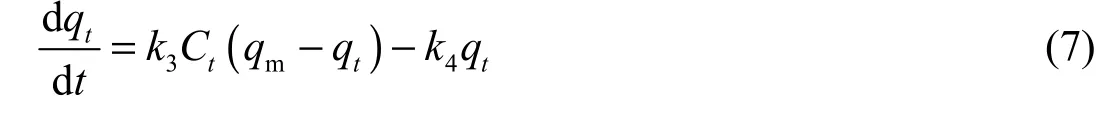
The Elovich equation, quasi-first-order adsorption kinetic equation, and quasi-second-order adsorption kinetic equation (Chien and Clayton 1980) were used to model the adsorption kinetic process. They can be expressed, respectively, as follows:
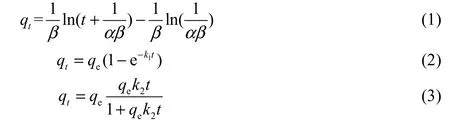
whereqtis the amount of phosphorus adsorbed by the sediment mineral matrix sample (mg/g) at timet,αis the initial adsorption rate (mg/(g·min2)),βis the desorption coefficient (g·min/mg),tis time (min),qeis the amount of phosphorus adsorbed (mg/g) at equilibrium,k1is the rate constant of the quasi-first-order equation (min-1), andk2is the rate constant of the quasi-second-order equation (g/(mg·min)).
2.4 Sorption isotherm measurements
In each isotherm measurement, the dried sediment mineral matrix samples (each of them had a mass of 0.25 g) were put into 300-mL reaction bottles with 250 mL of inorganic phosphorus solution (anhydrous KH2PO4). Each test was performed under ten initial phosphorus concentrations: 0, 0.5, 1, 1.5, 2, 3, 4, 6, 8, and 10 mg/L. The pH values of the solutions were maintained at 7.50±0.05 by adding 0.01 mol/L of NaOH and 0.01 mol/L of HCl. After 12 h of equilibration, the solutions were centrifuged at a rotational speed of 5 000 r/min for 10 min, and the supernatant was immediately filtered through 0.45-μm Whatman GF/C filters for phosphorus analysis. The Langmuir isotherm model and Freundlich isotherm model were used to study the adsorption isotherm. They can be expressed, respectively, as follows:

whereCeis the dissolved phosphorus concentration in solution (mg/L) at equilibrium,qmis the maximum phosphorus adsorption amount (mg/g),K1is the Langmuir adsorption coefficient (L/mg),Kfis the Freundlich adsorption coefficient (mg/g·(L/mg)n), andnis a constant determined by experiments.
3 Results and discussion
3.1 Characteristics of sediment mineral matrix
Fig. 1 shows the particle size distributions of four groups of sediment mineral matrix samples. D1 had the largest nonuniformity, including clay and silt (in the United States Department of Agriculture (USDA) system). Due to the limitation of the analysis method, group D1 could not be further subdivided in the experiment. Particles in D2 were mainly silt, while D3 was fine sand, and D4 was fine-medium sand. The parameters of surface properties for the four groups of sediment mineral matrices are listed in Table 1. Fig. 2 shows that an exponential relationship exists between the median particle size (D50) and specific surface area (Sg), and the rate of increase ofSgis slow from D4 to D2, but very steep from D2 to D1. This indicates that the fine sediment mineral matrix sample has a relatively large specific surface area and pore volume.

Fig. 1 Gradation curves of four groups of sediment mineral matrices

Table 1 Properties of four groups of sediment mineral matrices
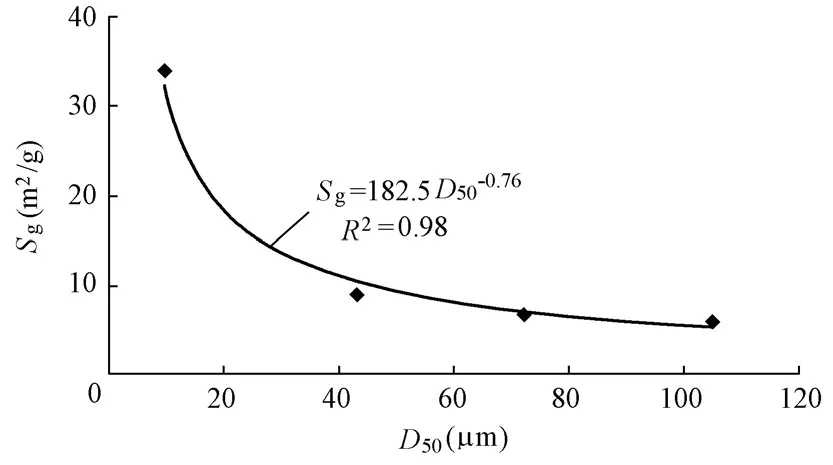
Fig. 2 Relationship between median particle size and specific surface area of sediment mineral matrix
3.2 Adsorption kinetics
Fig. 3 shows the variation ofqtwithtfor four groups of sediment mineral matrices, together with the fitted curves according to the Elovich, quasi-first-order, and quasi-second-order equations. It can be seen that the amount of phosphorus adsorbed is affected by the particle size of the sediment mineral matrix. The kinetic process of the phosphorus adsorption appears to occur in three distinct stages: an initial fast adsorption stage, a relatively gradual adsorption stage, and an eventual equilibrium state where the amount of phosphorus adsorbed reaches a maximum, which has been demonstrated in many studies. D2, D3, and D4 reached the eventual equilibrium in 4 to 5 h. D1 took about 7 h to achieve equilibrium. The results show that the sediment mineral matrix with a smaller particle size has a larger adsorption capacity and needs a longer time to reach the adsorption equilibrium. It can be seen from Fig. 3 that the Elovich equation underestimates the amount of phosphorus adsorbed in the initial rapid adsorption stage, while the quasi-first-order equation overestimates it. In the relatively gradual adsorption stage, on the contrary, the Elovich equation overestimates the amount of phosphorus adsorbed, while the quasi-first-order equation underestimates it. The quasi-second-order equation accurately describes the whole adsorption process.
The values of the parameters in the Elovich, quasi-first-order, and quasi-second-order adsorption kinetic equations are shown in Table 2. Of the three equations, the quasi-second-order equation has the highest correlation coefficient (R2). From Fig. 3 and Table 2, it can be concluded that the quasi-second-order equation provides the best representatio n of the kinetic adsorption process.
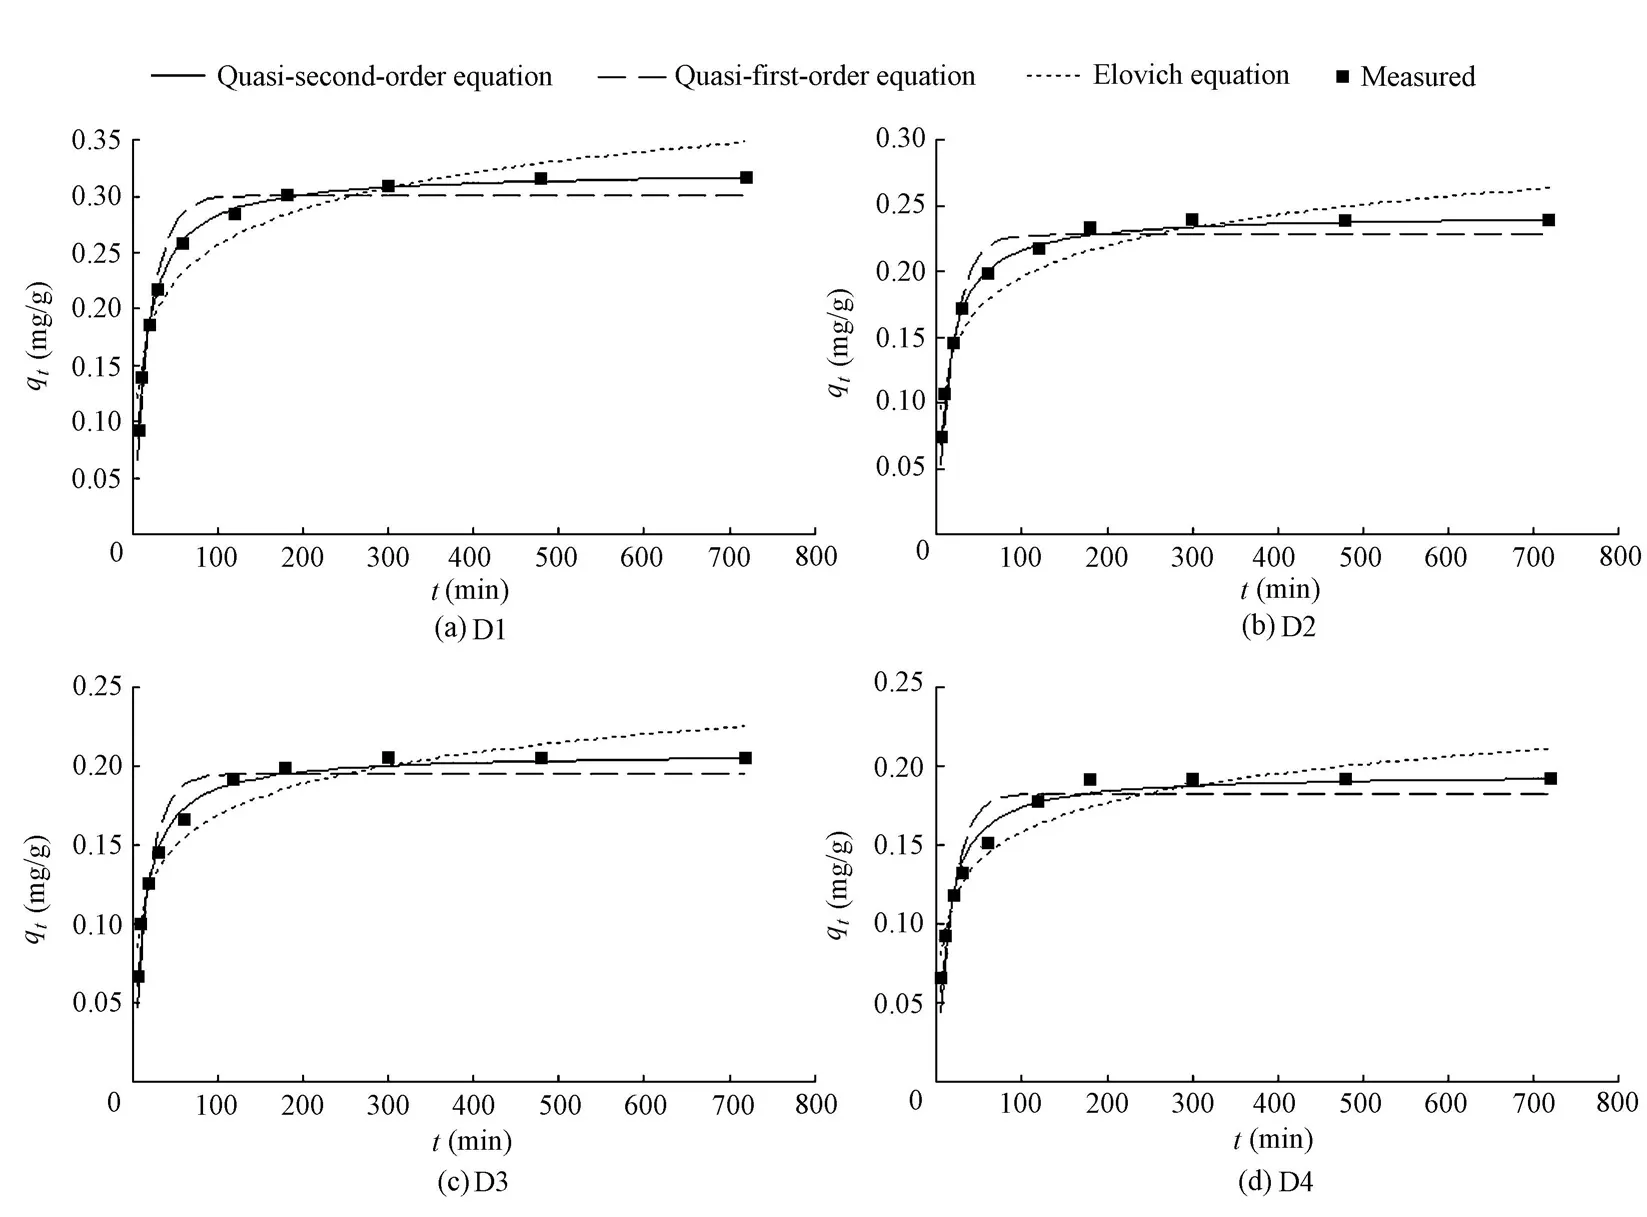
Fig. 3 Observed amounts of phosphorus adsorbed by four groups of sediment mineral matrices and predicted values using three equations
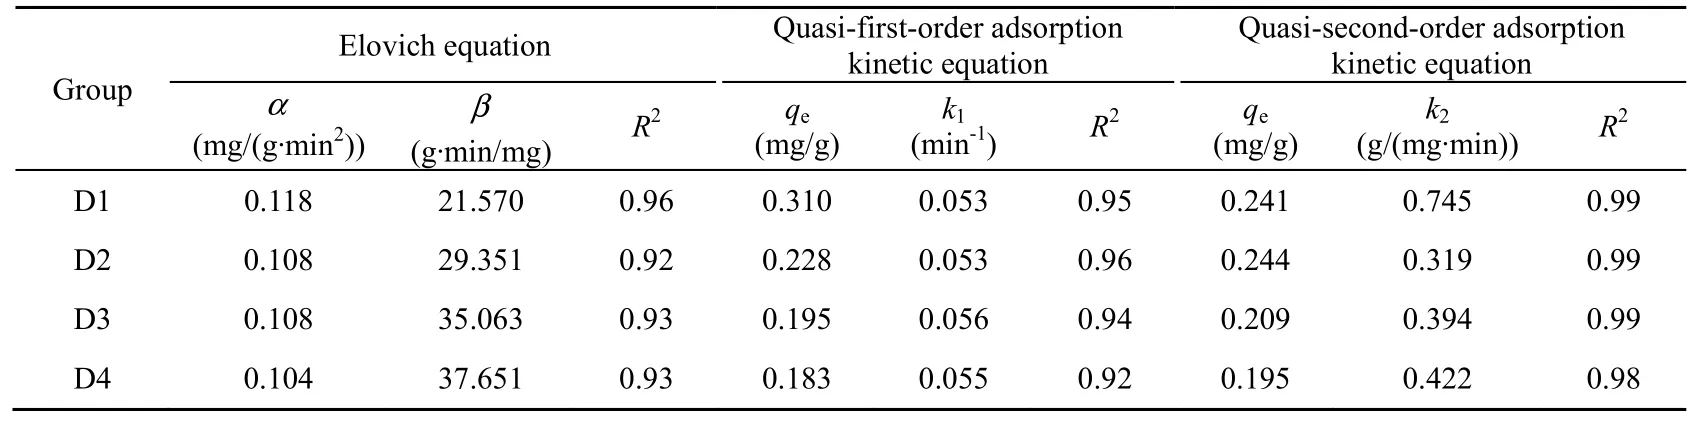
Table 2 Kinetic parameters of different adsorption kinetic equations for different sediment particle sizes
3.3 Adsorption isotherm
3.3.1 Phosphorus equilibrium adsorption of sediment mineral matrices with different particle sizes
As shown in Fig. 4, the phosphorus equilibrium adsorption capacity of D1 is much larger than those of D2, D3, and D4, and the phosphorus equilibrium adsorption capacity decreases with the increase of the particle size of the sediment mineral matrix, which indicates that the phosphorus equilibrium adsorption capacity of the fine sediment mineral matrix is generally larger than that of the coarse sediment mineral matrix.
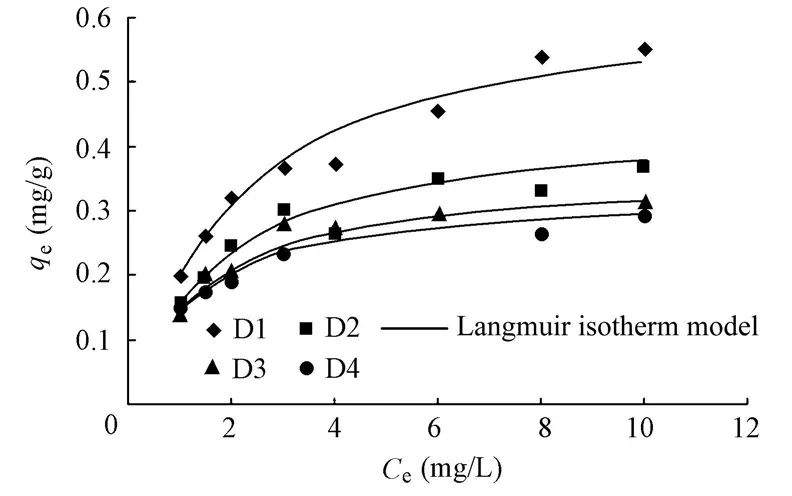
Fig. 4 Adsorption isotherms of sediment mineral matrices with different particle sizes
The parameters in the Langmuir isotherm model and the Freundlich isotherm model are listed in Table 3. From Table 3, it can be concluded that the Langmuir isotherm model better depicts the adsorption isotherm trend with the higher correlation coefficients ranging between 0.98 and 0.99, compared with the Freundlich isotherm model. Table 3 shows that a larger particle size causes a smallerqm, which is in agreement with the relationship between the particle size and equilibrium adsorption capacity discussed above.

Table 3 Parameters in Langmuir and Freundlich isotherm models
3.3.2 Effects of initial phosphorus concentration on equilibrium adsorption capacity
To investigate the effects of the initial phosphorus concentration on the equilibrium adsorption capacity, the Langmuir adsorption kinetic equation was used in conjunction with the mass conservation equation.
The total amount of phosphorus in a reactor, which consists of the dissolved phase and the adsorbed phase, should remain constant at any time. Therefore, the mass conservation equation can be expressed as

The Langmuir adsorption kinetic equation can be expressed as
and the initial conditions are
whereCtis the phosphorus concentration in the solution (mg/L) at timet,Vis the total volume of the solution (L),k3is the adsorption rate coefficient (L/(mg·min)),k4is thedesorption rate coefficient (min-1),sis the sediment mineral matrix concentration (g/L),ρsis the sediment mineral matrix density (g/L),q0is the initial amount of adsorbed phosphorus (mg/g), andC0is the initial phosphorus concentration (mg/L).
If we define, thenandcan be calculated by the following formulae (Huang 2003), which are derived from Eqs. (6) and (7):
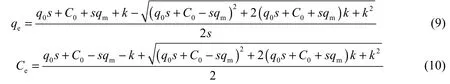
When equilibrium adsorption is achieved, bothqeandCeare dependent on the sediment mineral matrix concentrations, the initial amount of adsorbed phosphorusq0, the initial phosphorus concentrationC0, and the adsorption-desorption characteristics of the sediment mineral matrix, such as the maximum phosphorus adsorption amountqm, and the ratio of the desorption rate coefficient to adsorption rate coefficientk.
The influence ofC0onqecan be evaluated using Eq. (9). The theoretical prediction is in agreement with the experimental results as shown in Fig. 5. Fig. 5 shows thatqeincreases nonlinearly with the increase ofC0, and the rate of increase ofqeslows down with the increase ofC0, which are consistent with previous research on natural sediments (Wang et al. 2009; Wang et al. 2012).qereaches a maximum value whenC0is sufficiently high. Then, the adsorption amount ceases to increase even ifC0increases. This phenomenon is caused by the less active areas available for phosphorus adsorption at a largeC0(Jin et al. 2005). The relationship betweenC0andqeprovides a way to predict the equilibrium adsorptio n capacity with different initial phosphorus concentrations.

Fig. 5 Effect of initial phosphorus concentration on phosphorus equilibrium adsorption capacity
3.3.3 Effect of sediment mineral matrix particle size on phosphorus equilibrium adsorption capacity
Fig. 6 shows that the phosphorus equilibrium adsorption capacity decreases with the increase of the median particle size of the sediment mineral matrix. As the initial phosphorus concentration increases,qeof D1 (0 to 30 μm) increases more significantly than those of D2, D3, and D4 (Fig. 5). As previously discussed in this study (Table 1), the specific surface areaand pore volume decrease with the increase of the particle size of the sediment mineral matrix. This may be the direct reason for the decrease of the phosphorus equilibrium adsorption capacity. This indicates that the specific surface area and pore volume are the main factors that determine the phosphorus equilibrium adsorption capacity of the sediment mineral matrix.
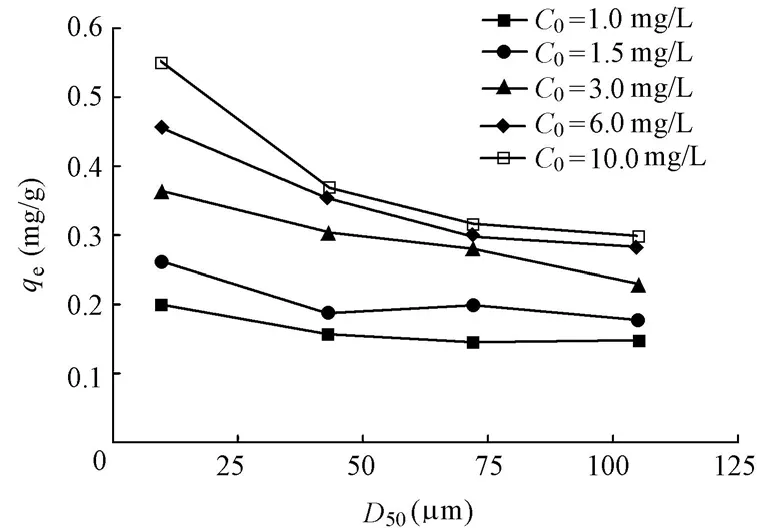
Fig. 6 Effect of median particle size on phosphorus equilibrium adsorption capacity
4 Conclusions
The surface properties and phosphorus adsorption of the sediment mineral matrix were investigated in this study. The conclusions are as follows:
(1) The relationship between the mean particle size and specific surface area of the sediment mineral matrix is exponential. The fine sediment mineral matrix has a relatively large specific surface area and pore volume.
(2) Compared with the Elovich equation and quasi-first-order adsorption kinetic equation, the quasi-second-order adsorption kinetic equation can best describe the adsorption kinetics. The effects of the initial phosphorus concentration (C0) on the equilibrium adsorption capacity (qe) can be estimated by Eq. (9).qeincreases nonlinearly with the increase ofC0, the rate of increase ofqedecreases with the increase ofC0, andqereaches a maximum value whenC0is sufficiently high.
可视化是三维模型设计的最大特点,也是相比传统设计的优势所在。以变送器为例,设计人员可以非常直观地看到变送器与取源点的位置关系,以及安装场地的周边情况,进而根据气上液下的原则调整变送器与取源点的相对位置关系,旋转、移动变送器到便于安装检修的朝向及位置,同时避开其他的设备、管道和结构。变送器建模示例如图1所示。
(3) The specific surface area and pore volume decrease with the increase of the particle size of the sediment mineral matrix, leading to a decrease in phosphorus equilibrium adsorption capacity. The specific surface area and pore volume are the main factors that determine the phosphorus equilibrium adsorption capacity of the sediment mineral matrix.
Chien, S. H., and Clayton, W. R. 1980. Application of Elovich equation to the kinetics of phosphate release and sorption in soils.Soil Science Society of America Journal, 44(2), 265-268. [doi:10.2136/sssaj1980. 03615995004400020013x]
Evans, D. J., Johnes, P. J., and Lawrence, D. S. 2004. Physico-chemical controls on phosphorus cycling in two lowland streams. Part 2: The sediment phase.Science of the Total Environment, 329(1-3), 165-182. [doi:10.1016/j.scitotenv.2004.02.023]
Fang, H. W., Chen, M. H., and Chen, Z. H. 2008. Surface pore tension and adsorption characteristics of polluted sediment.Science in China Series G: Physics, Mechanics and Astronomy, 51(8), 1022-1028.[doi:10.1007/s11433-008-0104-8]
House, W. A., Denison, F. H., Smith, J. T., and Armitage, P. D. 1995. An investigation of the effects of water velocity on inorganic phosphorus influx to a sediment.Environmental Pollution, 89(3), 263-271. [doi:10.1016/0269-7491(94)00071-K]
Huang, S. L. 2003. Investigation of cadmium desorption from different-sized sediments.Journal of Environmental Engineering, 129(3), 241-247. [doi:10.1061/(ASCE)0733-9372(2003)129:3(241)]
Jenne, E. A. 1968. Controls on Mn, Fe, Co, Ni, Cu, and Zn concentrations in soils and water: The significant role of hydrous Mn and Fe oxides.Advance in Chemistry, 73, 337-387. [doi:10.1021/ ba-1968-0073.ch021]
Koeppenkastrop, D., and De Carlo, E. H. 1992. Sorption of rare-earth elements from seawater onto synthetic mineral particles: An experimental approach.Chemical Geology, 95(3-4), 251-263. [doi:10.1016/ 0009-2541(92)90015-W]
Murphy, J., and Riley, J. P. 1962. A modified single solution method for the determination of phosphate in natural waters.Analytica Chimica Acta, 27, 31-36. [doi:10.1016/S0003-2670(00)88444-5]
Sánchez-Martín, M. J., Dorado, M. C., Del Hoyo, C., and Rodríguez-Cruz, M. S. 2008. Influence of clay mineral structure and surfactant nature on the adsorption capacity of surfactants by clays.Journal of Hazardous Materials, 150(1), 115-123. [doi:10.1016/j.jhazmat.2007.04.093]
Schroth, B. K., and Sposito, G. 1998. Effect of landfill leachate organic acids on trace metal adsorption by kaolinite.Environmental Science and Technology, 32(10), 1404-1408. [doi:10.1021/es970587q]
Tang, H. X., Xue, H. B., Lin, G. Z., Gao, L., Tian, B. Z., Lei, P. J., Dong, X. R., and Cao, F. C. 1981. Adsorption characteristics of cadmium pollutants on the chinese clay minerals.Acta Scientiae Circumstantiae, 1(2), 140-155. (in Chinese)
Wang, S. R., Jin, X. C., Zhao, H., Zhou, X. C., and Wu, F. C. 2007. Effect of organic matter on the sorption of dissolved organic and inorganic phosphorus in lake sediments.Colloids and Surfaces A: Physicochemical and Engineering Aspects, 297(1-3), 154-162. [doi:10.1016/j.colsurfa.2006.10.040]
Wang, X. Y., Zhang, L. P., Zhang, H. S., Wu, X. Y., and Mei, D. L. 2012. Phosphorus adsorption characteristics at the sediment-water interface and relationship with sediment properties in FUSHI reservoir, China.Environmental Earth Sciences, 67(1), 15-22. [doi:10.1007/s12665-011-1476-z]
Wang, Y., Shen, Z., Niu, J., and Liu, R. 2009. Adsorption of phosphorus on sediments from the Three-Gorges Reservoir (China) and the relation with sediment compositions.Journal of Hazardous Materials, 162(1), 92-98. [doi:10.1016/j.jhazmat.2008.05.013]
Withers, P. J. A., and Jarvie, H. P. 2008. Delivery and cycling of phosphorus in rivers: A review.Science of the Total Environment, 400(1-3), 379-395. [doi:10.1016/j.scitotenv.2008.08.002]
Zhang, J., Huang, W. W., Liu, M. G., and Zhou, Q. 1990. Drainage basin weathering and major element transport of two large Chinese rivers (Huanghe and Changjiang).Journal of Geophysical Research: Oceans, 95(C8), 13277-13288. [doi:10.1029/JC095iC08p13277]
(Edited by Yan LEI)
This work was supported by the National Natural Science Foundation of China (Grants No. 51179055, 51239003, and 51125034), and the Special Fund of State Key Laboratory of China (Grant No. 2010585512).
*Corresponding author (e-mail:13910077892@139.com)
Apr. 24, 2013; accepted Jun. 4, 2013
猜你喜欢
辽河(2022年1期)2022-02-14
辽河(2022年1期)2022-02-14
河北农机(2020年10期)2020-01-08
读者·校园版(2018年24期)2018-12-04
电子制作(2018年12期)2018-08-01
外语学刊(2017年3期)2017-12-07
艺术科技(2017年1期)2017-04-05
小学教学参考(语文)(2016年3期)2016-03-23
上海制造(2013年11期)2014-03-26
自动化博览(2014年12期)2014-02-28
 Water Science and Engineering2013年3期
- Water Science and Engineering的其它文章
- Present and future of hydrology
- Pollutant mixing and transport process via diverse transverse release positions in a multi-anabranch river with three braid bars
- Joint probability distribution of winds and waves from wave simulation of 20 years (1989-2008) in Bohai Bay
- Optimized operation of cascade reservoirs on Wujiang River during 2009-2010 drought in southwest China
- Towards full predictions of temperature dynamics in McNary Dam forebay using OpenFOAM
- Effectiveness of inhibitors in increasing chloride threshold value for steel corrosion