
Inspection of aluminum alloys by a multi-frequency eddy current method
2015-11-01 07:13EGOROVPOLYAKOVSALITAKOLUBAEVPSAKHIEACHERNYAVSKIIVOROBEI
Defence Technology 2015年2期
A.V.EGOROV,V.V.POLYAKOV,b,D.S.SALITA,E.A.KOLUBAEV*,S.G.PSAKHIEA.G.CHERNYAVSKII,I.V.VOROBEI
aAltai State University,Russia
bInstitute of Strength Physics and Materials Science SB RAS,Russia
cNational Research Tomsk Polytechnic University,Russia
dS.P.Korolev Rocket and Space Corporation“Energia”,Russia
Inspection of aluminum alloys by a multi-frequency eddy current method
A.V.EGOROVa,V.V.POLYAKOVa,b,D.S.SALITAa,E.A.KOLUBAEVb,c,*,S.G.PSAKHIEb,c,A.G.CHERNYAVSKIId,I.V.VOROBEId
aAltai State University,Russia
bInstitute of Strength Physics and Materials Science SB RAS,Russia
cNational Research Tomsk Polytechnic University,Russia
dS.P.Korolev Rocket and Space Corporation“Energia”,Russia
The paper proposes an experimental method of material inspection,which is based on digital processing of multi-frequency eddy current measurement data.The influences of various factors(conductivity,the gap between the sample surface and the sensor,the thickness of the sample)on the obtained hodographs are examined by taking the aluminum alloys for example,and the possibility of separation of various factors is analyzed.The results obtained are indicative of how much promise the proposed method offers for the inspection and testing of products made of aluminum alloys.
Eddy current method;Material inspection;Digital signal processing;Aluminum alloy
1.Introduction
One of the nondestructive testing methods for metallic materials is an eddy current method[1]that makes it possible to estimate the internal structural state of the material[2],detect the surface and subsurface flaws[3],detect the fatigue cracks[4],and determine the crack location[5]and the geometrical parameters such as the thickness of metal sheet or dielectric coating on metal products[6].The measured result of eddy current is determined by the combined action of a number of factors.Depending on the specific problem to be solved in non-destructive testing,it is necessary to isolate the effect of any one factor or group of factors.All the rest are in the number of the interfering factors and their effect should be excluded.The main factors affecting the eddy current measurementsincludeelectricalconductivityandmagneticpermeability that depend on the chemical composition and structure of the material,the geometric characteristics of a particular sample or products,the value of the gap between the probe and the surface of the object under control for overhead probes.In addition,the results of the measurements depend on the design peculiarities of the used probes[7]and measurement modes[8,9].The efficiency of the eddy current inspection can be improved by reliably separating the effect of various factors.
The most informativity is achieved by using of the method of eddy current multi-frequency measurements,which are followed by the construction and analysis of hodographs of the“probe-specimen”system.Such hodographs plot the combined effect of almost all factors important for the inspection and testing of materials.The main problem with multifrequency measurements is that their result depends on the combined action of a very large number of factors.Upon reaching sufficient precision,the experimental hodographs allow to separate the effect of various factors.One way of solving this problem is to employ new methods of digitalprocessing of signals from an eddy current measuring system[10,11].
http://dx.doi.org/10.1016/j.dt.2014.12.002
2214-9147/Copyright©2015,China Ordnance Society.Production and hosting by Elsevier B.V.All rights reserved.
The present paper considers a method of deriving experimental hodographs,which provides a significant reduction in the measurement error and thus allows us to distinguish the factors affecting the properties under inspection.The investigation is performed on aluminum alloys widely used in modern engineering as constructional materials[12].
2.Experimental method
The eddy current testing helps us to determine the inductance and active resistance of the“eddy current probespecimen”system.The tests are usually run with various bridge circuits and provide a smaller error in comparison to the direct measurement of system parameters.At the same time the bridge circuits make the measurement more difficult because of the necessity for constant bridge balancing.Besides,such balancing complicates considerably the test automation[13].In this connection,the bridge measurements and direct detection of the probe impedance are conducted through the complex amplitudes of voltage and current.Both circuits are shown in Fig.1.
Fig.1(a)shows a resonant bridge circuit.The probe parameters are calculated by the formulae
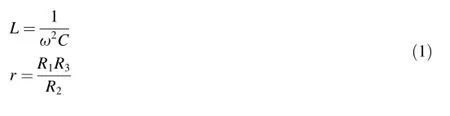
where L and r are the inductance and active resistance of the eddy current probe,respectively;C is the capacitance of the capacitor;R1,R2,and R3are the resistance values,at which the bridge is balanced;ω is the cyclic frequency of the sinusoidal input signal;and˙U1in Fig.1 is the complex input amplitude. Fig.1(b)presents a circuit for the direct measurement of the probe impedance.In this case,the parameters are calculated by the formulae
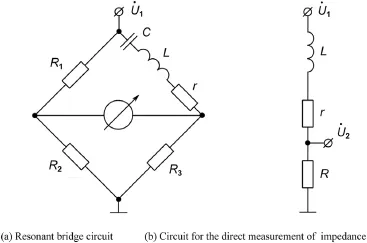
Fig.1.Circuits for the experimental measurements.
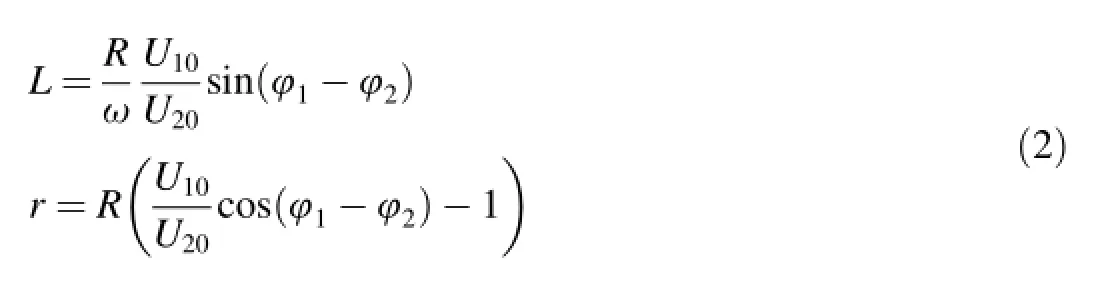
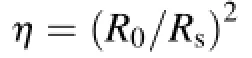
where R is the resistance playing the role of the current-tovoltage converter;and U10and φ1are the amplitude and initial phase of the input signal˙U1,respectively;and˙U20and φ2are the amplitude and initial phase of the signal˙U2.All measurement results are shown as the hodographs plotted in the coordinates ΔX/X0-Δr/X0,where ΔX=ω(L-L0)is the variation in the reactive resistance of probe in the presence of the specimen,Δr=r-r0is the variation in the active resistance of probe in the presence of the specimen,X0,L0and r0are the reactive resistance,inductance and active resistance of the probe without the specimen,respectively.
In both cases,a parametric probe of an encircling type is used.The probe presents a coil with 250 mm in length and 29 mm in effective diameter.A test specimen with round cross-section and longer than the coil is passed through the probe.Specimens are made of D16T duralumin and shaped to the rods with 400 mm in length and 22 mm in diameter.The measurements are made at fixed frequencies ranging from 200 Hz to 2 kHz.Each measurement for a given frequency is conducted with and without specimen for at least 10 times with the subsequent calculation of the probe parameters by Eqs.(1)and(2).The measurement results are represented in the hodographs as a series of experimental points,each of which corresponds to a specific frequency.
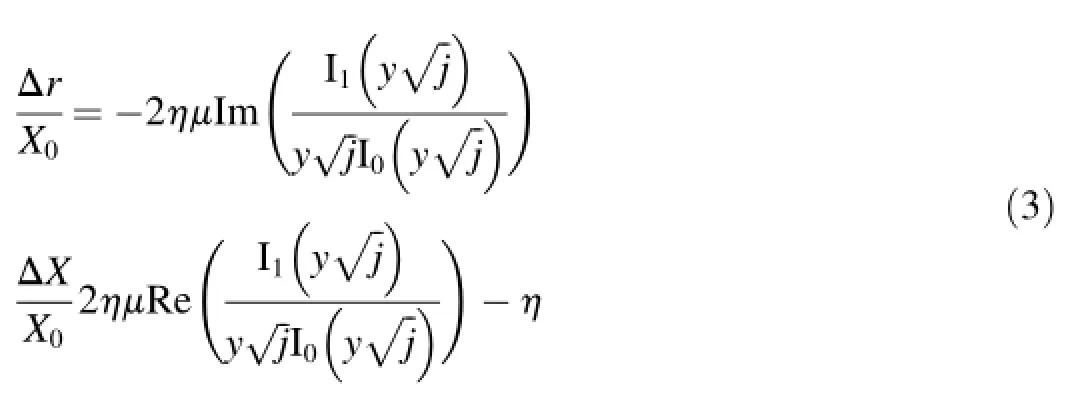
Along with the construction of experimental hodographs,the theoretical ones are calculated using the known values of probe characteristics,geometric parameters of specimens,and their specific electrical conductivity.The calculations are carried out by the formulas[1,3]
3.Digital signal processing in eddy current measurements
The digital processing of experimental signals was used to reduce the measurement error of complex voltage and currentamplitudes[15].This processing consists in that the instantaneous signal values are approximated by the linear combination of the first three Walsh functions[16]

where wal(0,x),wal(1,x)and wal(2,x)are the first,second and third Walsh functions,respectively;x=t/T is the relative time;and T is the signal period.The coefficients in Eq.(4)are as follows
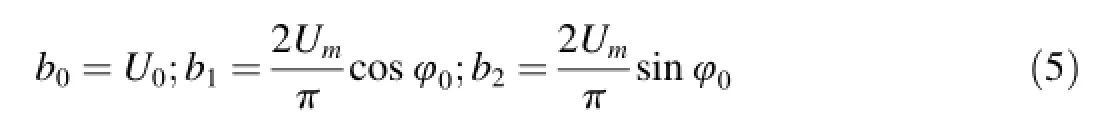
where U0is the constant bias voltage;Umis the harmonic signal amplitude;and φ0is the initial phase.Such a series describes very roughly the harmonic signal and however its coefficients contain all necessary information on the searched parameters.Values of b0,b1and b2are found in processing of the experimental data by the least squares method.The criterion for the optimal choice of weighting factors is the minimum of the objective function

where Xiand Yiin calculating the Walsh functions take on+1 or-1,which leads to the sign reversal in summation.
The proposed approach is validated in three different tests with different measuring circuits.The derived results are shown in Fig.2.In the first test,the probe impedance is determined using a resonant bridge circuit(Fig.1(a)),and the test values are illustrated as the points in Fig.2(a),where the points represent the mean values of the relative driving-point impedances,and the mutual intersection of two lines at a point indicates the standard error of these values.In the second and third tests,the impedance is directly measured by a voltmeter and phase meter.Fig.2(b)shows the immediate results of such measurements while Fig.2(c)exhibits the data of experimental signals processed by the Walsh functions.In addition,the solid curves in these figures represent the theoretical hodographs calculated by Eq.(3).
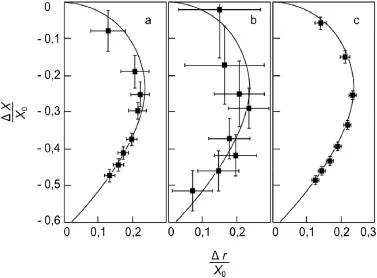
Fig.2.Experimental hodographs of different measuring circuits,(a)Bridge circuit(b)Direct measurement of impedance(c)Direct measurement of impedance and digital signal processing.
The comparison of the hodographs in Fig.2(a)and(b)shows that the experimental points for the bridge circuit are placed closer to the theoretical curve and have a much smaller error.The minimum measurement error is found in Fig.2(c),where the experimental points lie on the theoretical curve. Thus,the method combining the direct measurement of probe impedance and digital signal processing using Walsh functions provides both high measuring accuracy competitive with that of bridge circuits and ease of its implementation necessary for use in an automated measuring and computing complex.
4.Test results for aluminum alloys
Inspected products made of aluminum alloys can have different dimensions and shapes,which narrows significantly the field of application of encircling probes under actual operating conditions.Therefore further measurements are carried out using a parametric probe.The probe presents a coil placed into a ferrite magnetic core with semi-shell structure made of manganese-nickel ferrite with relative initial magnetic permeability μ=2000.The diameter of the probe is 15 mm.The choice of this design was driven by the fact that the signal received from the probe at the same time dependent on several factors,such as electrical conductivity of gap and sheet thickness),which reveals the possibility of the proposed method for separating the influences of various factors.Measurements were carried out at frequencies from 100 Hz to 6.4 kHz,which provides a reliable separation of hodograph lines for probe mentioned above.The measurements are performed with the use of an automated measuring and computing complex by using the above-described method to directly determinate the probe impedance and the Walsh functions for digital signal processing.
The block scheme of the eddy current measuring system is shown in Fig.3.A harmonic signal supplied by generator 1 is fed to an electric circuit consisting of series-connected eddy currentparametricprobe(Landr)andresistanceR(R=50 Ohms).Analog-to-digital converters 2 and 3 digitize the voltages U1and U2,respectively,and the digitized data are transmitted to the control computer,which is also used to set the operating mode of the generator,by communication channel 4.Fig.4 shows the measuring unit of eddy current measuring system together with probe superimposed on a controlled sample.
To determine the capacity of the proposed diagnostic method,the effects the size of the gap between the sheet surface and the contact sensor,and the thickness and conductivity of the material sheet on eddy current measurement results were studied.The test specimens present the flat sheets of AMg5 aluminum alloy from 5 to 10 mm in thickness.The inspection possibilities depend on the effect of such factors as the gap width between the probe and the sheet surface,sheetthickness,and electrical conductivity of the material.The test results are shown as the points on the experimental hodographs in Fig.5(for convenience,in comparing the hodographs,the points are connected by dotted lines found by interpolation).
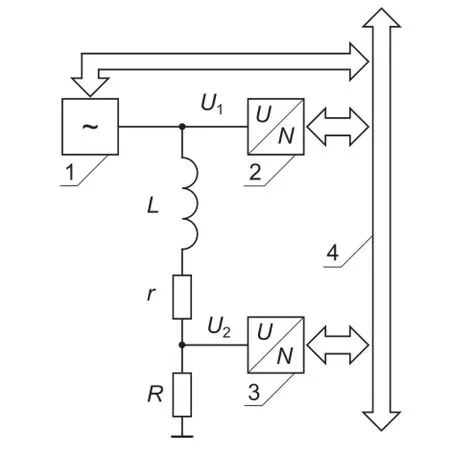
Fig.3.Block scheme of the measuring unit of the eddy current measuring system.
Fig.5(a)shows the hodograph for different gap width(being almost zero for points 1,and being 160 μm for points 2).The hodograph lines are seen to noticeably shift relative to each other.The curves diverge strongly in their lower portions corresponding to high frequencies,which are caused by the small thickness of the skin layer and the consequent stronger effect of the gap.

Fig.4.Exterior view of the measuring unit of eddy current measuring system.

Fig.5.Experimental hodographs for aluminum alloys.(a)Gap effect:1,lack of a gap for points,2,160 μm gap for points;(b)Effect of electrical conductivity: 1,σ=15,7 MS/m,2,σ=19,5 MS/m;(c)Effects of specimen thickness and electrical conductivity:1,h=5 mm,σ=15,7 MS/m,h=8.7 mm,2,σ=19,5 MS/m.
Fig.5(c)illustrates the simultaneous effect of both factors,namely,the thickness of the specimen and the conductivity of the material(for points 1 the sheet thickness h=5 mm and the specific conductivity σ=15.7 MS/m,for points 2 h=8.7 mm and σ=19.5 MS/m).The hodographs for specimens with different thicknesses are seen to differ in shape,which is due to the divergence of their upper portions corresponding to low frequencies.This divergence is governed by the effect of the skin layer,whose thickness at low frequencies is comparable with the sheet thickness.The lower portions of the hodographs describing high frequencies match due to the small thickness of the skin layer the sheet thickness has almost no effect on the position of the hodograph line.At the same time,despite the curve coincidence the corresponding experimental points are significantly shifted relative to each other along the hodograph line due to different conductivity.
It should be noted that the suppression of interfering factors is extremely difficult since the eddy current techniques are based on measurements at one fixed frequency.As a rule,the interfering factors are suppressed by time-consuming procedures for selecting the measurement mode.Thus,in the resonant eddy current inspection,a measurement frequency is selected experimentally on the left slope of the resonance curve,which allows reducing the influence of the gap width to 100 microns during inspection of non-ferrous metals[1].A weakening of the influence of larger gap(up to 200 microns)provides a eddy current technique based on measurement of the variable phase of harmonic signal in eddy current probe.In this case,it needs to carefully select the initial complexamplitude of the reference signal.The proposed method does not have these disadvantages.
5.Conclusions
The proposed approach based on multi-frequency measurements and digital processing of the recorded signals allows to identify successfully and to separate the influence of various factors which are very important for eddy current inspection(sample thickness,gap between probe and sample,change in electric conductivity).This indicates the prospects of this approach for the inspection of materials and products made of aluminum alloys.
Acknowledgment
The work has been supported by Program for Basic Scientific Research of the State Academies of Sciences for 2013-2020 and the RF Ministry of Education and Science(Contract No.02.G25.31.0063)in the framework of RF Government Order No.218.
[1]Nondestructive testing:Handbook:In 8 volumes/Edited by V.V.Klyuev/ Volume 2,Moscow:Mashinostroenie,2003,688 p.
[2]Polyakov VV,Egorov AV.Eddy current testing of specific electrical conductivity and magnetic permeability of products from magnetic soft materials.Defectoscopia 1992;12:78-80.
[3]Dorofeev AL,Kazamanov YuG.Electromagnetic testing.Moscow: Mashinostroenie;1980.
[4]Sasi B,Rao BPC,Jayakumar T,Raj Baldev.Development of eddy current test procedure for non-destructive detection of fatigue cracks and corrosion in rivets of air-intake structures.Def Sci J 2009;59(2):106-12.
[5]Song Zenglu,Yamada Tsutomu,Shitara Hideki,Takemura Yasushi. Detection of damage and crack in railhead by using eddy current testing. J Electromagn Anal Appl 2011;3:546-50.
[6]Polyakov VV,Egorov AV.Magnetic and electrical characteristics of porous ferromagnets.Dok Akad Nauk 1995;344(4):479-80.
[7]Golovnev IF,Golovneva EI,Merzhievsky LA,Fomin VM.Defect generation as a phenomenon of structure self-organization under external loads.Phys Mesomech 2013;16(4):294-302.
[8]García-Martín J,G´omez-Gil J,V´azquez-S´anchez E.Non-destructive techniquesbasedoneddycurrenttesting.Sensors(Basel)2011;11(3):2525-65.
[9]Bashtannikov LA,Bondarenko VI,Sebko VP,Tyupa VI.Determination of electromagnetic characteristics of the material of solid cylindrical products.Defectoscopia 1980;8:5-9.
[10]Polyakov VV,Golovin AV,Egorov AV,Utemesov MA.Correlation of acoustic and physicomechanical characteristics of porous materials. Defectoscopia 1994;9:48-50.
[11]Kucheryavskii SV,Polyakov VV.Multivariable data analysis techniques for thestudy ofthematerial structure.Zavod LabDiag Mat 2007;73(8):32-6.
[12]Shang-kun Ren,Da-peng Sun.Studies of eddy current testing on nuclear power steam generator tube based on finite element simulation.In:2nd international conference on materials,mechatronics and automation lecture notes in information technology,vol.15;2012.p.217-22.
[13]Egorov AV,Polyakov VV,Ivakov SV.A measuring and computing complex for the eddy current detection of specific conductivity and magnetic permeability.Polzunov Vest 2010;2:129-31.
[14]Korenev BG.Introduction to the theory of bessel functions.Moscow: Nauka;1971.
[15]Max J.M´ethodes es techniques de traitement du Signal et applications aux mesures physiques.Paris:Masson;1987.
[16]Zalmanzon LA.Fourier,Walsh,and Haar transforms and their application in management,communication,and other fields.Moscow:Nauka;1989.
.Institute of Strength Physics and Materials Science SB RAS,Russian Federation
E-mail address:eak@ispms.ru(E.A.KOLUBAEV).
Peer review under responsibility of China Ordnance Society.
28 July 2014;revised 10 December 2014;accepted 11 December 2014
Available online 26 January 2015
Copyright©2015,China Ordnance Society.Production and hosting by Elsevier B.V.All rights reserved.
- Defence Technology的其它文章
- 2D and 3D milled surface roughness of high volume fraction SiCp/Al composites
- Determination of penetration depth at high velocity impact using finite element method and artificial neural network tools
- Microstructure and pitting corrosion resistance of AA2219 Al-Cu alloy friction stir welds-Effect of tool profile
- Theoretical study of BTF/TNA cocrystal:Effects of hydrostatic pressure and temperature
- Friction stir surfacing of cast A356 aluminium-silicon alloy with boron carbide and molybdenum disulphide powders
- Variation of chemical composition of high strength low alloy steels with different groove sizes in multi-pass conventional and pulsed current gas metal arc weld depositions