绝经后骨质疏松骨折腰大肌改变的 CT 定量分析
2016-09-07 03:24王晨侯雪张勇王玲程晓光
中国骨与关节杂志 2016年8期
王晨 侯雪 张勇 王玲 程晓光
绝经后骨质疏松骨折腰大肌改变的 CT 定量分析
王晨 侯雪 张勇 王玲 程晓光
目的 探讨绝经后骨质疏松骨折腰大肌横截面积(cross sectional area,CSA)、平均 CT 值及平均骨密度(bone mineral density,BMD)的改变。方法 连续选取 2015 年 9 月至 2016 年 2 月,于北京积水潭医院进行腰椎定量 CT 骨密度测量的绝经后女性,伴骨质疏松骨折受检查者 50 例(骨质疏松骨折组),平均年龄 67.3(55~86)岁;按年龄匹配原则(年龄相差不超过 1 岁)进行 1∶1 匹配,非骨折受检查者 50 例(非骨折组),平均年龄 67.6(55~87)岁。于 L4~5椎间盘水平分别测量两侧腰大肌的 CSA 值、平均 CT 值及平均 BMD,并进行统计学分析。结果 骨质疏松骨折组左右两侧腰大肌 CSA 分别为(583.97±140.70)mm2和(572.83±138.68)mm2,非骨折组两侧腰大肌 CSA 分别为(753.68±153.54)mm2和(741.68±132.22)mm2。骨质疏松骨折组腰大肌 CSA 小于非骨折组,差异有统计学意义(P<0.01)。骨质疏松骨折组左右两侧腰大肌平均 CT值分别为(42.00±9.00)Hu 和(42.00±12.25)Hu,非骨折组两侧腰大肌平均 CT 值分别为(35.80±8.39)Hu 和(35.50±10.75)Hu。骨质疏松骨折组两侧腰大肌平均 CT 值略高于非骨折组,差异有统计学意义(P<0.05)。骨质疏松骨折组平均 BMD 为(65.27±25.62)mg / cm3,非骨折组平均 BMD 为(77.81±33.90)mg / cm3,骨质疏松骨折组平均 BMD 低于非骨折组,差异有统计学意义(P<0.05)。结论 绝经后骨质疏松骨折与腰大肌的显著改变有关。
骨质疏松,绝经后;放射摄影术;体层摄影术,X 线计算机;骨密度;腰大肌
骨质疏松症是以骨量减少,骨质量受损及骨强度降低,导致骨脆性增加、易发生骨折为特征的全身性骨病。随着年龄的增长,骨密度(bone mineral density,BMD)逐渐下降。骨质疏松骨折是骨质疏松症最常见的严重并发症,可致残,并严重影响患者的生活质量,明显增加医疗费用。
椎旁肌群对于脊柱的稳定性具有重要的作用。椎旁肌群的萎缩,肌肉疲劳性增加,使脊柱更容易发生损伤,加重临床症状[1]。之前的研究主要针对椎旁伸肌群,其力量的减少与骨质疏松骨折及脊柱稳定性的降低有关[2-4]。但很少有研究关注腰大肌改变与 BMD 及骨质疏松骨折的关系。CT 是测量肌肉横截面积(cross sectional area,CSA)的特殊技术。CT 值可以反映肌肉内脂肪含量的情况及肌肉萎缩的程度。CSA 和 CT 值可以综合反映肌肉力量情况。通过测量腰大肌 CSA 及 CT 值可以评估腰部的力量情况[5]。本研究应用 CT 定量测量绝经后骨质疏松骨折腰大肌 CSA、平均 CT 值及平均 BMD,探讨其改变与骨质疏松骨折的关系。
资料与方法
一、一般资料
连续选取 2015 年 9 月至 2016 年 2 月,于北京积水潭医院进行腰椎定量 CT 骨密度测量的绝经后女性,伴骨质疏松骨折受检查者 50 例(骨质疏松骨折组),平均年龄 67.3(55~86)岁;按年龄匹配原则(年龄相差不超过 1 岁)进行 1∶1 匹配,非骨折受检查者 50 例(非骨折组),平均年龄 67.6(55~87)岁。通过询问病史及其它辅助检查排除患有严重内分泌代谢性疾病及恶性肿瘤的受检查者。受检查者均签署知情同意书。
二、仪器与方法
扫描方法:采用 Toshiba Aquilion 16 排 MSCT 机加垫 Mindways 公司 5 样本固体体模进行螺旋扫描,扫描条件为 120 kV,125 mA,使用标准体部重建为层厚 1 mm 的薄层 Volume 数据,DFOV 400 mm,扫描范围包括 L1~5椎体。
测量方法:BMD 测量:采用 Mindways QCT Pro测量软件,分别测量 2~3 个椎体松质骨 BMD(单位mg / cm3),取均值。腰大肌 CSA 及 CT 值测量:因为L4~5椎间盘层面是腰大肌 CSA 最大的层面[6],利用PACS 系统存储的图像,选取 L4~5椎间盘层面,绘制感兴趣区(regions of interest,ROI),分别测量两侧腰大肌 CSA(单位 mm2)及平均 CT 值(单位 Hu)(图 1)。ROI 尽量贴近肌肉边缘,但避免包含腹腔脂肪。CT 值选取 ROI 内的平均 CT 值。所有数据均由 2 名主治医师独立测量。
同时记录受检者身高、体重信息,并计算体质量指数(body mass index,BMI,单位 kg / m2)。
三、统计学处理
采用 SPSS 19.0 软件进行统计学分析。采用组内相关系数(intraclass correlation coefficient,ICC)检验2 名测量者间一致性。所有测量数据进行 K-S 正态性检验。分别使用独立样本 t 检验或 M-W 秩和检验比较两组间腰大肌 CSA、平均 CT 值及平均 BMD。使用配对 t 检验比较组内两侧腰大肌 CSA、平均 CT值。P<0.05 为差异有统计学意义。
结 果
一、测量方法的信度
由表 1 可见,2 名测量者之间的 ICC 均>0.7,表明该测量方法在不同测试者之间具有良好的可重复性。
二、两组间测量结果比较
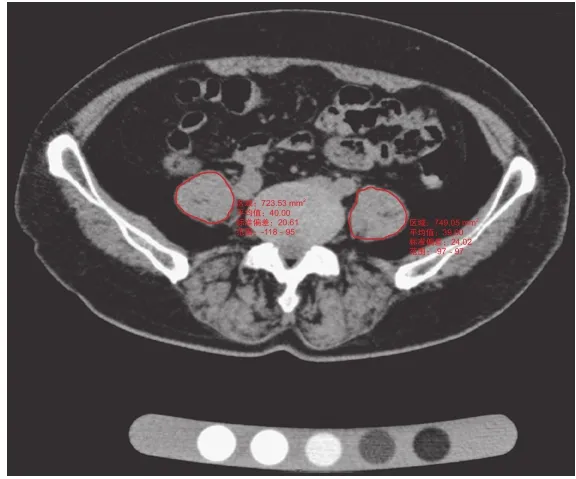
图1 分别测量左、右侧腰大肌的 CSA 及平均 CT 值Fig.1 CT axial image showed CSA and average CT value of the bilateral psoas major at L4-5disc levels
两组间年龄差异无统计学意义(P>0.05)。骨质疏松骨折组的平均 BMI 为(24.51±3.37)kg / m2,非骨折组的平均 BMI 为(25.14±3.51)kg / m2,两组间差异无统计学意义(P>0.05)。非骨折组的平均BMD 明显高于骨质疏松骨折组,差异有统计学意义(P<0.05)。非骨折组无论是左侧还是右侧腰大肌,其 CT 值均较骨质疏松骨折组稍低,差异有统计学意义(P<0.05)。非骨折组左右两侧腰大肌面积均值明显较骨质疏松骨折组大,差异有统计学意义(P<0.01)。两组内左侧及右侧腰大肌 CT 值基本一致,差异无统计学意义(P>0.05)。两组内左侧及右侧腰大肌 CSA 为左侧略大于右侧,差异无统计学意义(P>0.05)(表 2)。
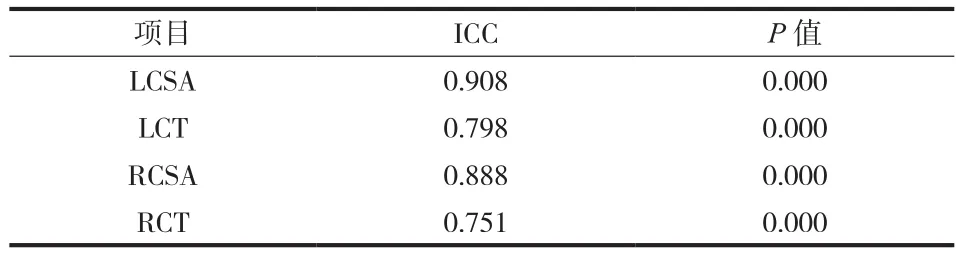
表1 测量者间一致性检验Tab.1 ICC test
表2 两组间 BMI、BMD 及腰大肌 CT 值和 CSA 比较(± s)Tab.2 Comparisons between the osteoporotic fracture group and non-fracture group on BMI, BMD, CT value, CSA(± s)
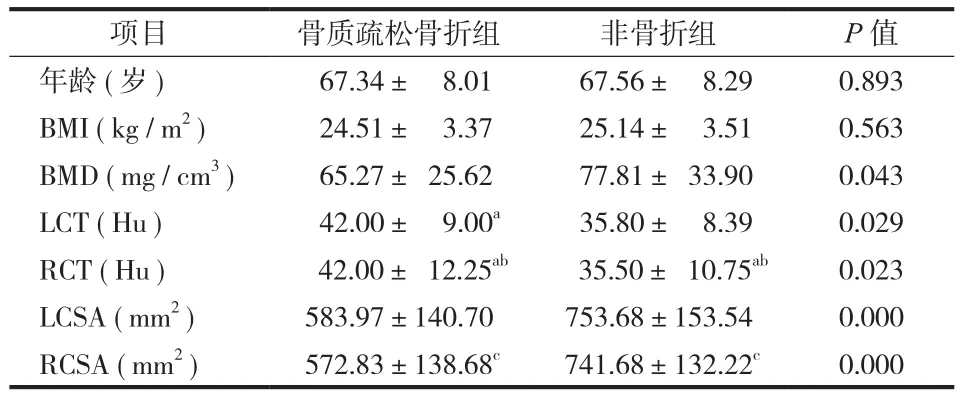
表2 两组间 BMI、BMD 及腰大肌 CT 值和 CSA 比较(± s)Tab.2 Comparisons between the osteoporotic fracture group and non-fracture group on BMI, BMD, CT value, CSA(± s)
注:BMI:体质量指数;BMD:骨密度。数据为均数±标准差或中位数±四分位数间距(a非正态分布数据);b与组内 LCT 比较,差异无统计学意义(P=0.534;P=0.931);c与组内 LCSA 比较,差异无统计学意义(P= 0.691;P=0.676)Notice: BMI: body mass index; BMD: bone mineral density; data were expressed as means ± SD or median ± interquartile range(aNonnormal data).bCompare with LCT within the group, the differences were not statistically significant(P = 0.534; P = 0.931).cCompare with LCSA within the group, the differences were not statistically significant(P = 0.691; P = 0.676)
项目 骨质疏松骨折组 非骨折组 P 值年龄(岁) 67.34± 8.01 67.56± 8.29 0.893 BMI(kg / m2) 24.51± 3.37 25.14± 3.51 0.563 BMD(mg / cm3) 65.27± 25.62 77.81± 33.90 0.043 LCT(Hu) 42.00± 9.00a 35.80± 8.39 0.029 RCT(Hu) 42.00± 12.25ab 35.50± 10.75ab 0.023 LCSA(mm2) 583.97±140.70 753.68±153.54 0.000 RCSA(mm2) 572.83±138.68c 741.68±132.22c 0.000
讨 论
肌肉减少症是指随着年龄的增长,肌肉的含量及力量减少的现象,是骨质疏松症重要的危险因素之一[7]。肌肉含量减少主要表现在肌肉萎缩和脂肪浸润两个方面。肌肉萎缩是指肌肉 CSA 的减少,主因肌纤维的减少及萎缩[8-10];脂肪浸润是指脂肪、结缔组织等成分的增生、浸润,包括肌细胞内脂质沉积和肌细胞间的脂肪细胞增生,使得肌肉组织的平均衰减系数(CT 值)减低[11-13]。研究表明,椎旁肌肉的萎缩与肌肉功能的减低及骨质疏松的发生具有相关性[14-15]。本研究应用 CT 技术测量了两侧腰大肌的 CSA、平均 CT 值及平均 BMD,旨在定量评估腰大肌的萎缩情况。
之前的研究发现,与单纯骨质疏松非骨折比较,脊柱骨质疏松骨折与椎旁伸肌群力量的减少有关[16-17],并会降低脊柱的活动性[18],改变脊柱平衡特点[19-20]。但是关于绝经后骨质疏松骨折腰大肌的定量研究非常少。Sinaki 等[16]比较了绝经后伴或不伴骨质疏松椎后伸肌群的力量,发现伴有骨质疏松的椎后伸肌群的力量会减低,且椎后伸肌群的力量减低与姿势异常与骨质疏松相关。Kim 等[21]比较了绝经后伴或不伴骨质疏松骨折腰大肌的 CSA,发现伴有骨质疏松骨折的绝经后女性,其椎后伸肌群及腰大肌 CSA 明显减小。本研究显示,与绝经后不伴骨质疏松骨折相比,伴有骨质疏松骨折其腰大肌的 CSA均明显减少,与之前的研究结果一致。绝经后伴骨质疏松的女性,其柔韧性和活动度会下降,从而影响走路及日常活动,其摔倒及骨折的风险会增加。
超声、CT 及 MRI 均为测量肌肉脂肪含量的手段,其中 CT 及 MRI 被认为是测量的金标准,CT 及MRI 能提供更清晰的图像,进行更准确的测量,包括肌肉的 CSA 及肌肉质量,而 CT 值可以反映肌肉的密度及肌肉内部脂肪的浸润[22-23]。汪伟等[24]在研究中发现,腰大肌的密度随着年龄的增长而下降,且肌肉密度对于骨密度有除年龄之外的正性促进作用。关于绝经后骨质疏松骨折腰大肌密度的研究很少。本研究显示绝经后伴骨质疏松骨折组腰大肌平均 CT 值较不伴骨质疏松者高,猜测可能与骨折后腰大肌损伤内部出血有关,也可能与损伤后肌肉修复有关,但具体原因仍不清楚。
腰大肌具有稳定腰椎的作用,主要承担着维持腰段脊柱前倾的姿势稳定[25],另外腰大肌还能有效调节腰椎曲度[26-27]。肌肉的不平衡会加重脊柱侧凸,限制脊柱活动度。脊柱侧凸是众所周知的骨质疏松并发症之一。Ploumis 等[28]认为腰大肌萎缩性改变与单侧椎间盘突出有关,发生突出者腰大肌CSA 减小。但是 Arbanas 等[29]发现腰痛患者左侧和右侧腰大肌面积对比无差异,且没有表现出任何脂肪浸润的征象。李娜等[30]研究发现左右两侧椎后肌群密度存在差异,可能是胚胎的发育时期人体左右侧发育不均衡所致。尚未见关于绝经后骨质疏松女性两侧腰大肌萎缩情况的研究。本研究显示绝经后无论伴或不伴骨质疏松骨折,两侧腰大肌均没有明显的脂肪浸润征象,且 CSA 及平均 CT 值无明显差异,部分与之前研究结果一致。
肌肉萎缩症的特点是随着年龄增长肌肉质量及力量的减少,且对于女性的影响大于男性[31]。Binkley 等[32]第一次提出了肌肉减少性骨质疏松的概念。其认为既有肌肉又有骨量减少的患者可以定义为肌肉减少性骨质疏松。肌肉减少性骨质疏松患者摔倒及骨折的风险会显著增加,从而增加发病率、降低生活质量,增加死亡率。有研究报道了女性肌肉萎缩与骨质疏松的关系。在中老年男性,肌肉萎缩与低的骨密度有关[33]。但是,关于绝经后骨质疏松骨折腰大肌萎缩的报道很少,本研究中,笔者研究了绝经后骨质疏松骨折与腰大肌萎缩的关系,认为绝经后骨质疏松骨折腰大肌的改变对于脊柱有很大的影响,腰大肌 CSA 的减少反映了腰大肌肌量的减少,会增加摔倒及骨折的风险,引起不良临床后果。
本研究的不足之处,由于样本量不多,且对于腰大肌仅作单一层面测量,对肌肉萎缩及脂肪浸润只能做初步的观察及判断。需进一步增加样本量并改良测量方法,以更准确评估绝经后骨质疏松骨折腰大肌萎缩情况。
[1] 乔培柳, 塔依尔·阿不都哈德尔. 腰椎退行性疾病椎旁肌的渐进变化. 中国组织工程研究, 2014, 18(44):7205-7210.
[2] Sinaki M, Khosla S, Limburg PJ, et al. Muscle strength in osteoporotic versus normal women. Osteoporos Int, 1993,3(1):8-12.
[3] Cunha-Henriques S, Costa-Paiva L, Pinto-Neto AM, et al. Postmenopausal women with osteoporosis and musculoskeletal status: a comparative cross-sectional study. J Clin Med Res,2011, 3(4):168-176.
[4] Miyakoshi N, Hongo M, Maekawa S, et al. Factors related to spinal mobility in patients with postmenopausal osteoporosis. Osteoporos Int, 2005, 16(12):1871-1874.
[5] Maughan RJ. Relationship between muscle strength and muscle cross-sectional area. Implications for training. Sports Med,1984, 1(4):263-269.
[6] Jorgensen MJ, Marras WS, Gupta P. Cross-sectional area of the lumbar back muscles as a function of torso flexion. Clin Biomech, 2003, 18(4):280-286.
[7] Ormsbee MJ, Prado CM, Ilich JZ, et al. Osteosarcopenic obesity: the role of bone, muscle, and fat on health. J Cachexia Sarcopenia Muscle, 2014, 5(3):183-192.
[8] Goodpaster BH, Park SW, Harris TB, et al. The loss of skeletal muscle strength, mass, and quality in older adults: the health, aging and body composition study. J Gerontol A Biol Sci Med Sci, 2006, 61(10):1059-1064.
[9] Sayer AA, Dennison EM, Syddall HE, et al. The developmental origins of sarcopenia: using peripheral quantitative computed tomography to assess muscle size in older people. J Gerontol A Biol Sci Med Sci, 2008, 63(8):835-840.
[10] Goodpaster BH, Kelley DE, Thaete FL, et al. Skeletal muscle attenuation determined by computed tomography is associated with skeletal muscle lipid content. J Appl Physiol, 2000, 89(1):104-110.
[11] Kelley DE, Goodpaster BH. Skeletal muscle triglyceride. An aspect of regional adiposity and insulin resistance. Diabetes Care, 2001, 24(5):933-941.
[12] Goodpaster BH, Brown NF. Skeletal muscle lipid and its association with insulin resistance: what is the role for exercise?Exerc Sport Sci Rev, 2005, 33(3):150-154.
[13] Goodpaster BH, Carlson CL, Visser M, et al. Attenuation of skeletal muscle and strength in the elderly: The Health ABC Study. J Appl Physiol, 2001, 90(6):2157-2165.
[14] Visser M, Kritchevsky SB, Goodpaster BH, et al. Leg muscle mass and composition in relation to lower extremity performance in men and women aged 70 to 79: the health,aging and body composition study. J Am Geriatr Soc, 2002,50(5):897-904.
[15] Visser M, Goodpaster BH, Kritchevsky SB, et al. Muscle mass,muscle strength, and muscle fat infiltration as predictors of incident mobility limitations in well-functioning older persons. J Gerontol A Biol Sci Med Sci, 2005, 60(3):324-333.
[16] Sinaki M, Khosla S, Limburg PJ, et al. Muscle strength in osteoporotic versus normal women. Osteoporos Int, 1993,3(1):8-12.
[17] Cunha-Henriques S, Costa-Paiva L, Pinto-Neto AM, et al. Postmenopausal women with osteoporosis and musculoskeletal status: a comparative cross-sectional study. J Clin Med Res,2011, 26, 3(4):168-176.
[18] Miyakoshi N, Hongo M, Maekawa S, et al. Factors related to spinal mobility in patients with postmenopausal osteoporosis. Osteoporos Int, 2005, 16(12):1871-1874.
[19] Balzini L, Vannucchi L, Benvenuti F, et al. Clinical characteristics of flexed posture in elderly women. J Am Geriatr Soc, 2003, 51(10):1419-1426.
[20] Keller TS, Harrison DE, Colloca CJ, et al. Prediction of osteoporotic spinal deformity. Spine, 2003, 28(5):455-462.
[21] Kim JY, Chae SU, Kim GD, et al. Changes of paraspinal muscles in postmenopausal osteoporotic spinal compression fractures: magneticresonance imaging study. J Bone Metab,2013, 20(2):75-81.
[22] Pahor M, Manini T, Cesari M. Sarcopenia: clinical evaluation,biological markers and other evaluation tools. J Nutr Health Aging, 2009, 13(8):724-728.
[23] Cesari M, Leeuwenburgh C, Lauretani F, et al. Frailty syndrome and skeletal muscle: results from the Invecchiare in Chianti study. Am J Clin Nutr, 2006, 83(5):1142-1148.
[24] 汪伟, 孔令懿, 李佳录, 等. 定量CT肌肉密度的年龄变化趋势及其与骨密度的关系. 中国医学影像学杂志, 2011, 19(12):903-908.
[25] Regev GJ, Kim CW, Tomiya A, et al. Psoas muscle architectural design, in vivo sarcomere length range, and passive tensile properties support itsrole as a lumbar spine stabilizer. Spine,2011, 36(26):E1666-1674.
[26] 韦以宗, 桂清民, 孙永章, 等. 腰大肌作用与腰曲关系的动态下X线片研究. 中国临床解剖学杂志, 2005, 23(6):579-582.
[27] 韦以宗, 田新宇, 王慧敏, 等. 腰大肌与腰椎运动力学关系动物实验研究. 中国临床解剖学杂志, 2011, 29(1):97-99.
[28] Ploumis A, Michailidis N, Christodoulou P, et al. Ipsilateral atrophy of paraspinal and psoas muscle in unilateral back pain patients with monosegmental degenerative disc disease. Br J Radiol, 2011, 84(1004):709-713.
[29] Arbanas J, Pavlovic I, Marijancic V, et al. MRI features of the psoas major muscle in patients with low back pain. Eur Spine J,2013, 22(9):1965-1971.
[30] 李娜, 唐海, 张勇, 等. 双能X线吸收与定量CT对比评价北京地区中老年女性与年龄相关的骨丢失. 中国医学影像技术,2015, 31(10):1487-1491.
[31] Crepaldi G, Romanato G, Tonin P, et al. Osteoporosis and body composition. J Endocrinol Invest, 2007, 30(6 Suppl):S42-47.
[32] Binkley N, Buehring B. Beyond FRAX: it’s time to consider “sarco-osteopenia”. J Clin Densitom, 2009, 12(4):413-416.
[33] Verschueren S, Gielen E, O’Neill TW, et al. Sarcopenia and its relationship with bone mineral density in middle-aged and elderly European men. Osteoporos Int, 2013, 24(1):87-98.
(本文编辑:王萌)
Change of the psoas major in postmenopausal spinal osteoporotic fractures: a computed tomography quantitative study
WANG Chen, HOU Xue, ZHANG Yong, WANG Ling, CHENG Xiao-guang. Department of Radiology, Beijing Jishuitan Hospital, Beijing, 100035, PRC
CHENG Xiao-guang, Email: xiao65@263.net
Objective To investigate the changes of cross sectional area(CSA), mean CT value and mean bone mineral density(BMD)of the psoas major in postmenopausal spinal osteoporotic fractures. Methods According to the age(1 : 1 matched), we reviewed 50 postmenopausal women with spinal osteoporotic fracture(osteoporotic fracture group), mean age 67.3 years(range: 55 - 86 years), and 50 without spinal fractures(nonfracture group), mean age 67.6 years(range: 55 - 87 years). They all underwent Quantitative CT(QCT)examination in Beijing Jishuitan Hospital. The CSA, mean CT value and BMD of the bilateral psoas major were measured at L4-5levels. Results The CSA of the psoas major in the osteoporotic fracture group were(583.97 ± 140.70)mm2and(572.83 ± 138.68)mm2. The CSA of the psoas major in the non-fractures group were(753.68 ± 153.54)mm2and(741.68 ± 132.22)mm2. The CSA of the psoas major in the osteoporotic fracture group were significantly lower than that in the non-fracture group(P < 0.01). The mean CT values of the psoas major in the osteoporotic fracture group were(42.00 ± 9.00)Hu and(42.00 ± 12.25)Hu. The mean CT values of the psoas major in the non-fracture group were(35.80 ± 8.39)Hu and(35.50 ± 10.75)Hu. The mean CT values of the psoas major in the osteoporotic fracture group were slightly higher than that in the non-fracture group(P < 0.05). The mean BMD of the psoas major in the osteoporotic fracture group was(65.27 ± 25.62)mg / cm3. The mean BMD of the psoas major in the non-fractures group was(77.81 ± 33.90)mg / cm3. The mean BMD of the psoas major in the osteoporotic fracture group was significantly lower than that in the non-fracture group(P < 0.05). Conclusions Postmenopausal spinal osteoporotic fracture is associated with profound changes of the the psoas major.
Osteoporosis, postmenopausal; Radiography; Tomography, X-ray computed; Bone density;Psoas major
10.3969/j.issn.2095-252X.2016.08.005 中图分类号:R681, R445
北京市卫生局首都医学发展科研专项项目(2014-2-1122);北京市卫生局“215”高层次卫生技术人才培养计划(2009-2-03)
100035 北京积水潭医院放射科
程晓光,Email: xiao65@263.net
(2016-07-06)
猜你喜欢
中老年保健(2022年3期)2022-08-24
运动精品(2022年1期)2022-04-29
今日农业(2021年20期)2021-11-26
保健与生活(2021年17期)2021-09-17
保健医苑(2021年7期)2021-08-13
国际放射医学核医学杂志(2021年10期)2021-02-28
中华养生保健(2020年4期)2020-11-16
中国生殖健康(2019年2期)2019-08-23
中国生殖健康(2019年2期)2019-08-23
太原理工大学学报(2019年1期)2019-03-05