
Relationships among hamstring muscle optimal length and hamstring flexibility and strength
2017-09-21 11:54XinglinWnFengQuWillimGrrettHuiLiuBingYu
Xinglin Wn,Feng Qu,Willim E.Grrett,Hui Liu,*,Bing Yu*
aBiomechanics Laboratory,Beijing Sport University,Beijing 100084,China
bDuke Sports Medicine,Department of Orthopaedic Surgery,Duke University Medical Center,Durham,NC 27710,USA
cCenter for Human Movement Science,The University of North Carolina at Chapel Hill,Chapel Hill,NC 27599,USA
Relationships among hamstring muscle optimal length and hamstring flexibility and strength
Xianglin Wana,Feng Qua,William E.Garrettb,Hui Liua,*,Bing Yuc,*
aBiomechanics Laboratory,Beijing Sport University,Beijing 100084,China
bDuke Sports Medicine,Department of Orthopaedic Surgery,Duke University Medical Center,Durham,NC 27710,USA
cCenter for Human Movement Science,The University of North Carolina at Chapel Hill,Chapel Hill,NC 27599,USA
Background:Hamstring muscle strain injury(hamstring injury)due to excessive muscle strain is one of the most common injuries in sports.The relationships among hamstring muscle optimal lengths and hamstring flexibility and strength were unknown,which limited our understanding of risk factors for hamstring injury.This study was aimed at examining the relationships among hamstring muscle optimal length and flexibility and strength.
Methods:Hamstring flexibility and isokinetic strength data and three-dimensional kinematic data for hamstring isokinetic tests were collected for 11 male and 10 female recreational athletes.The maximal hamstring muscle forces,optimal lengths,and muscle lengths in standing were determined for each participant.
Results:Hamstring muscle optimal lengths were signi ficantly correlated to hamstring flexibility score and gender,but not to hamstring strength. The greater the flexibility score,the longer the hamstring muscle optimal length.With the same flexibility score,females tend to have shorter hamstring optimal muscle lengths compared to males.Hamstring flexibility score and hamstring strength were not correlated.Hamstring muscle optimal lengths were longer than but not signi ficantly correlated to corresponding hamstring muscle lengths in standing.
Conclusion:Hamstring flexibility may affect hamstring muscle maximum strain in movements.With similar hamstring flexibility,hamstring muscle maximal strain in a given movement may be different between genders.Hamstring muscle lengths in standing should not be used as an approximation of their optimal lengths in calculation of hamstring muscle strain in musculoskeletal system modeling.
©2017 Production and hosting by Elsevier B.V.on behalf of Shanghai University of Sport.This is an open access article under the CC BY-NC-ND license(http://creativecommons.org/licenses/by-nc-nd/4.0/).
Injury risk factor;Muscle biomechanics;Muscle length–tension relationship;Muscle optimal length;Muscle strain;Muscle strain injury
1.Introduction
Hamstring muscle strain injury(hamstring injury)is one of the most common injuries in track and field,soccer,Australian football,rugby,and American football involving high-speed running,jumping,and kicking,accounting for up to 29%of all injuries in these sports.1,2Although most hamstring injuries do not require surgical treatment,athletes typically need 2 to 8 weekstorecoverfromtheinjuriesandgetbacktotheirpreinjury levelofactivity,3–6whichresultsinsubstantialtimeand financial losses.7–9Athletes who sustained hamstring injuries have a highreinjury rate of 12%–31%.10,11Reinjured hamstrings take an even longer time to recover.12Repeated hamstring injury may resultinlongerrehabilitations,chronicpain,disability,andeven theendofanathleticcareer.13Becauseofthesigni ficant financial andtimelossandsigni ficantconsequencesofhamstringinjuries, intensive efforts have been made to prevent hamstring injuries and improve rehabilitation in the past 3 decades.A recent extensive review of literature with detailed injury rates,however, revealed that injury and reinjury rates remained unchanged,14which indicate a need for further studies on hamstring injury prevention and rehabilitation.
To effectively prevent and rehabilitate hamstring injury, identifying risk factors for the injury is critical.Flexibility and strength are 2 proposed risk factors for hamstring injury. However,the results of clinical studies on the effects of hamstring flexibility and strength on the risk of hamstring injury areinconsistent.Several studies showed that the risk of hamstring injurynegativelycorrelatedtohamstring flexibility,15–17whereas other studies showed no correlation.18–20In addition,studies showed that the risk of hamstring injury negatively correlated to the ratio of hamstring to quadriceps muscle strength,19,21,22whereas other studies showed no correlation.16,23,24
Several studies using animal models demonstrated that a muscle strain injury occurs when the muscle is stretched or during an eccentric contraction,and active muscle strain reaches a certain magnitude regardless of muscle force and strain rate.25–30These results suggest that the direct cause of muscle strain injury is muscle strain instead of muscle force and strain rate.Like other materials,muscle strain is de fined as the ratio of muscle length deformation to muscle resting length, which itself is de fined as the maximum muscle length at which the parallel elements are not generating force.31Muscle resting length can be approximated as the muscle optimal length, which is de fined as the muscle length at which the force generated by muscle contractile elements is maximal.32,33The greater the hamstring optimal lengths,the lower the maximal hamstring muscle strains in a given athletic task with similar range of lower extremity motion.
Hamstring flexibility and strength should be correlated to hamstring optimal lengths if they are risk factors for hamstring injury.However,the relationships of hamstring muscle optimal lengths with hamstring flexibility and strength are still unknown.An in vivo study that investigated the optimal knee flexion angle at which isokinetic knee flexion moment was maximal showed that legs recovered from hamstring injury had a greater optimal knee flexion angle in comparison to legs without the injury for the same athletes.34This result indicates that legs with hamstring injury may have shorter muscle optimal length in comparison to legs without injury.Alonso et al.35reported that the mean optimal knee flexion angles were 75°for legs with tight hamstring muscle and 65°for legs with more flexible hamstring muscles.Other studies showed that 6 to 8 weeks of stretching training improved hamstring flexibility and decreased optimal knee flexion angle by 4°to 10°.36,37These results indicate that hamstring muscle optimal lengths may be correlated to hamstring flexibility.However,the relationships of hamstring muscle optimal lengths with flexibility have not been established.Our literature review also did not reveal any association between hamstring strength and muscle optimal lengths.Furthermore,several studies indicated that muscle flexibility and strength were correlated,38–40whereas our literature review revealed that these indications have not been con firmed.In addition,hamstring muscle lengths in standing were used as an approximation of hamstring muscle optimal lengths to estimate hamstring muscle strains in athletic tasks.41–43Obtaining hamstring muscle length in standing is easier than obtaining hamstring muscle optimal lengths. However,the relationships of hamstring muscle lengths in standing with their optimal lengths are still unknown.
The purpose of this study was to determine the relationships among hamstring muscle optimal length, flexibility,and strength,and the relationship between hamstring muscle optimal length and hamstring muscle length in standing.We hypothesized that hamstring muscle optimal length would be positively correlated to hamstring flexibility and strength.We also hypothesized that hamstring strength and flexibility would be signi ficantly correlated.In addition,we hypothesized that hamstring muscle optimal length would be signi ficantly different from but signi ficantly correlated to hamstring muscle length in standing.
2.Materials and methods
2.1.Participants
Twenty-one college students(11 males and 10 females) regularly participating in exercise and sport activities volunteered to participate in this study and all participants gave written consent.The means of ages,standing heights,and body masses were 24.7±2.9 years,174.0±3.1 cm,and 65.6±5.9 kg,respectively,for male participants;and 23.6±0.9 years,163.8±3.8 cm,and 53.5±4.4 kg,respectively,for female participants.All participants had no history of hamstring injury or other lower extremity injuries that prevented them from performing the tasks in this study.The use of human subjects was approved by the Institutional Review Board of Beijing Sport University.
2.2.Protocol
Each participant had a 5–10 min warm-up including jogging and stretching,then underwent a passive straight leg raise (PSLR)test44(Fig.1)to evaluate hamstring flexibility and an isokinetic strength test to determine hamstring muscle optimal length for each leg.Each participant had 3 PSLR trials for each leg.The body position in maximum hip flexion angle in each PSLR trial was recorded.In the hamstring isokinetic strength test,retrore flective markers were placed bilaterally at the anterior superior iliac spine(ASIS),the top of the crista iliaca,the greater trochanter,the lateral and medial femur condyles,the lateral and medial malleolus,the tibial tuberosity,and the center of the second and third metatarsals.An additional marker was placed on the L4-L5 interface.The participant performed a calibration trial in a standing position,then the marker onL4-L5wasremoved.Theparticipantwasthen seated on the IsoMed2000 strength-testing system(D&R Ferstl GmbH,Hemau,Germany)with a hip flexion of 90°.The thigh and the lower leg of the test leg were secured on the seat and the dynamometer arm,respectively,of the strength-testing machine,in such a way that only knee flexion/extension movements were allowed and the knee flexion/extension axis was aligned with the rotation axis of the dynamometer.The rotation speed and range of the dynamometer arm movement were set at 10°/s and 110°,respectively,with the dynamometer arm position at leg fully extended as 0°.The participant had 3 isokinetic knee flexion trials with maximum effort for each leg with a 90 s rest between trials.Three-dimensional(3D)trajectories of re flective markers and knee flexion torques were recorded for each trial.

Fig.1.Passive straight leg raise test and hip flexion angle.
2.3.Data collection
The body position with maximal hip flexion angle in the PSLR test was recorded using a high-de finition digital camera with its optical axis perpendicular to the sagittal plane of the participant.3D trajectories of re flective markers were recorded using a videographic system with 10 video cameras(Oqus 400; Qualisys,Gothenburg,Sweden)at a sample rate of 100 frames per second and Qualisys Track Manager software.The knee flexion torque data measured by the dynamometer in the strength-testing system were collected using a MegaWin 2.4 system(Mega Electronics Ltd.,Kuopio,Finland)at a sample rate of 100 samples per channel per second.The videographic and dynamometer data collections were time synchronized by the Qualisys Track Manager computer program package.
2.4.Data reduction
Digital photos of the maximal hip flexion angle taken in the PSLR test were digitized using the Shixun Motion Analysis System Version 4.0(Beijing Sport University,Beijing,China). The hip flexion angle in each PSLR trial was reduced as the angle between the vector from the hip joint center to the knee joint center and the vector from the acromion process to the hip joint center(Fig.1).The average of the maximal hip flexion angles from 3 PSLR trials was used as the hamstring flexibility score for each leg.
The raw 3D trajectories of all re flective markers in each hamstring isokinetic strength-testing trial were filtered through a low-pass digital filter at a cut-off frequency of 10 Hz.45The 3D local coordinates of the L4-L5 marker in a pelvis reference frame were estimated using the 3D coordinates of markers on the ASIS and the right top of the crista iliaca in the standing calibration trail.The 3D trajectories of the L4-L5 marker in the laboratory reference frame were then estimated from its 3D local coordinates and the 3D trajectories of the markers on the ASIS and the right top of the crista iliaca in each strengthtesting trial.
The moment generated by hamstring muscles(MHam)at a given time point during strength testing was reduced as the differencebetweenthemomentmeasuredbythestrength-testing system and the moment of the gravitational force on shank and foot relative to the knee joint center.The moment due to gravitationalforcewascalculatedfromthemassofshankandfootand the locations of the center of mass of shank plus foot46and knee joint center.The strength-testing trial that had the maximal peak moment was selected for further data reduction and used in data analysis.
Muscle length of a given hamstring muscle in a selected strength-testing trial for each leg was determined as the distance between origin and insertion of the muscle and normalized to femur length,de fined as the distance between hip and knee joint centers.The 3D trajectories of the origins and insertions of each hamstring muscle in the laboratory reference frame were calculated from the location and orientation of the corresponding segment reference frames and the 3D local coordinates of the origins and insertions in the corresponding segment reference frames47(Table 1).The detailed calculations can be found elsewhere.48
The total hamstring force(FHam)at a given time during the strength testing was calculated as

where PBL,PBS,PSM,and PSTwere relative physiological crosssectional areas of biceps long head(28.54%),biceps short head (12.88%),semimembranosus(46.46%),and semitendinosus (12.12%),respectively,49whereas RBL,RBS,RSM,and RSTwere the moment arms of these 4 muscles relative to the knee joint center,respectively.The moment arm of each hamstring muscle was calculated as the distance between the knee joint center and the action line of the corresponding muscle in the sagittal plane of the shank.The maximal FHamwas identi fied for each leg and used as the measure of hamstring strength of the given leg.The force of each hamstring muscle was calculated as the product of FHamand corresponding physiological crosssectional area.Muscle optimal length of a hamstring muscle was identi fied as the muscle length corresponding to the calculated peak muscle force of the given hamstring muscle.Muscle lengths in standing position were also reduced from the standing calibration trial.
2.5.Data analysis
To test our first hypothesis,linear regression analysis with a dummy variable was performed to determine the relationships of optimal lengths with flexibility score and strength for each of the biceps long head,semimembranosus,and semitendinosus muscles.The full regression model was

where y was muscle optimal length,x1was hamstring flexibility score,x2was hamstring strength,β was the dummy variable representing gender(β=0 for male,β=1 for female),a0to a3were regression coef ficients,and e was the residual.The best regression equation was determined through a backward selection procedure.A regression coef ficient was kept in the regression equation if(1)the contribution of the corresponding term to the regression measured by partial R2was greater than 0.03and statistically signi ficant and(2)the overall regression was statistically signi ficant.
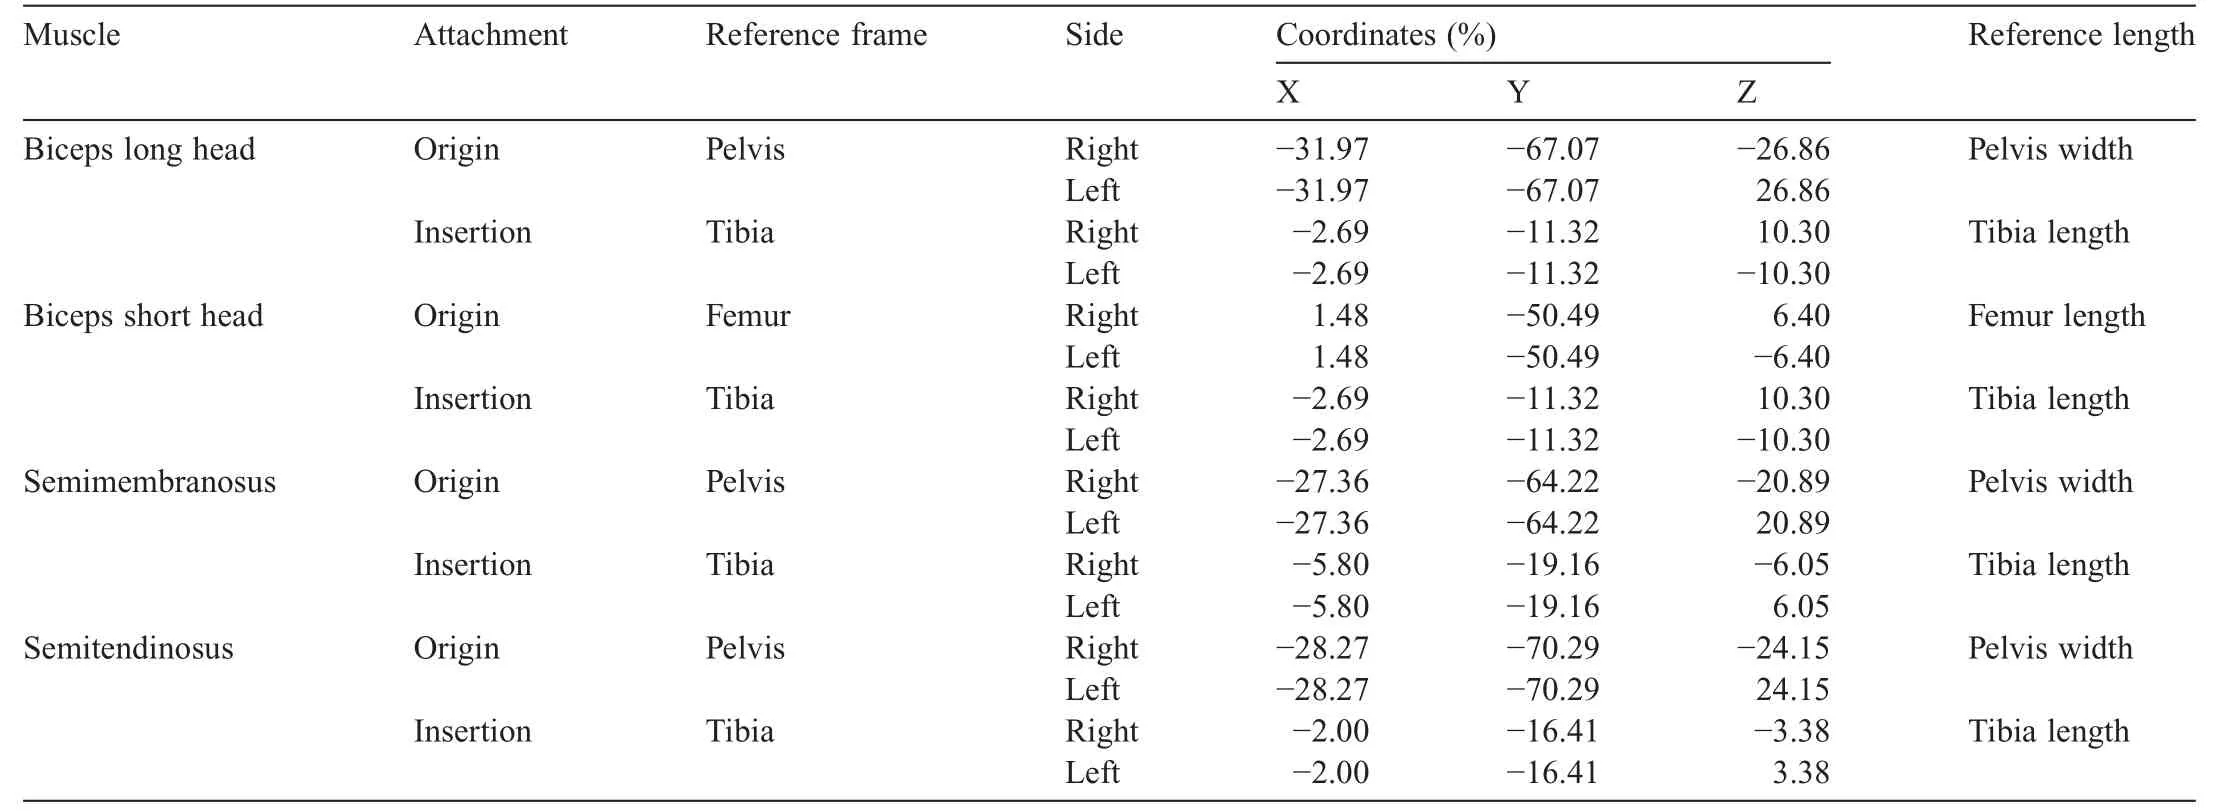
Table 1 Normalized three-dimensional coordinates of hamstring muscle attachment points in segment reference frames.
Linear regression analysis with a dummy variable was also performed to test our second hypothesis about the relationship between hamstring strength and flexibility score.The full regression model was

where y and x were hamstring strength and flexibility score, respectively,and β was the dummy variable representing gender (β=0 for male,β=1 for female).The best regression equation was determined using the same procedure and criteria as used for data analysis testing the first hypothesis.
Finally,paired t test and linear regression analysis with a dummy variable were performed to test our third hypothesis by determining the relationship of optimal length and the length in standing for each hamstring muscle.The full regression model was similar to that used in testing the second hypothesis with y as muscle optimal length and x as the corresponding muscle length in standing.All data analyses were performed using SPSS Version 16.0(SPSS Inc.,Chicago,IL,USA).Statistical signi ficance was de fined as the type I error rate less than or equal to 0.05.
3.Results
Length–tension relationships of the hamstring muscles were signi ficantly affected by the flexibility score(Fig.2).The best regression equation for the optimal muscle length(y)of the long head of the biceps as a function of flexibility score(x)and gender(β)was
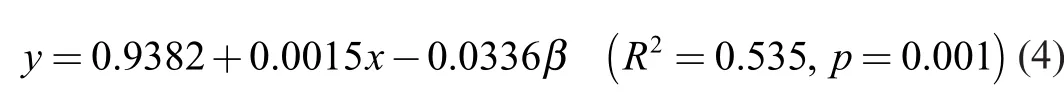
with the fractional contributions of flexibility score and gender to the overall regression as 0.3457(p<0.001)and 0.1893 (p<0.001),respectively(Fig.3A).The best regressionequation for the optimal muscle length(y)of the semimembranosus as a function of the flexibility score(x)and gender(β) was

Fig.2.Hamstring muscle length–force relationships of 2 participants with different flexibility:(A)biceps long head;(B)semimembranosus;(C) semitendinosus.Muscle length was normalized as a fraction of femur length (FL).Muscle force was normalized as a fraction of body weight(BW).
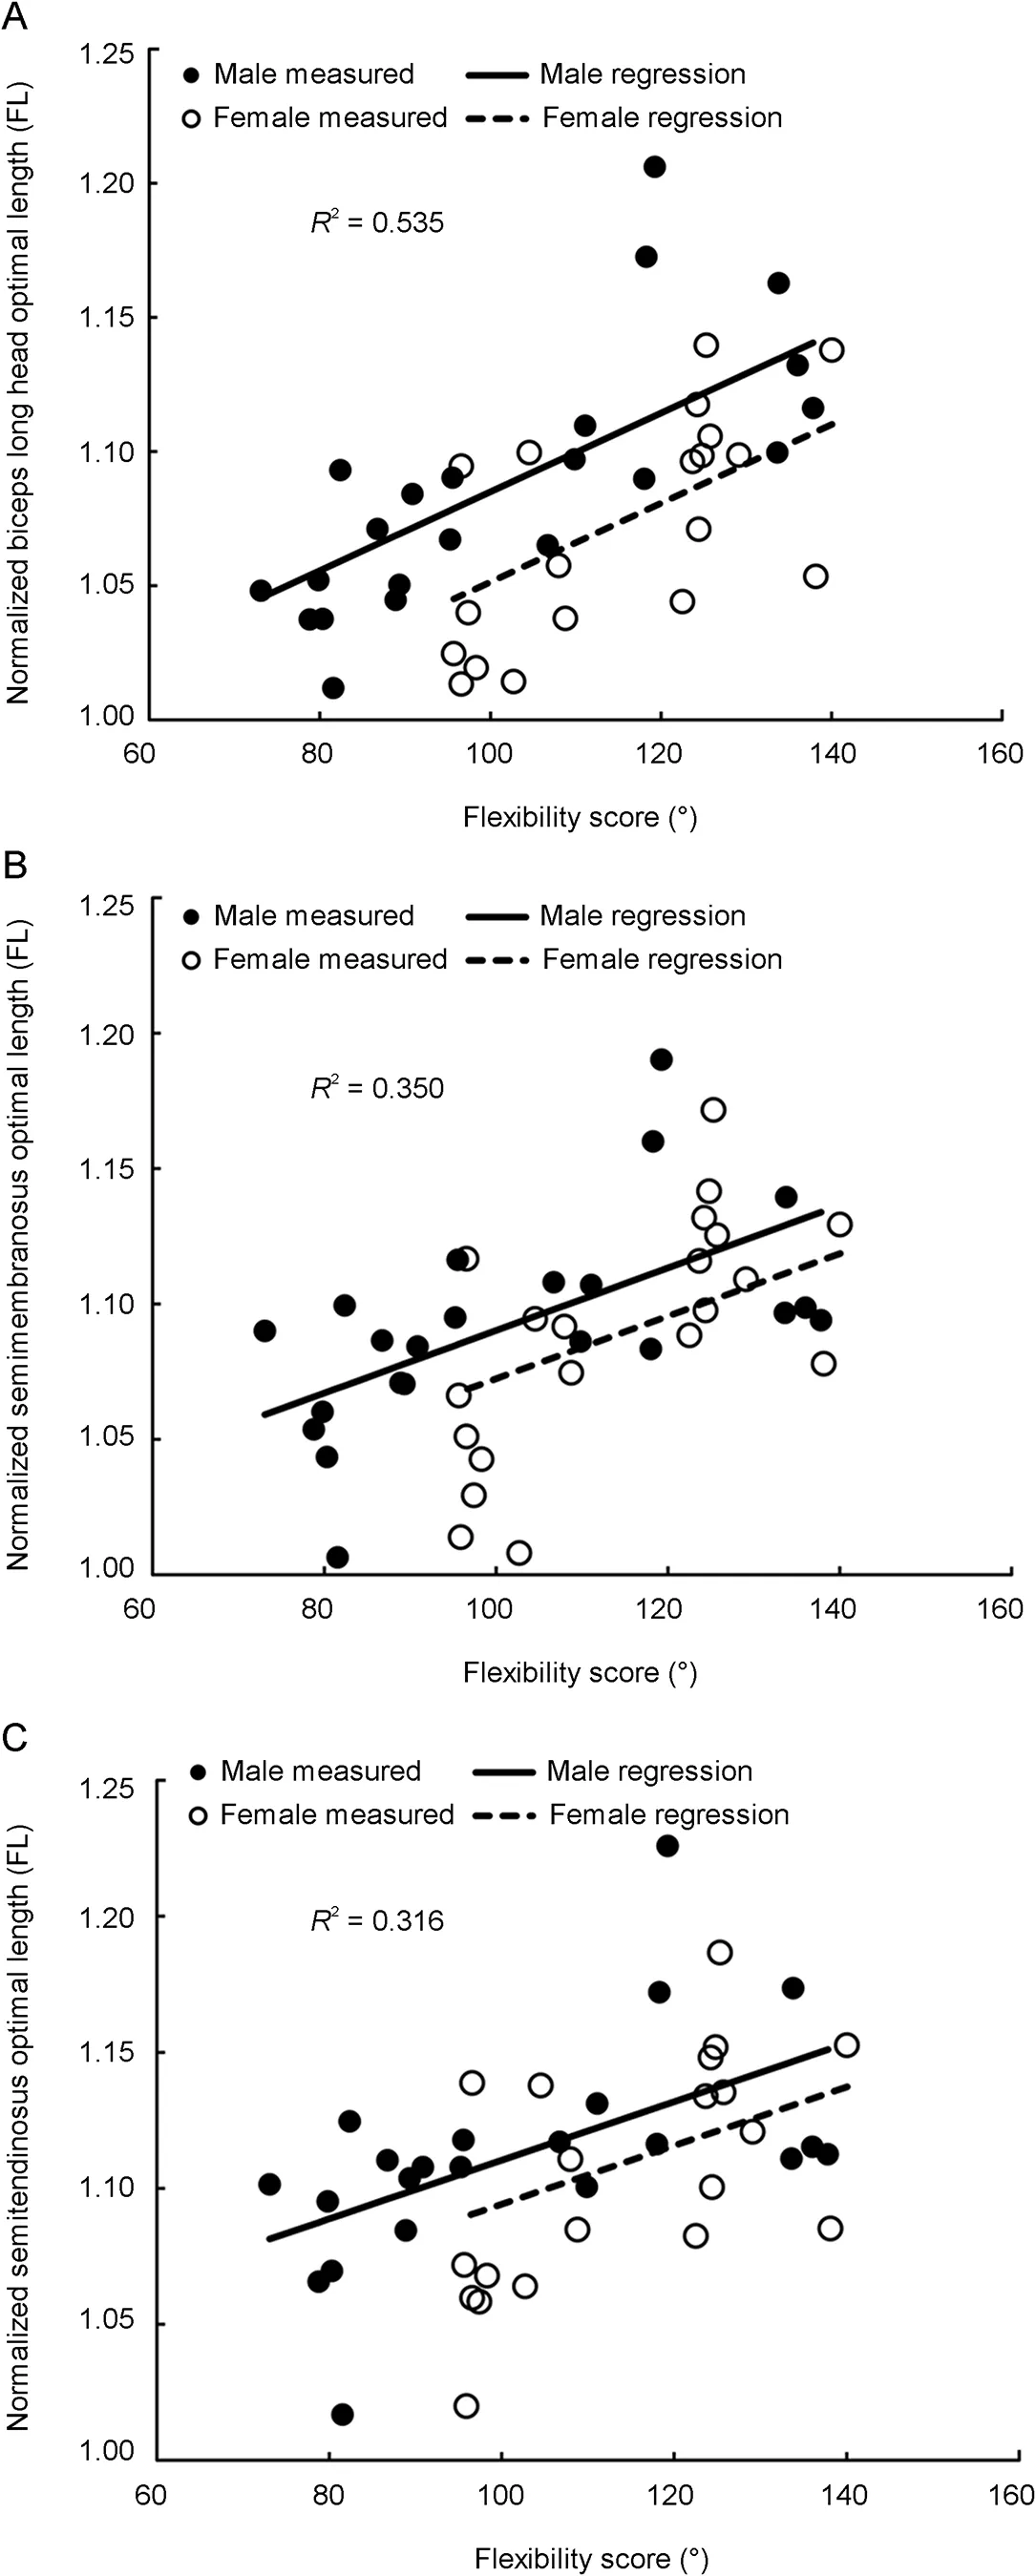
Fig.3.The relationship between flexibility score and(A)biceps long head optimal length normalized,(B)semimembranosus optimal length normalized, and(C)semitendinosus optimal length normalized,respectively,as a fraction of femur length(FL).
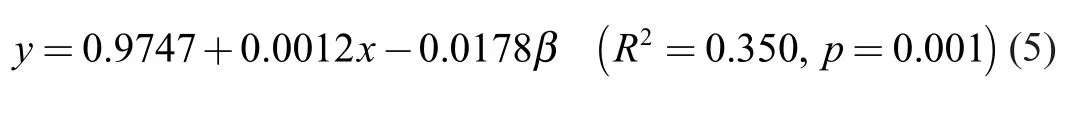
with the fractional contributions of flexibility score and gender to the overall regression as 0.2991(p<0.001)and 0.0509 (p=0.079),respectively(Fig.3B).The best regression equation for the optimal muscle length(y)of the semitendinosus as a function of the flexibility score(x)and gender(β)was

with the fractional contributions of flexibility score and gender to the overall regression being 0.2512(p<0.001)and 0.0658 (p=0.056),respectively(Fig.3C).Hamstring strength had no signi ficant contribution to either of above regressions(partial R2=0.012,p=0.505 for the long head of the biceps; partial R2=0.001,p=0.942 for the semimembranosus;and partial R2=0.001,p=0.901 for the semitendinosus).
Hamstring flexibility score was not signi ficantly correlated to hamstring strength(R2=0.006,p=0.622).Hamstring muscle optimal lengths were signi ficantly greater than corresponding muscle lengths in standing(p<0.001)(Table 2). Hamstring muscle optimal lengths were not signi ficantly correlated to corresponding muscle lengths in standing (R2=0.074,p=0.082 for biceps long head;R2=0.024, p=0.326 for semimembranosus;and R2=0.036,p=0.232 for semitendinosus).
4.Discussion
The results of this study partially support our first hypothesis that hamstring muscle optimal lengths would be positively correlated to hamstring flexibility and strength.The results showed that hamstring muscle optimal lengths were signi ficantly correlated to hamstring flexibility score but not to hamstring strength,which partially support our first hypothesis.The best regression equations showed that the greater the flexibility score,the longer the hamstring muscle optimal length.These results con firmed the results of previous studies that the optimalknee flexion angle for maximal knee flexion moment decreased as hamstring flexibility score increased,35which indicate that hamstring muscle optimal lengths may be affected by hamstring flexibility.

Table 2 Comparison of hamstring muscle optimal lengths to muscle lengths in standing position(mean±SD).
The results of this study support flexibility as a risk factor for hamstring injury.Previous studies showed that muscle strain injury was only related to active muscle strain,not muscle force.25–30Muscle strain is de fined as the ratio of muscle length deformation to muscle optimal length,50demonstrating that with the same muscle length deformity,the shorter the muscle optimal length,the greater the muscle strain.We showed that the better the hamstring flexibility,the longer the hamstring muscle optimal length.These results combined together suggest that in a given movement,athletes with good hamstring flexibility may have lower maximal hamstring muscle strains,and they imply that athletes with good hamstring flexibility may have lower risk for hamstring injury compared to athletes with poor hamstring flexibility.
The variation in hamstring muscle optimal lengths cannot be completely explained by the hamstring flexibility measure in this study.Hamstring flexibility was represented by hip joint range of motion with a straight knee in this study.Hip joint range of motion is affected not only by hamstring flexibility but also by hip joint capsule and ligament tightness.40This may explain the relatively low contribution of hamstring flexibility score to regressions of hamstring muscle optimal lengths in this study.
Hamstring muscle optimal lengths were not only correlated to flexibility but also to gender.The results of this study showed that with the same flexibility score,the hamstring muscle optimal lengths of females were shorter in comparison to males. Our literature review failed to find an explanation for this gender difference.These results,nevertheless,indicate that with the same flexibility,females may have greater maximum hamstring muscle strain and thus higher risk for hamstring injury in comparison to males.This indication,however,is inconsistent with what clinical studies showed.Data from the National Collegiate Athletic Association Injury Surveillance System showed that men have signi ficantly higher rates of hamstring strains than women in soccer,baseball,softball,and indoor track.51,52Opar et al.53showed that high school boys were at a greater risk of hamstring injury than high school girls in track and field and that there was no difference in the risk of sustaining hamstring injury between male and female collegiate athletes.One possible explanation of this discrepancy is that males might have larger range of motion compared to females when performing the same tasks.Future studies are needed to con firm the results of this study and previous clinical studies.
Although the results of this study showed that hamstring muscle optimal lengths and strength were not correlated,this does not necessarily mean that hamstring strength is not a risk factor for hamstring injury.Flexibility can be categorized as static or dynamic.Static flexibility represents the tolerance to stretch and is measured as range of joint motion,whereas dynamic flexibility represents the resistance to stretch and is measured as muscle stiffness.40Biomechanical models of muscleforcedemonstratedthatmusclestrengthisadeterminant ofmusclestiffness.54,55Inagivenposition,thegreaterthemuscle strength,the greater the muscle stiffness.Increasing muscle strengthmayincreasemuscleresistancetoelongationtoprevent muscle from being overstretched and cause a strain injury.This maybeparticularlyimportantforpreventionofhamstringinjury inthoseathletictasks,suchaskicking,inwhichhamstringswere substantially stretched in follow-up movements.
The results of this study showed that hamstring flexibility and strength were not signi ficantly correlated.These results do not support our second hypothesis,indicating that differences in hamstring flexibility do not explain differences in hamstring strength across individuals.These results were inconsistent with the finding of previous studies,which demonstrated relationships among muscle strength,stiffness,and flexibility,indicating that muscle flexibility and strength were negatively correlated.38–40This discrepancy can be explained by the effect of muscle flexibility on the muscle length–tension relationship found in this study.The results of this study showed that hamstring muscle length–tension relationships of participants who had better flexibility were shifted toward the direction of increased muscle length.With shifted length–tension relationships,a person with good flexibility would have lower muscle force compared to a person with poor flexibility when the muscle length was shorter than the optimal length(Fig.2).The strength-testing positions described in previous studies were likely to be set in such a way that muscle lengths were shorter than optimal lengths for most of the subjects,38,39therefore resulting in a negative correlation between muscle flexibility and strength.The hamstring strength in this study was measured as the maximal hamstring force in the length–tension relationship rather than joint torque or muscle force at a given lower extremity position.As the results of this study showed,this maximal concentric contraction force is not affected by the flexibility.
The results of this study showed that hamstring muscle optimal lengths were signi ficantly longer than but not signi ficantly correlated to corresponding hamstring muscle lengths in standing.These results partially support our third hypothesis, indicating that even if normalized to a body dimension,hamstring muscle length in a given position cannot be used as an approximation of hamstring muscle optimal length.Furthermore,optimal length is an important muscle parameter in muscle biomechanical models for estimating muscle force.54,55A recent study demonstrated that estimated muscle forces are sensitive to optimal lengths.56Using previously published muscle optimal lengths in muscle biomechanical models may result in signi ficant errors in estimated muscle forces even if these muscle optimal lengths are normalized to a body dimension.This is because of a large between-individual variation in muscle optimal lengths owing to a large betweenindividual variation in flexibility,as the results of this study showed.Muscle optimal lengths may need to be individualized for accurate estimates of muscle force.
The relationships between hamstring flexibility and optimal lengths found in this study are limited as cross-sectional relationships.These cross-sectional relationships only suggest that individuals with good hamstring flexibility may have longerhamstring muscle optimal lengths compared to those with poor flexibility,which does not necessarily mean that improving hamstring flexibility would result in an increase in hamstring optimal muscle lengths and thus a reduction of the maximal hamstring muscle strains in athletic tasks for a given individual. Studies have demonstrated that the cross-sectional difference in muscle optimal length was due to a difference in a number of sarcomeres in series in the muscle.57–59Whether the number of sarcomeres in series in muscles can be increased through flexibility training is still unknown.Although studies also showed that flexibility training could decrease optimal knee flexion angle,36,37whether flexibility training actually increased hamstring muscle optimal lengths is still unknown.Future longitudinal studies are needed to con firm that a cause-and-effect relationship exists between hamstring muscle optimal lengths and hamstring flexibility.
The calculated hamstring muscle forces in this study might contain errors when muscle lengths are short.These errors would mostly likely be due to errors in calculated muscle moment arms.We calculated the moment arm of each hamstring muscle as the distance between the knee joint rotation center and the action line of the corresponding muscle.The knee joint rotation center was de fined as a fixed point at the middle of the line connecting the medial and lateral femoral condyles.The actual knee rotation center moves distally toward the tibial plateau as the knee flexion angle is greater than 30°.60The errors in the location of actual knee joint rotation center might have resulted in overestimated hamstring muscle moment arms and underestimated hamstring muscle forces when the knee flexion angle was greater than 30°.This issue may explain the inconsistency in the muscle length–tension relationships between this study and previous reports.Although these errors in calculated hamstring muscle forces do not seem to affect the results of this study,hamstring muscle moment arms may be calculated using other techniques,such as ultrasound,to avoid errors in calculating hamstring muscle forces.Furthermore, future studies are needed to con firm and explain the gender difference in the relationship between hamstring flexibility and muscle optimal length found in this study.In addition,future studies are needed to determine whether muscle flexibility affects the maximal muscle strain in in vivo movements.
5.Conclusion
Hamstring muscle optimal lengths are positively correlated to hamstring flexibility across individuals.With the same flexibility score,females have shorter hamstring muscle optimal lengths compared with males.Hamstring muscle optimal lengths are not correlated to hamstring strength.Hamstring flexibility and strength are not correlated across individuals. Hamstring muscle optimal lengths are longer than but not correlated to the hamstring muscle lengths in standing.
Acknowledgment
This research was supported by the National Natural Science Foundation of China(No.81572212)and the Fundamental Research Funds for the Central Universities of China(No. 2016BS013).
Authors’contributions
XW carried out the the experiments,performed the data processing and statistical analysis,and drafted the manuscript; BY and HL conceived of the study,and participated in its design and coordination and helped to draft the manuscript;FQ and WEG helped to draft the manuscript.All authors have read and approved the final version of the manuscript,and agree with the order of presentation of the authors.
Competing interests
The authors declare that they have no competing interests.
1.Mendiguchia J,Alentorn-Geli E,Brughelli M.Hamstring strain injuries: are we heading in the right direction?Br J Sports Med 2012;46:81–5.
2.Opar DA,Williams MD,Shield AJ.Hamstring strain injuries:factors that lead to injury and re-injury.Sports Med 2012;42:209–26.
3.Orchard J,Seward H.Epidemiology of injuries in the Australian Football League,seasons 1997–2000.Br J Sports Med 2002;36:39–44.
4.Askling CM,Tengvar M,Saartok T,Thorstensson A.Acute first-time hamstringstrainsduringslow-speedstretching:clinical,magnetic resonance imaging,and recovery characteristics.Am J Sports Med 2007;35:1716–24.
5.Hunter DG,Speed CA.The assessment and management of chronic hamstring/posterior thigh pain.Best Pract Res Clin Rheumatol 2007; 21:261–77.
6.Sherry MA,Best TM.A comparison of 2 rehabilitation programs in the treatment of acute hamstring strains.J Orthop Sports Phys Ther 2004;34:116–25.
7.Ekstrand J,Healy JC,Walden M,Lee JC,English B,Hägglund M. Hamstring muscle injuries in professional football:the correlation of MRI findings with return to play.Br J Sports Med 2012;46:112–7.
8.Askling C,Saartok T,Thorstensson A.Type of acute hamstring strain affects flexibility,strength,and time to return to pre-injury level.Br J Sports Med 2006;40:40–4.
9.Hickey J,Shield AJ,Williams MD,Opar DA.The financial cost of hamstring strain injuries in the Australian Football League.Br J Sports Med 2014;48:729–30.
10.Croisier JL.Factors associated with recurrent hamstring injuries.Sports Med 2004;34:681–95.
11.Woods C,Hawkins RD,Maltby S,Hulse M,Thomas A,Hodson A.The Football Association Medical Research Programme:an audit of injuries in professional football—analysis of hamstring injuries.Br J Sports Med 2004;38:36–41.
12.Orchard J,Best TM.The management of muscle strain injuries:an early return versus the risk of recurrence.Clin J Sport Med 2002;12:3–5.
13.Askling CM,Tengvar M,Saartok T,Thorstensson A.Acute first-time hamstring strains during high-speed running:a longitudinal study including clinical and magnetic resonance imaging findings.Am J Sports Med 2007;35:197–206.
14.Liu H,Garrett WE,Moorman CT,Yu B.Injury rate,mechanism,and risk factors of hamstring strain injuries in sports:a review of the literature. J Sport Health Sci 2012;1:92–101.
15.Witvrouw E,Danneels L,Asselman P,D’Have T,Cambier D.Muscle flexibility as a risk factor for developing muscle injuries in male professional soccer players.A prospective study.Am J Sports Med 2003;31:41–6.
16.Worrell TW,Perrin DH,Gansneder BM,Gieck JH.Comparison of isokinetic strength and flexibility measures between hamstring injured and noninjured athletes.J Orthop Sports Phys Ther 1991;13:118–25.
17.Bradley PS,Portas MD.The relationship between preseason range of motion and muscle strain injury in elite soccer players.J Strength Cond Res 2007;21:1155–9.
18.Yeung SS,Suen AM,Yeung EW.A prospective cohort study of hamstring injuries in competitive sprinters:preseason muscle imbalance as a possible risk factor.Br J Sports Med 2009;43:589–94.
19.Orchard J,Marsden J,Lord S,Garlick D.Preseason hamstring muscle weaknessassociatedwithhamstringmuscleinjuryin Australian footballers.Am J Sports Med 1997;25:81–5.
20.Gabbe BJ,Bennell KL,Finch CF,Wajswelner H,Orchard JW.Predictors of hamstring injury at the elite level ofAustralian football.Scand J Med Sci Sports 2006;16:7–13.
21.Zakas A.Bilateral isokinetic peak torque of quadriceps and hamstring muscles in professional soccer players with dominance on one or both two sides.J Sports Med Phys Fitness 2006;46:28–35.
22.Croisier JL,Ganteaume S,Binet J,Genty M,Ferret JM.Strength imbalances and prevention of hamstring injury in professional soccer players:a prospective study.Am J Sports Med 2008;36:1469–75.
23.Henderson G,Barnes CA,Portas MD.Factors associated with increased propensity for hamstring injury in English Premier League soccer players. J Sci Med Sport 2010;13:397–402.
24.Bennell K,Wajswelner H,Lew P,Schall-Riaucour A,Leslie S,Plant D, et al.Isokinetic strength testing does not predict hamstring injury in Australian Rules footballers.Br J Sports Med 1998;32:309–14.
25.Brooks SV,Faulkner JA.Severity of contraction-induced injury is affected by velocity only during stretches of large strain.J Appl Physiol 2001;91:661–6.
26.Lieber RL,Friden J.Muscle damage is not a function of muscle force but active muscle strain.J Appl Physiol 1993;74:520–6.
27.Garrett WE,Safran MR,Seaber AV,Glisson RR,Ribbeck BM. Biomechanical comparison of stimulated and nonstimulated skeletal muscle pulled to failure.Am J Sports Med 1987;15:448–54.
28.Lieber RL,Friden J.Mechanisms of muscle injury gleaned from animal models.Am J Phys Med Rehabil 2002;81(Suppl.11):S70–9.
29.BestTM,McElhaneyJH,GarrettWJ,MyersBS.Axialstrain measurements in skeletal muscle at various strain rates.J Biomech Eng 1995;117:262–5.
30.Talbot JA,Morgan DL.The effects of stretch parameters on eccentric exercise-induced damage to toad skeletal muscle.J Muscle Res Cell Motil 1998;19:237–45.
31.Enoka RM.Neuromechanics of human movement.Champaign,IL:Human Kinetics;2008.
32.Hatze H.Estimation of myodynamic parameter values from observations on isometrically contracting muscle groups.Eur J Appl Physiol Occup Physiol 1981;46:325–38.
33.Kaufman KR,An KN,Litchy WJ,Chao EY.Physiological prediction of muscle forces—II.Application to isokinetic exercise.Neuroscience 1991;40:793–804.
34.Brockett CL,Morgan DL,Proske U.Predicting hamstring strain injury in elite athletes.Med Sci Sports Exerc 2004;36:379–87.
35.Alonso J,McHugh MP,Mullaney MJ,Tyler TF.Effect of hamstring flexibility on isometric knee flexion angle-torque relationship.Scand J Med Sci Sports 2009;19:252–6.
36.Chen CH,Nosaka K,Chen HL,Lin MJ,Tseng KW,Chen TC.Effects of flexibility training on eccentric exercise-induced muscle damage.Med Sci Sports Exerc 2011;43:491–500.
37.Ferreira GN,Teixeira-Salmela LF,Guimaraes CQ.Gains in flexibility related to measures of muscular performance:impact of flexibility on muscular performance.Clin J Sport Med 2007;17:276–81.
38.Wilson GJ,Wood GA,Elliott BC.The relationship between stiffness of the musculature and static flexibility:an alternative explanation for the occurrence of muscular injury.Int J Sports Med 1991;12:403–7.
39.Wilson GJ,Murphy AJ,Pryor JF.Musculotendinous stiffness:its relationship to eccentric,isometric,and concentric performance.J Appl Physiol 1994;76:2714–9.
40.Gleim GW,McHugh MP.Flexibility and its effects on sports injury and performance.Sports Med 1997;24:289–99.
41.Thelen DG,Chumanov ES,Hoerth DM,Best TM,Swanson SC,Li L,et al. Hamstring muscle kinematics during treadmill sprinting.Med Sci Sports Exerc 2005;37:108–14.
42.Wood G.Biomechanical limitations to sprint running.Med Sci Sports Exerc 1987;25:58–71.
43.Chumanov ES,Heiderscheit BC,Thelen DG.The effect of speed and in fluence of individual muscles on hamstring mechanics during the swing phase of sprinting.J Biomech 2007;40:3555–62.
44.Gajdosik RL,LeVeau BF,Bohannon RW.Effects of ankle dorsi flexion on active and passive unilateral straight leg raising.PhysTher 1985;65:1478–82.
45.Yu B,Gabriel D,Noble L,An K.Estimate of the optimum cutoff frequency fortheButterworthlow-passdigital filter.JApplBiomech1999;15:318–29.
46.De Leva P.Adjustments to Zatsiorsky-Seluyanov’s segment inertia parameters.J Biomech 1996;29:1223–30.
47.Pierrynowski MR.Analytical representation of muscle line of action and geometry.In:Allard P,Stokes IAF,Blanchi JP,editors.Three-dimensional analysisofhumanmovement.Champaign,IL:HumanKinetics; 1995.
48.Yu B,Queen RM,Abbey AN,Liu Y,Moorman CT,Garrett WE. Hamstring muscle kinematics and activation during overground sprinting. J Biomech 2008;41:3121–6.
49.Ward SR,Eng CM,Smallwood LH,Lieber RL.Are current measurements of lower extremity muscle architecture accurate?Clin Orthop Relat Res 2009;467:1074–82.
50.Chang Y,Su F,Wu H,An K.Optimum length of muscle contraction.Clin Biomech(Bristol,Avon)1999;14:537–42.
51.Cross KM,Gurka KK,Saliba S,Conaway M,Hertel J.Comparison of hamstring strain injury rates between male and female intercollegiate soccer athletes.Am J Sports Med 2013;41:742–8.
52.Dalton SL,Kerr ZY,Dompier TP.Epidemiology of hamstring strains in 25 NCAA sports in the 2009–2010 to 2013–2014 academic years.Am J Sports Med 2015;43:2671–9.
53.Opar DA,Drezner J,Shield A,Williams M,Webner D,Sennett B,et al. Acute hamstring strain injury in track-and- field athletes:a 3-year observational study at the Penn Relay Carnival.Scand J Med Sci Sports 2014;24:e254–9.
54.Kaufman KR,An KN,Chao EY.Incorporation of muscle architecture into the muscle length-tension relationship.J Biomech 1989;22:943–8.
55.Kaufman KR,An KW,Litchy WJ,Chao EY.Physiological prediction of muscle forces—I.Theoretical formulation.Neuroscience 1991;40:781–92.
56.Xiao M,Higginson J.Sensitivity of estimated muscle force in forward simulation of normal walking.J Appl Biomech 2010;26:142–9.
57.Coutinho EL,Gomes AR,Franca CN,Oishi J,Salvini TF.Effect of passive stretching on the immobilized soleus muscle fiber morphology.Braz J Med Biol Res 2004;37:1853–61.
58.Cox VM,Williams PE,Wright H,James RS,Gillott KL,Young IS,et al. Growth induced by incremental static stretch in adult rabbit latissimus dorsi muscle.Exp Physiol 2000;85:193–202.
59.Proske U,Morgan DL.Muscle damage from eccentric exercise: mechanism,mechanical signs,adaptation and clinical applications. J Physiol 2001;537:333–45.
60.Yamaguchi GT,Zajac FE.A planar model of the knee joint to characterize the knee extensor mechanism.J Biomech 1989;22:1–10.
6 September 2015;revised 11 November 2015;accepted 20 January 2016
Available online 21 April 2016
Peer review under responsibility of Shanghai University of Sport.
*Corresponding authors.
E-mail addresses:liuhuibupe@163.com(H.Liu);byu@med.unc.edu (B.Yu)
http://dx.doi.org/10.1016/j.jshs.2016.04.009
2095-2546/©2017 Production and hosting by Elsevier B.V.on behalf of Shanghai University of Sport.This is an open access article under the CC BY-NC-ND license(http://creativecommons.org/licenses/by-nc-nd/4.0/).
 Journal of Sport and Health Science2017年3期
- Journal of Sport and Health Science的其它文章
- Time for a paradigm shift in the classi fication of muscle injuries
- Rehabilitation and return to sport after hamstring strain injury
- Risk factors for hamstring injuries in Australian male professional cricket players
- The effect of hamstring flexibility on peak hamstring muscle strain in sprinting
- Motivation dimensions for running a marathon:A new model emerging from the Motivation of Marathon Scale(MOMS)
- The ethics of exercise in eating disorders:Can an ethical principles approach guide the next generation of research and clinical practice?