
Role of mesoscale eddies on atmospheric convection during summer monsoon season over the Bay of Bengal:A case study
2018-03-14 12:36VenktSiGulkrmNreshKrishnVissPrsdKumrBhskrn
Venkt Si Gulkrm Nresh Krishn Viss Prsd Kumr Bhskrn
a Department of Earth and Atmospheric Sciences, National Institute of Technology Rourkela, Dist: Sundargarh, Odisha, 769008, India
b Department of Ocean Engineering & Naval Architecture, Indian Institute of Technology, Kharagpur, Kharagpur, 721302, West Bengal, India
Abstract Our study aims to understand the variability of oceanic mesoscale eddies during contrasting (2009 and 2013) monsoon seasons and the role of such eddies on atmospheric deep convection over the Bay of Bengal (BoB). Oceanic eddies are detected and tracked using sea surface height anomalies (SSHA), by employing the Okubo-Weiss parameter eddy detection method. Significant differences in the SSHA and eddy activity are evident during the contrasting monsoon years. During the year 2013 (2009), anticyclonic eddies are predominant (absent) in the eastern BoB and longer (shorter) lifespans of cyclonic eddies are observed in the northern and western BoB. Analysis of time-longitude SSHA and zonal wind stress reveals the presence of strong (weak) equatorial downwelling Kelvin waves, coastal Kelvin waves and Rossby waves in the BoB during 2013 (2009) Indian summer monsoon (ISM). The variability of eddies in the BoB during contrasting monsoons is attributed by the remote forcing effect of planetary scale waves. Our study is extended to investigate the associated atmospheric deep convection over the regions of cyclonic and anticyclonic eddies. Lag-correlations demonstrates that SSHA leads the outgoing longwave radiation by four days over anticyclonic eddy regions. Findings from the present study provide new insight into the internal dynamics of the ocean.
Keywords: Oceanic mesoscale eddies; Bay of Bengal; Summer monsoon season; Kelvin and Rossby waves; Atmospheric convection.
1.Introduction
Oceanic mesoscale eddies are omnipresent and turbulent in nature. Circulation is the characteristic of oceanic eddies that rotate in either a cyclonic (i.e. colder water and at the center of the eddy sea level is lower) or anticyclonic (i.e. warmer water and at the center of the eddy sea level is elevated) [13,14] .One can determine the ‘weather' of the ocean by the presence of oceanic mesoscale eddies. They possibly play a key role in transporting heat, momentum, dissolved carbon and tracers through the oceans [16,28,47] . Moreover, more than half of the oceanic kinetic energy is attributed to mesoscale eddy fields [2,3,10,18,31,47] . Knowledge of oceanic mesoscale eddies is important in many oceanic and atmospheric studies:such as delineating good and bad monsoon years, heat transport, acoustic propagation, optimum shipping route planning,fishery forecasting and zoning [41] .
The Bay of Bengal (BoB) is a semi enclosed basin in the northern Indian Ocean (NIO). The circulation characteristics of the BoB are quite complex and unique in the world due to the effect of its low surface salinity water caused by the discharge from major riverine systems, the semi-annual reversal of monsoon winds (Southwest and northeast) and occurrence of tropical cyclones [2,25,40,44,49,50,51] . In the BoB oceanic mesoscale eddies were first reported in 1957 [34] ;eddies of scales 10-100 km were prevalent and could persist for days to months. The stability and presence of eddies in the BoB can depend on the baroclinic instability and the mean eddy energy [9] . During the summer monsoon season, the BoB mesoscale eddies play an important role in the vertical transfer of nutrients from the halocline to the oligotrophic euphotic zone [22,31] . The BoB experiences first upwelling (downwelling) Kelvin waves during January-March (April-July) and the second upwelling (downwelling) Kelvin waves during August-September (October-December, respectively) [35] . These waves are one of the primary factors for the genesis of mesoscale eddies in the BoB. In the central BoB, radiated Rossby waves can be sustained longer as eddies in comparison with Kelvin waves [47] . The other factors that are responsible for the variability of mesoscale eddies in the BoB other than planetary waves are wind stress curl,ocean circulation and baroclinic instability [3,31] .

Table 1 Summary of the datasets used in the present study.
The ISM is an example of an intense ocean-atmosphere coupled system. The exchange of heat and moisture between the ocean and atmosphere plays a critical role in governing monsoon rainfall. Previous researchers have quantified the relationship between BoB sea surface temperature (SST) variability and its role in monsoon convection [37,43] . The main hypothesis of the present study is the variability of mesoscale eddies does play an important role in atmospheric convection,to validate the hypothesis a case study has been taken. The present study investigates the variability of mesoscale eddies during the ISM season and its relationship with atmospheric convection over the BoB. In this context, we have considered two contrasting monsoon seasons (2009 & 2013) in terms of rainfall, atmospheric, and oceanic circulation.
The next section will provide detailed information pertaining to the data sets used in the present study. Subsequently,the methods employed in the present study, including the detection and tracking of mesoscale eddies, will be discussed.A Succinct overview and synoptic characterization of the selected contrasting monsoon years (2009 & 2013) will be presented. The analysis will then be undertaken to quantify the characteristics of mesoscale eddies during contrasting monsoon years. Possible drivers for the changes in mesoscale eddies are elucidated. The Results and Discussion will be combined to better assimilate several emerging outcomes.
2.Data
Our study uses the latest version of the multi-mission altimeter satellite gridded daily SSHA dataset obtained from the Copernicus Marine Environment Monitoring Service.Daily SSHA fields are used to detect and track the oceanic mesoscale eddies in the BoB. The synoptic characteristics of contrasting monsoon seasons are examined using Tropical Rainfall Measuring Mission (TRMM, 3B43), the 850 hPa wind field from NCEP/NCAR Reanalysis data [23] and longterm and monthly interpolated outgoing longwave radiation(OLR) [26] for the study period that were obtained from the National Oceanic and Atmospheric Administration (NOAA),Physical Science Division (PSD). Daily high-resolution OLR data are obtained from the Indian Space Research Organization Kalpana I satellite, which are used to investigate the associated convection over the regions of mesoscale eddies during contrasting monsoon seasons of 2009 and 2013.Daily satellite merged CMORPH (Climate Prediction Centre MORPHing technique) rainfall data is used over the regions of mesoscale eddies. Details about the 2009 and 2013 annual monsoon reports are assessed from the Indian Meteorological Department (IMD) ( http://www.imd.gov.in/pages/monsoon _ main.php ). Further details and a summary of the datasets used in the present study are given in Table 1 .
3.Methods
3.1. Eddy detection method
Identification and sampling of oceanic mesoscale eddies from in-situ and altimetry satellite measurements have been an area of immense interest during the last four decades[6,7,20,21,39] . In the present study, we have employed the widely adopted physical based Okubo-Weiss (OW) parameter[32,52,55] method to identify oceanic mesoscale eddies from the daily SSHA because it is a well-established algorithm for detection of eddies and the value of OW parameter is a velocity gradient tensor, it decides whether the vorticity dominates over strain.

whereSn,Ssand ω are normal strain, shear strain, and vorticity respectively, in which

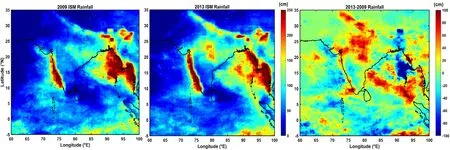
Fig. 1. TRMM 3B43 ISM season rainfall (cm) for the years 2009, 2013 and the seasonal rainfall difference (2013-2009).
where u and v are zonal and meridional geostrophic components of velocity, which are calculated from SSHA fields (h)as follows:

wheregis gravitational force,fis Coriolis factor, andxandyare horizontal coordinates. Generally OW<0, corresponds to vorticity dominated regions. The choice of the threshold on the OW parameter defines the precision and ability to identify an eddy. Therefore, we have used OW< -0. 2 σw[16] as a threshold value to determine the region of the eddy core,where σwis the standard deviation ofOW.
3.2. Eddy properties
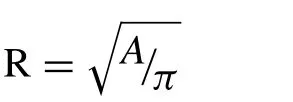
In order to represent the eddy size and intensity, we have calculated the eddy radius (R) and eddy kinetic energy (EKE)[33] . The radius of an eddy is defined as the radius of a circle with area (A), which is surrounded by the closed eddy edge.
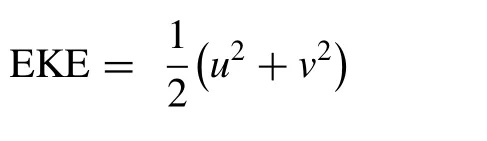
The intensity of an eddy is generally represented with the EKE, and it is obtained as
3.3. Eddy tracking method
After the detection of mesoscale eddies using the OW method, cyclonic (positive) and anticyclonic (negative) eddies are classified based on their vorticity. It is ensured that eddies were physically inspected for the two monsoon seasons of 2009 and 2013 based on daily SSHA maps. For cases with duplication in eddies, i.e. a pair of eddies found within the same closed counter of positive or negative SSHA, those eddies are also eliminated from the present study.
Tracking of eddies is very useful to understand their evolution, movement and lifespan. In this context, an automatic eddy-tracking algorithm is employed in the present study[33] ,
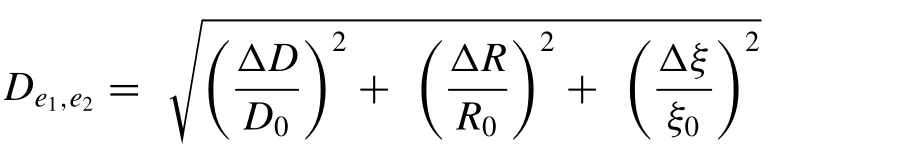
In this method ‘ ΔD', ‘ ΔR'and ‘ Δξ0'are the distance,radius and vorticity between the eddy ‘e1'on a given day and the eddy ‘e2'on the next day, rotating in the same sense as eddy ‘e1'(clockwise or anticlockwise), respectively. Where Do, Roand ξ0are the characteristic length (100 km), radius(50 km), and vorticity (10-6s-1), respectively. Eddy pairs are tracked based on the criteria whereDe1,e2is minimum. Eddies with life spans of less than 15 days are not considered in the present study [13] .
4.Results and discussions
4.1. Overview of the mean characteristics of contrasting monsoon years (2009 & 2013)
In 2009, ISM rainfall was 23% lower than the long-term average. The onset of the monsoon over Kerala was on 23rd May, 2009 with slow progressive and followed by a massive deficit of 48% in June rainfall due to unfavorable conditions imposed by two important climate phenomena such as the early onset of El Niño Modiki and Southern Oscillation (ENSO) and equatorial Indian Ocean Oscillation. The change in SST gradient between the BoB and Eastern Equatorial Indian Ocean is also reported as one of the major factors that contributed to the rainfall deficit [1,4,5,15] . In 2013, ISM rainfall was approximately 6% above the long-term mean. In that year, June had an excess of rainfall about + 34% coinciding with one of the fastest progression of monsoon in the last seven decades [22] . Chattopadhyay et al. [8] hypothesized that influence of strong extratropical SST anomalies of North Pacific and Atlantic in coincidence with the weak tropical SST anomalies could have led to the above normal monsoon rainfall in 2013.

Fig. 2. OLR (Wm -2 ) and 850 hPa wind anomalies (ms -1 ) of 2009 and 2013 ISM from the long-term mean (1981-2010).
Monsoon seasonal (JJAS) rainfall for 2009 and 2013, and the rainfall difference between 2013 and 2009 are shown in Fig. 1 . Significant positive values of rainfall anomaly( ~80 cm) were evident over the Indian landmass and BoB during 2013, whereas large negative rainfall differences are noticed over north-eastern India, north-eastern BoB and the Deccan Plateau. Composite OLR and 850 hPa wind anomalies (difference from the actual value to the long-term mean)for the 2009 and 2013 monsoon season are shown in the Fig. 2 . Anomalies of the seasonal OLR composite signify the presence of enhanced deep (suppressed shallow) convection evident over the monsoon trough region and BoB during 2013 (2009). During the 2009 ISM, anomalous anticyclonic circulation prevailed over the Indian sub-continent with weakened westerly winds over the eastern Arabian Sea. During the 2013 ISM in concurrence with enhanced convection, cyclonic circulation and strengthened westerly winds are evident over the Indian sub-continent. JJAS (June, July, August and September) seasonal average and differences between SSHA and geostrophic currents for the 2009 and 2013 are shown in Figure S1. Significant differences in SSHA and geostrophic currents are evident between both years. Positive values of SSHA are significantly dominant in the BoB and Equatorial Indian Ocean during 2013 in comparison with 2009. Predominant (weakened) anticyclonic circulation is evident over the western BoB, and cyclonic circulation is prevalent (absent) in the south western BoB during 2013 (2009).
The above mentioned reported synoptic characteristics and observed findings from the present study (rainfall, OLR, 850 hPa winds, SSHA and geostrophic currents) between the monsoon seasons of 2009 and 2013 motivated us to investigate the variability of mesoscale eddies between these contrasting monsoon seasons. Whereas none of the previous studies have focused on mesoscale eddies, comparison of the monsoonal 2013 mesoscale eddies with those from 2009 could provide an additional insight of summer monsoon failure.
4.2. Variability of mesoscale eddies
Anticyclonic and cyclonic eddies are identified and tracked using the OW method from daily SSHA data. Identified mesoscale eddies for the months of June to September in 2009 and 2013 are shown in Fig. 3 , over the background of monthly averaged SSHA. Detected eddies might not always match with the background monthly SSHA fields. Significant differences in the position and amplitude of mesoscale eddies are evident in the contrasting monsoon years. The differences between cyclonic and anticyclonic eddies for the years 2009 and 2013 are tabulated and shown in Table 2 . During the months of June and July, in the western BoB a pair of cyclonic and anticyclonic eddies prevail in both years, whereas during 2009 strong cyclonic eddies (with large amplitude of SSHA values) are prominent in this region. Durand et al.[11] reported a similar pair of cyclonic and anticyclonic eddies in the western BoB region. In the western BoB, Somayajulu et al. [46] report similar observations made during El Nino monsoon years. In the central and eastern BoB large bands of positive SSHA and anticyclonic eddies are evident during 2013; however, during 2009 such features are not prominent.
The presence of a large SSHA band and anticyclonic eddies in the central BoB during 2013 could be associated with the presence of a warm gyre that forms in the pre-monsoon season [29] . The absence of anticyclonic eddies and a warm gyre in the central BoB during June 2009 could be linked with the passage of the severe Cyclone Aila (24th-26th May 2009) [5] induced SST cooling and strong cyclonic winds.In the northern BoB (north of 18 °N) cyclonic eddies prevailed during both the years. Formation of cyclonic eddies in this region is associated with the instability triggered by the cross-shore density gradient [31] , whereas during the year 2013 they are prominent during August and September. The longer life span of cyclonic eddies in the northern BoB in 2013 compared to 2009, could be attributed to the interannual variability of wind forcing [38] . Tracks of cyclonic and anticyclonic eddies for the 2009 and 2013 monsoon seasons are shown in Fig. 4 . Further, eastward propagating equatorial Kelvin waves, radiated westward propagating Rossby waves,and coastal Kelvin waves play major roles in the evaluation of mesoscale eddies [17,35,47] . The plausible role of planetary scale Kelvin and Rossby waves on the variability and evolution of mesoscale eddies and sea-level anomalies during the contrasting monsoon seasons is investigated in the next section.

Fig. 3. JJAS monthly mean SSHA (cm) for the years 2009 and 2013 overlaid by the individual detected anticyclonic (solid circle) and cyclonic (dashed circles) by OW method. Eddies life span of more than 15 days are considered in the present study, starting of detected eddies of particular month are only shown.

Table 2 Anticyclonic and cyclonic eddy characteristics during summer monsoon season (2009 and 2013) over the different quadrants of Bay of Bengal (Figure S1C).
4.3. Role of planetary scale waves on the variability of mesoscale eddies

Fig. 4. Tracks of anticyclonic (red) and cyclonic eddies (blue) during the 2009 and 2013 ISM, starting positions of eddies are shown with star symbol. (For interpretation of the references to color in this figure legend, the reader is referred to the web version of this article.)

Fig. 5. Time-longitude averaged ( ±2 °N/S) SSHA (cm) and zonal wind stress (10 -2 Nm -2 ) for the 2009 and 2013 monsoon seasons, arrow denotes the eastward movement of downwelling Kelvin wave.
Longitude-time fields of daily SSHA (cm) and zonal wind stress averaged along the latitudinal band of 2 °N - 2 °S from 40 °to 100 °E for the 2009 and 2013 monsoon seasons are shown in Fig. 5 . During 2013, a large band of positive SSHA values is evident in the month of June over the eastern equatorial Indian Ocean, whereas from July to September similar features are observed in the central and western equatorial Indian Ocean. Overall, the spatial distribution of SSHA bands over the equatorial Indian Ocean during the 2009 ISM is analogous that of year 2013; however positive SSHA bands are predominant during 2013. Similarly, zonal wind stress over the equatorial region signifies strong (weak) westerly winds during the monsoon season of 2013 (2009). A large band of positive SSHA and zonal wind stress values signifies the presence of the first downwelling Kelvin waves that generally occurs during May-August eddies [17,30,35,47] . During the summer monsoon of 2013 (2009) the strength of downwelling Kelvin waves was strong (weak). These eastward propagating downwelling Kelvin waves encountered the Sumatra coast and diverged into two branches. The northward propagating branch turned counterclockwise and moved along the coastal regions of the BoB [35] as a first downwelling coastal Kelvin wave. Such a feature was prominently (feebly) evident during the summer season of 2013 (2009). Further, the equatorial winds, which drive the equatorial downwelling Kelvin waves, reflect at the eastern boundary and induce westward moving downwelling Rossby waves [35] . It further initiates during pre-monsoon season and influences the SST,SSHA and mesoscale eddies during the summer monsoon season in the BoB [5,12,31,49,53] . Propagation of Rossby waves can be tracked with the help of meridional average longitude- time SSHA and zonal wind stress maps [45,48] .Longitude-time fields of daily SSHA (cm) and zonal wind stress averaged along the latitudinal band of 10 °-15 °from 80 °to 100 °E for the 2009 and 2013 monsoon seasons are shown in Fig. 6 . Westward propagation of higher (lower)values of positive SSHA are evident during the monsoon of 2013 (2009). Longitude-time zonal wind stress over the BoB signifies the intraseasonal variability of monsoon season; prolonged breaks in the 2009 monsoon season during June and August are depicted with weakened westerly and easterly wind stress magnitudes. Strong (weak) equatorial downwelling Kelvin waves, coastal downwelling Kelvin waves along the eastern rim of BoB and westward propagating Robby waves are all attribute to the occurrence (absence)of strong anticyclonic eddies in the eastern and southeastern BoB during the 2013 (2009). Westward movement of mesoscale eddies ( Fig. 4 ) during contrasting monsoon seasons is associated with Rossby wave propagation in the BoB.A schematic diagram of the contrasting features of these waves and their strengthening in the tropical Indian Ocean during the 2009 and 2013 monsoon seasons is presented in Fig. 7 , along with seasonally averaged vertical structure of near equatorial ( ±2 °N/S) ocean temperatures of 2009 and 2013 monsoon season are also shown in Fig. 7 .
Near equatorial ocean temperature structure signifies the warmer upper ocean (0-100 m) in the eastern equatorial Indian Ocean during both of the monsoon seasons. During 2013 (2009) deeper (shallower) thermocline (depicted from the depth of the 20 °C isotherm, D20) is prevalent along with large differences in D20 between the monsoon seasons that are clearly evident in the central equatorial Indian Ocean( ~75 °E). This signifies the presence of strong (weak) equatorial Kelvin Waves during 2013 (2009).
4.4. Atmospheric convection associated with mesoscale eddies

Fig. 6. Time-longitude averaged (10 °-15 °N) SSHA (cm) and zonal wind stress (10 -2 Nm -2 ) for the 2009 and 2013 monsoon seasons, arrow denotes the westward movement of downwelling Rossby wave.
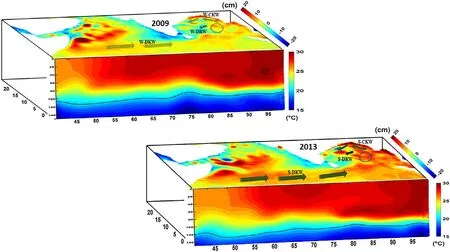
Fig. 7. Schematic diagram representing propagation of downwelling Kelvin waves (DKW), downwelling coastal Kelvin waves (CKW) and downwelling Rossby waves (DRW) over the seasonal average SSHA (cm) for the 2009 and 2013 ISM. W-meant for weak waves and S-meant for strong waves. Seasonal average near equatorial ( ±2 °N/S) ocean vertical temperature structure are also shown, black line represents the 20 °C isotherm line.

Fig. 8. OLR (Wm -2 ) composites over the regions (2 °× 2 °) of anticyclonic (ACE) and cyclonic eddies (CE) during contrasting monsoon seasons. Black circle represents the mean radius (R) of the corresponding eddies.
An OLR composite map of corresponding cyclonic and anticyclonic eddies over the BoB during the monsoon seasons of 2009 and 2013 is shown in Fig. 8 . During the 2009 monsoon season higher (lower) OLR values are evident over the regions of anticyclonic (cyclonic) eddies, converse features are evident during the 2013 monsoon season. Occurrences of the anticyclonic eddies during the 2013 (2009)monsoon season are observed over the regions of enhanced(suppressed) convection in the BoB. Fig. 9 shows composite lagged correlations between the SSHA and OLR over the regions of anticyclonic and cyclonic eddies with lag ±10 days. For anticyclonic (cyclonic) eddies negative (positive)correlations of SSHA and OLR signify enhanced (suppressed)atmospheric convection. Results demonstrate that over the anticyclonic eddy regions, SSHA leads the OLR by four days during 2009 and 2013 monsoon seasons. During 2009,cyclonic eddies do not provide any relationship with atmospheric convection, whereas during 2013, regions of cyclonic eddies are associated with suppressed convection with no lag.Figure S2 shows the composite cross-correlation analysis of SSHA and OLR at non-eddy locations. Results demonstrate that there is no significant relationship and differences found between the positive SSHA (P-SSHA) and negative SSHA(N-SSHA) with OLR. Both positive and negative SSHA regions in non-eddy locations indicate weak convection during the contrasting monsoon years. The rainfall composite maps of both cyclonic and anticyclonic eddies during the monsoon seasons of 2009 and 2013 is shown in Fig. 10 . Results signify that during the 2013 ISM, over the regions of anticyclonic eddies are centered with high rainfall intensity ( > 7 mm day-1), whereas over the regions of cyclonic eddies low( < 5 mm day-1) rainfall values are evident. During 2009 no significant differences of rainfall intensities are evident over the cyclonic and anticyclonic eddies, but relatively higher values are seen over the anticyclonic regions. Therefore, we suggest that the findings from the present study could provide valuable insight for delineating good and bad monsoon years,based on the variability of sea level anomalies and mesoscale eddies.
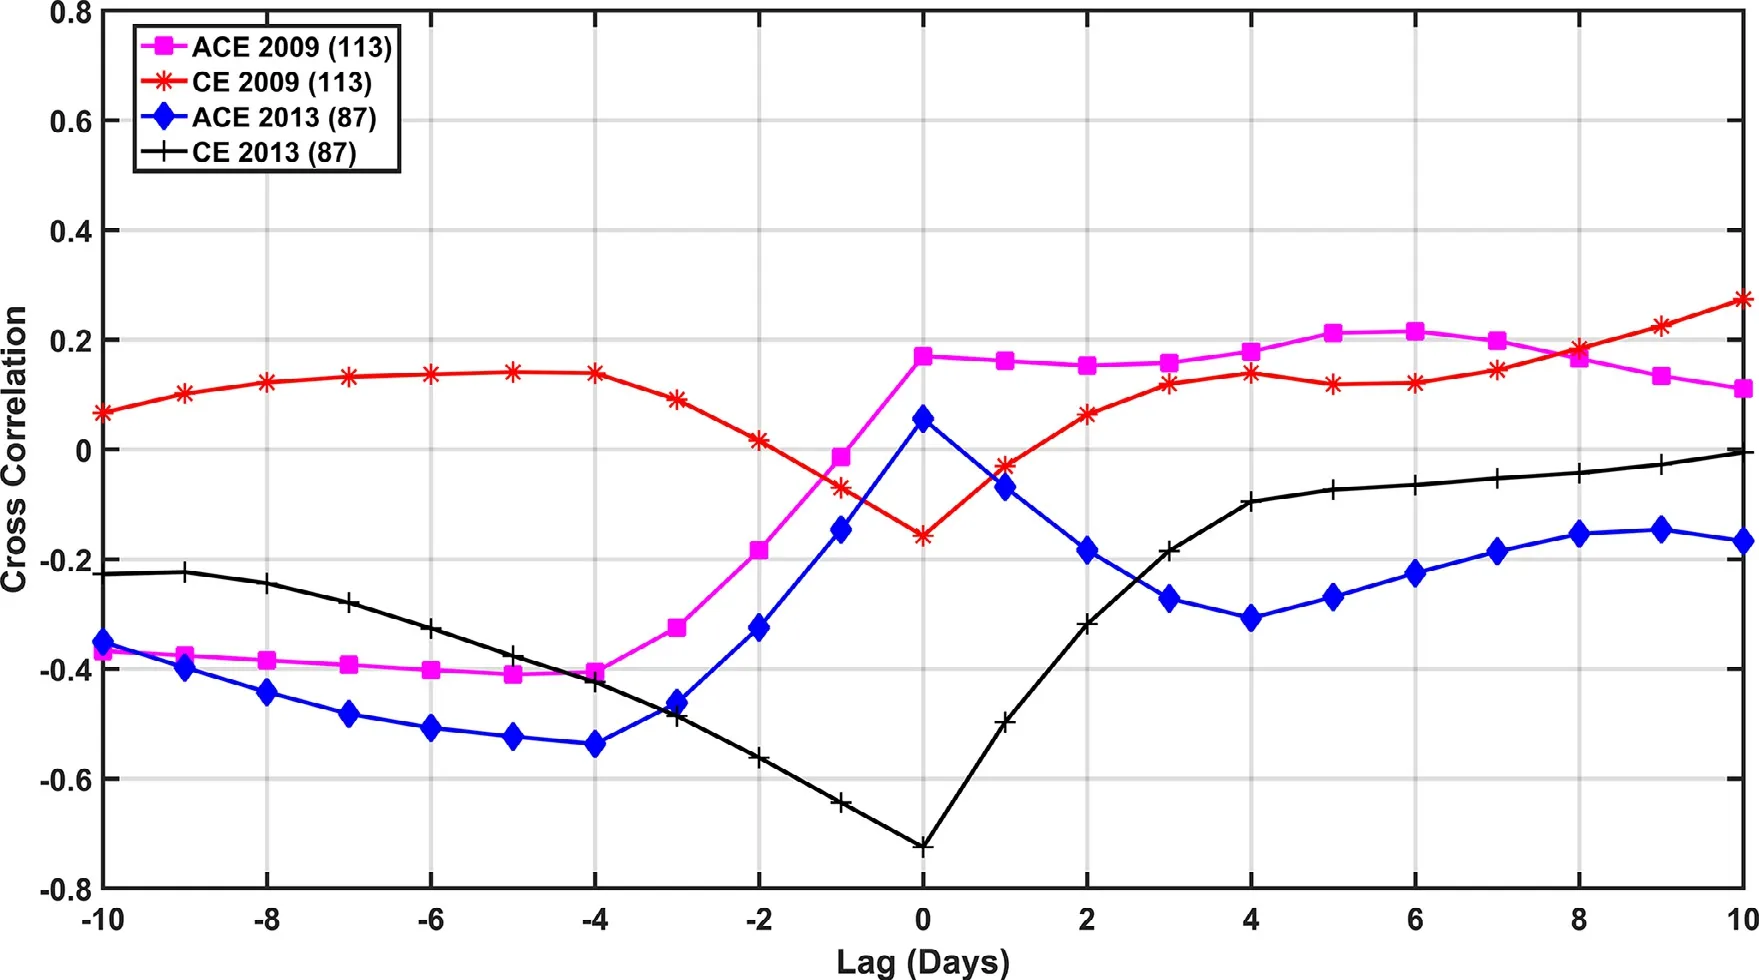
Fig. 9. Composite lag-correlations between the SSHA and OLR over the regions of anticyclonic and cyclonic eddies during the summer monsoon of 2009 and 2013, numbers in brackets represents data samples.
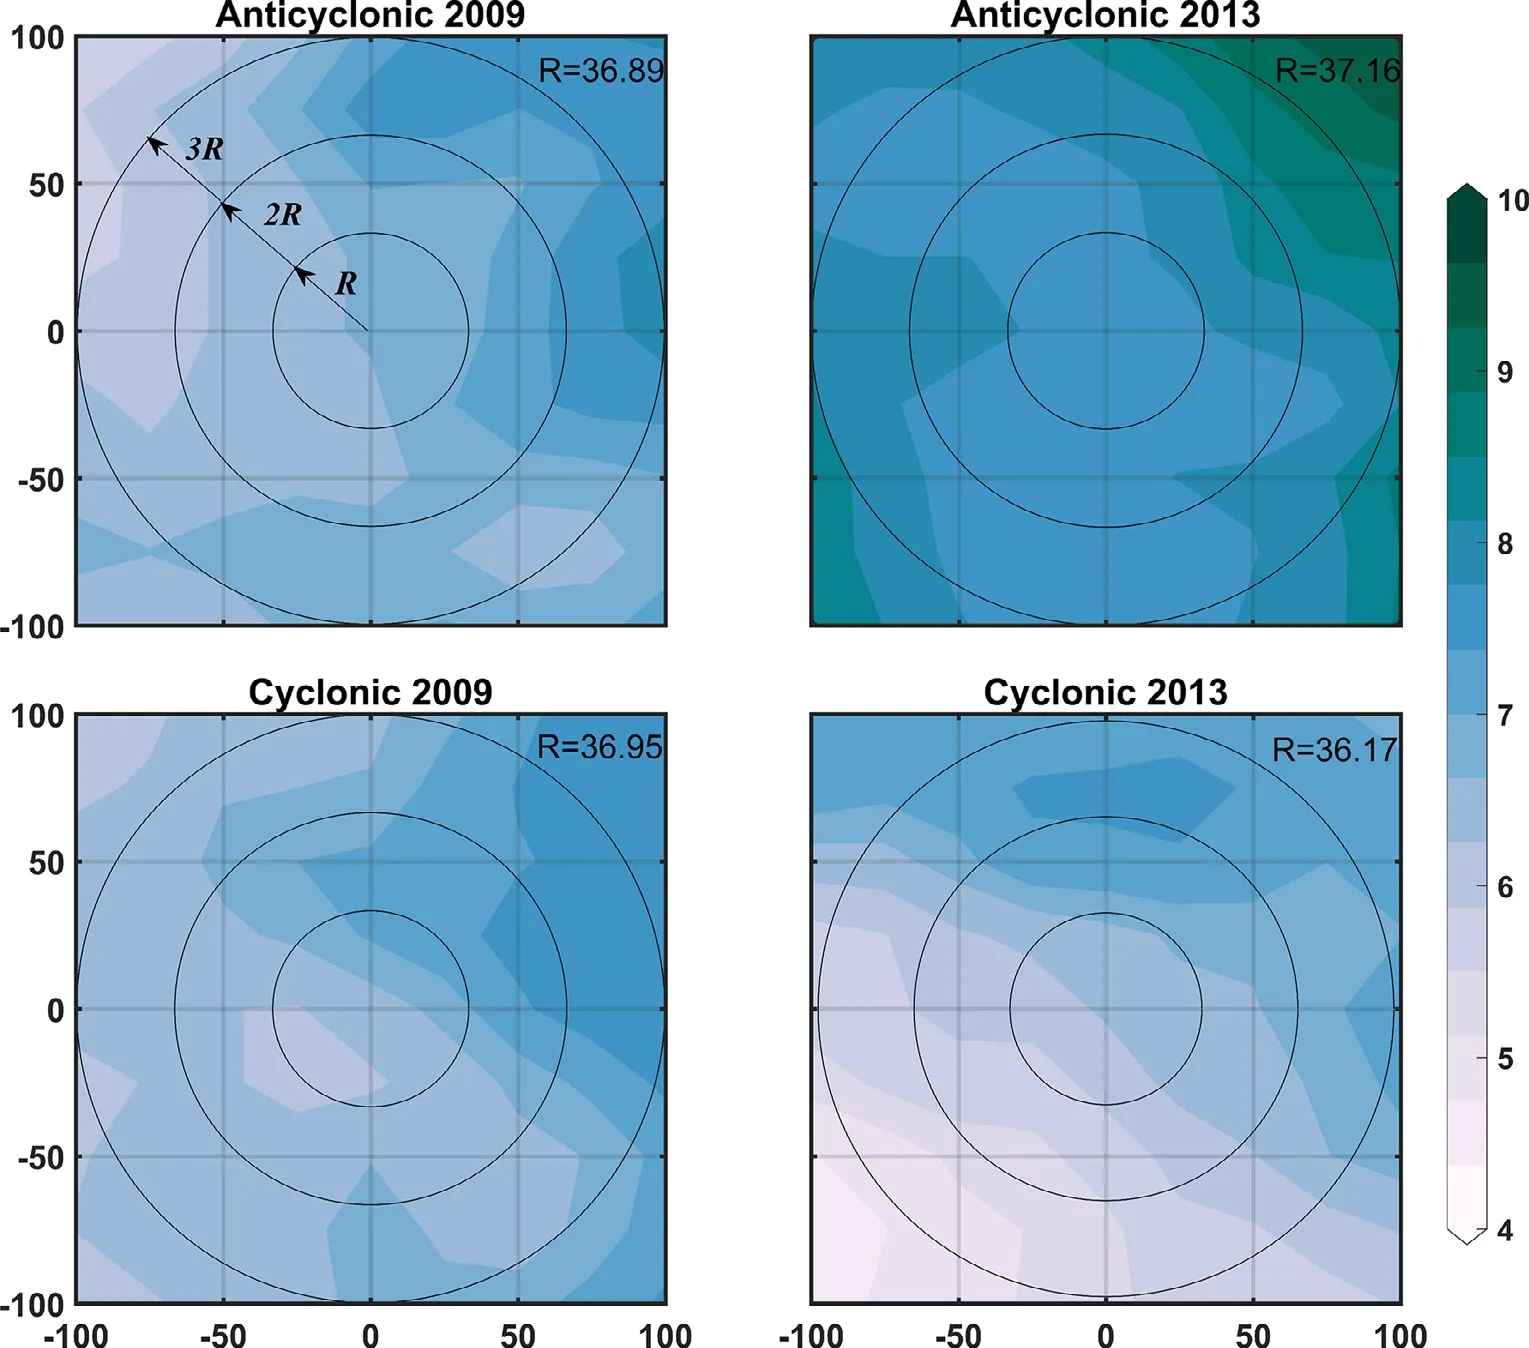
Fig. 10. Composites of rainfall over the regions (2 °× 2 °) of anticyclonic (ACE) and cyclonic eddies (CE) during contrasting monsoon seasons. Black circle represents the mean radius (R) of the corresponding eddies.
5.Conclusions
A thorough investigation of the characteristics of oceanic mesoscale eddies is crucial to better understand internal ocean dynamics [42] . In this context, an attempt has been made in the present study to examine the variability of mesoscale eddies during contrasting monsoon seasons. The contrasting ISM seasons of 2009 and 2013 were chosen for the present study.
Daily multi-mission altimeter satellite gridded daily product was used to detect oceanic mesoscale eddies in the BoB by employing the OW physical method. Significant differences in the variability of oceanic mesoscale eddies are evident during the contrasting monsoon seasons. During 2013(2009) anticyclonic eddies are prominent (absent) in the eastern BoB. In the western and northern BoB, a large band of negative SSHA and cyclonic eddies was evident during the 2009, whereas the lifespans of cyclonic eddies were longer during 2013 in the northern BoB. A pair of cyclonic and anticyclonic eddies was evident in the western BoB during both summer monsoon seasons, varying in intensity and position. Findings from the present study agree with reportedinsituobservations in the northern and western BoB [24,27,38] .The role of remotely forced planetary-scale waves on the variability of mesoscale eddies was examined with the help of longitude-time SSHA and zonal wind patterns. Equatorial eastward propagating downwelling Kelvin waves, northward moving coastal downwelling Kelvin waves and downwelling Rossby waves in the BoB appear to be crucial in modulating mesoscale eddies during the contrasting monsoon seasons.In the equatorial Indian Ocean strong (weak) downwelling Kelvin waves are prevalent during the monsoon season of 2013 (2009). The presence of strong (weak) downwelling coastal Kelvin and Rossby waves in the BoB are crucial in delineating the variability of anticyclonic and cyclonic eddies[47] .
The presence of oceanic mesoscale eddies could affect the atmospheric convection over the region [16,54] . During contrasting monsoon seasons in regions of cyclonic and anticyclonic eddies, variability of OLR has been examined.During an active monsoon season, over regions of anticyclonic (cyclonic) eddies deep atmospheric convection (shallow convection) is observed, whereas no significant relationship is established during weak monsoon seasons. Findings from the present study suggest that the variability of mesoscale eddies during the summer monsoon season can be used to delineate active and weak monsoon seasons; this hypothesis needs to be verified by examining a greater number of cases. Existing atmosphere and ocean-coupled models poorly represent air-sea flux exchanges at mesoscale levels [19,36] .The accuracy level in monsoon prediction climate models could be improved by considering eddy-resolving features.
Acknowledgments
Naresh Krishna Vissa would like to acknowledge the Ministry of Earth Sciences, Government of India for providing research grant (MoES/36/OOIS/Extra/46/2016). We are thankful to the anonymous reviewers for their thoughtful and constructive suggestions.
Supplementary materials
Supplementary material associated with this article can be found, in the online version, at doi: 10.1016/j.joes.2018.11.002.
 Journal of Ocean Engineering and Science2018年4期
- Journal of Ocean Engineering and Science的其它文章
- Development of current-induced scour beneath elevated subsea pipelines
- Optimization approach for a climbing robot with target tracking in WSNs
- The effect of gravity and inclined load in micropolar thermoelastic medium possessing cubic symmetry under G-N theory
- New analytic solutions of the space-time fractional Broer-Kaup and approximate long water wave equations
- Efficient numerical scheme based on the method of lines for the shallow water equations
- Comparing the force due to the Lennard-Jones potential and the Coulomb force in the SPH Method