
Beneficial effects of losartan or telmisartan on the local hepatic renin-angiotensin system to counter obesity in an experimental model
2019-05-17 02:29FrancielleGrausNunesFelipedeOliveiraSantosThatianydeSouzaMarinhoCarollineSantosMirandaSandraBarbosadaSilvaVanessaSouzaMello
World Journal of Hepatology 2019年4期
Francielle Graus-Nunes, Felipe de Oliveira Santos, Thatiany de Souza Marinho, Carolline Santos Miranda,Sandra Barbosa-da-Silva, Vanessa Souza-Mello
Abstract
Key words: Liver; Telmisartan; Losartan; Obesity; Angiotensin II type 1 receptor;C57BL/6 mouse
INTRODUCTION
The most prevalent liver disease in the world, non-alcoholic fatty liver disease(NAFLD), affects 20 to 30% of the adult population and has a significant association with obesity, insulin resistance, dyslipidemia and hypertension[1]. Considered to be a hepatic manifestation of metabolic syndrome, NAFLD is comprised of histological changes ranging from isolated steatosis to non-alcoholic steatohepatitis (NASH)characterized by steatosis, ballooning, and inflammation of hepatocytes with or without fibrosis[2].
The renin-angiotensin system (RAS) is an important physiological regulator of blood pressure, electrolyte balance, and fluid homeostasis. angiotensin II (ANGII) is the major effector of the cascade and is related to organ dysfunction and chronic tissue damage through its profibrotic effects[3]. Almost all of the standard RAS components are expressed in the liver, and local RAS activation has been associated with liver lesion pathophysiology[4]. Based on elevated levels of several RAS components during the progression of hepatic fibrosis, the role of RAS in hepatic fibrosis has been attributed to the classical RAS axis [angiotensin-converting enzyme(ACE) 1/ANGII/ ANGII type 1 receptor (AT1r)][5,6].
The RAS has been a frequent target for pharmacological intervention regarding systemic arterial hypertension, but the use of these drugs may also contribute to minimizing organ damage such as in the pancreas and the liver[7,8]. Therefore,attenuating the effects of ANGII by ANGII receptor blockers (ARBs, losartan or telmisartan) could be beneficial for NASH and other components of metabolic syndrome. The present study aimed to evaluate the role of two ARBs (losartan or telmisartan) in modulating the local hepatic RAS and the resulting metabolic effects in a diet-induced obesity murine model.
MATERIALS AND METHODS
Ethical approval
The experimental protocol and all procedures were carried out in accordance with the guide for the care and use of laboratory animals from the National Institute of Health(NIH, publication number 85-23, revised in 1996) and approved by the Ethical Committee in animal experimentation from the State University of Rio de Janeiro(CEUA/013/2015).
Animals, diets and treatment
Male C57BL/6 mice (n= 20) were group housed in pathogen-free cages under controlled conditions (temperature 20°C ± 2°C, humidity 60% ± 10%, 12/12 h light/dark cycle) and with free access to food and water.
At 3-mo-old, mice were randomly divided into two nutritional groups to be fed for 10 wk: control group (C,n= 5), who received a purif ied control diet (76% of total energy as carbohydrate, 14% of total energy as protein and 10% of total energy as lipids, total energy 15 kJ/g), and high-fat group (HF,n= 15), who received a purif ied diet rich in saturated fatty acids from lard (36% of total energy as carbohydrate, 14%of total energy as protein and 50% of total energy as lipids, total energy 21 kJ/g).Then, the animals fed HF chow were randomly allocated into three groups, and each group received one of the following treatments over 5 wk (the drugs were mixed into the diets, as follows): (1) HF group (n= 5), untreated; (2) HFL group (n= 5), HF diet treated with losartan (L, 10 mg/kg/d, Cozaar, Merck); (3) HFT group (n= 5), HF diet treated with telmisartan (T, 10 mg/kg·d, Micardis; Boehringer, Ingelheim). Sample size was established according to a minimum that could be conclusive with aP< 0.05,as previously reported[9]. The diets were produced by the PragSolucoes company (Jau,São Paulo, Brazil) based on the recommendations of the American Institute of Nutrition (AIN-93M)[10]. The drugs were mixed with the diet in order to minimize differences in the daily dose intake by each animal.
Energy intake was measured as the product of food consumption by the energy content of the diet (in kJ/g). The body mass (BM) of the animals was measured weekly.
Systolic blood pressure
Before the official evaluations, animals were trained for 4 wk in constraint conditions to minimize their stress. Systolic blood pressure (SBP) was monitored weekly by tailcuff plethysmography in conscious mice (Letica LE 5100, Harvard/Panlab, Barcelona,Spain).
Sacrif ice and tissue extraction
At the conclusion of the experiment, the animals were deprived of food for six hours and were deeply anesthetized (sodium pentobarbital 150 mg/kg). Blood was collected by cardiac puncture. Plasma was separated by centrifugation (400 G for 20 min) at room temperature and stored at -20°C or -80°C until analysis. The liver was weighed and sliced into several fragments and frozen at -80°C for molecular studies.
Biochemical analysis
Blood glucose was measured using a glucometer (Accu-Chek, Roche, Sao Paulo, SP,Brazil) after the six-hour fast period before sacrifice. The concentration of insulin was analyzed using a kit (Rat/Mouse Insulin ELISA kit Cat # EZRMI-13 K, Millipore,Missouri, United States) and a TP-READER Thermoplate (Bio Tek Instruments, Inc Highland Park, United States). The ratio of insulin and glucose was calculated to evaluate insulin resistance.
The hepatic cholesterol and triacylglycerol levels were measured in hepatic tissue by routine protocols described previously[11]. Briefly, frozen samples (50 mg) were placed in an ultrasonic processor with 1 ml isopropanol, and the homogenate was centrifuged at 2000 G. The supernatant (5 μL) was analyzed using a kit for measuring triacylglycerol or cholesterol (automatic analyzer K55, Bioclin System II; Quibasa, Belo Horizonte, MG, Brazil). Alanine aminotransferase (ALT) was measured in the plasma using a kinetic colorimetric method (Bioclin System II; Quibasa, Belo Horizonte, MG,Brazil).
Immunofluorescence
Fixed tissue fragments were embedded in Paraplast Plus (Sigma-Aldrich Co., St.Louis, MO, United States) and sectioned at a thickness of 5 micrometers.
Liver sections (deparaffinized and hydrated) underwent antigen retrieval using citrate buffer at pH 6.0, and were blocked in 2% glycine and 5% BSA in PBS. Sections were incubated with anti-AT1R (anti-rabbit, AB15552, 1:100, Millipore) or anti-PLIN 2(anti-rabbit, CSB-PA920084, 1:100, Millipore), in 1% BSA in PBS for 2 h.
Subsequently, samples were treated with a secondary antibody conjugated to Alexa 488 fluorophore (anti-rabbit IgG-Alexa 488, for AT1R and PLIN 2, 1:100), and slides were mounted with SlowFade (Invitrogen, Molecular Probes, Carlsbad, CA, United States). Digital images were captured using a confocal laser scanning microscope(Nikon C2; Nikon Instruments Inc., Tokyo, Japan).
Quantitative real-time PCR
Quantitative real-time PCR (RT-qPCR) was performed to examine RAS-related mRNA levels in the livers of mice. Total liver RNA was extracted using Trizol(Invitrogen, CA, United States). The RNA concentration was determined by spectroscopy using the Nanovue (GE Life Sciences) equipment using 1 μg RNA and DNAse I (Invitrogen). The cDNA was synthesized using Oligo (dT) primers and Superscript III transcriptase-reverse (Invitrogen, CA, United States). Real-time PCR was performed using the Biorad CFX96 thermal cycler and SYBR Green mix(Invitrogen, CA, United States). The primers were designed using Primer 3web online software version 4.0. The beta-actin gene was used as an endogenous control to normalize target gene expression. The primer eff iciency of the target genes and the control gene were approximately equal, as calculated by using serial dilutions of cDNA. PCR reactions were performed following a program of denaturation and activation of the polymerase (4 min at 95°C), with 44 cycles, each consisting of 95°C for 10 s and 60°C for 15 s, followed by a melting curve (60-95°C, with a heating rate of 0.1 °C/s). Negative controls consisted of wells in which cDNA was replaced by deionized water. The relative expression ratio of mRNA was calculated by the 2ΔΔCt method. Sense and antisense primers sequences are described in Table 1.
Statistical analysis
After conf irming normality and homoscedasticity of variances, data were displayed as the mean and standard deviation. Comparisons among groups were tested by at-test or one-way ANOVA followed by Holm-Sidak post-hoc test when indicated. In all cases,P< 0.05 was considered statistically signif icant (GraphPad Prism version 7.04 for Windows, GraphPad Software, La Jolla, CA, United States).
RESULTS
Food intake and body mass
All animals tolerated the diet well and did not show any sign of disease during the experiment. All animals were included in the analysis (n= 5 per group).
Food intake was evaluated and showed no difference between the HF group and the C group, or between the HFL and the HF group. The HFL group did not demonstrate any differences in dietary energy intake compared to the HF group.However, the HFT group had lower energy intake compared to the HF group (-21%,P= 0.0010) and the HFL group (-22%,P= 0.0008). These results are detailed in Table 2.
At the 10th week, after the induction of obesity, the HF group was heavier than the C group (+28%,P< 0.0001). At the end of the treatment, at the 15th week, the HFT group had a significant reduction in BM compared to the HF group (-23%,P< 0.0001)and HFL group (-17%,P< 0.0001). Losartan treatment reduced BM compared to the HF group (-9%,P< 0.0001). Figure 1A depicts these findings.
Systolic blood pressure
The HF group had an 18% increase in SBP values compared to the C group (+15%,P<0.0001). Both treated groups showed a marked reduction in SBP values compared to the untreated HF group (-14%,P< 0.0001 for both HFL and HFT, Figure 1B). There was no difference between the HFL and the HFT groups regarding SBP values.
Fasting glucose levels and I/G ratio
We did not observe a difference in fasting glucose between the HF-L and HF groups.Nevertheless, the HF-T group showed significantly reduced fasting glucose levels compared to the HF group (-9%,P= 0.0210, Table 2).
Insulin resistance was detected in the HF group due to a higher I/G than the C group (+69%,P= 0.0079, Table 2). Both treatments significantly decreased the I/G ratio compared to the HF group (-30%,P= 0.0181, HFL; -33%,P= 0.0181, HFT, Table 2), with levels similar to the C group.
Hepatic parameters
The HF group showed higher hepatic cholesterol (+9%,P< 0.0001) and triacylglycerol levels (+127%,P= 0.0004) than the C group. Only telmisartan treatment significantlyreduced hepatic cholesterol levels compared to the HF group (-3%,P= 0.0271).Conversely, hepatic triglyceride levels were decreased by both treatments compared to the HF group (-28%,P= 0.0381 for HFL; and -45%,P= 0.0010 for HFT).

Table 1 Forward and reverse sequences of RT-qPCR primers
ALT enzyme concentrations were markedly enhanced by the HF diet compared to the C group (+56%,P< 0.0001). The treatments were effective in reducing ALT levels compared to the HF group (-14%,P= 0.0082 for HFL and - 15%,P= 0.0064 for HFT).The effects of losartan or telmisartan treatment on ALT concentrations were not statistically different. These results are detailed in Table 2.
Immunofluorescence
Immunofluorescence for AT1r revealed a negative reaction for both treatment groups(losartan and telmisartan), thus confirming the blockade of AT1r by both drugs and validating our study design. In contrast, the HF group showed widespread positive immunostaining for AT1r, consistent with over-activation of the classic local RAS axis in the liver of obese animals (Figure 2, upper panel).
The benef icial effects of both treatments on weight management and insulin sensitivity might be, at least in part, mediated by decreased expression of PLIN 2 on lipid droplet surface membranes. Both HFL and HFT groups showed weaker PLIN 2 expression than the HF group, which showed more intense immunostaining. Figure 2(lower panel) depicts these findings.
RT-qPCR
Renin gene expression was reduced in the HF group compared to the C group (-84%,P< 0.0001). Neither treatment significantly changed renin gene expression, which remained lower than the C group (-82.30%,P< 0.0001 for HFL and -79.93%,P< 0.0001 for HFT). These results are detailed in Figure 3A.
ACE1 gene expression was markedly increased by the HF diet, as the HF group showed higher ACE1 gene levels than the C group (+569.02%,P< 0.0001). On the contrary, both treatments restored ACE1 gene expression to levels lower than the HF group (-94.97%,P< 0.0001 for HFL and -81.65%,P< 0.0001 for HFT) and similar to the C group. These results are depicted in Figure 3B.
The HF group also showed higher AT1r gene expression than the C group(+141.40%,P< 0.0001). Conversely, both treatments restored AT1r gene expression to values lower than the HF group (-78.95%,P< 0.0001 for HFL and -82.54%,P< 0.0001 for HFT). These results are found in Figure 3C.
In contrast to the AT1r results, the losartan and telmisartan treatments enhanced AT2r gene expression compared to the HF group (+320.70%, P<0.0001 for HFL and+354.11% for HFT). These results are detailed in Figure 3D.
ACE2 gene expression was reduced in the HF group in comparison to the C group(-75.69%,P= 0.004). Both losartan and telmisartan significantly enhanced ACE2 gene expression (+465.57%,P= 0.0002 for HFL and +345.17%,P= 0.0049 for HFT). These results are depicted in Figure 4A.
In agreement with ACE2 gene expression, the HF group showed lower rMAS gene expression than the C group (-51.37%,P= 0.041). Notably, both treatments enhanced rMAS gene expression compared to the HF group (+711.39%,P< 0.0001 for HFL and+539.75%,P< 0.0001 for HFT). These results are shown in Figure 4B.

Table 2 Food behavior, carbohydrate metabolism and hepatic parameters
DISCUSSION
The present results confirm that diet-induced obesity induces overexpression of ACE1-AT1r genes in the liver of mice, whereas both losartan and telmisartan restored local ACE1-AT1r gene expression to values similar to the lean animals. Moreover, the beneficial effects from both ARBs on insulin resistance, body mass, SBP, hepatic cholesterol, and triacylglycerol levels might stem from the stimulation of the ACE2-rMAS axis, whose components showed increased hepatic gene expression after selective AT1r blockade.
Telmisartan treatment has been linked to decreased energy intake and reduced body mass gain despite the maintenance of a HF diet during the experimental protocol. Some mechanistic explanations rely on the activation of PPARdeltadependent lipolytic pathways and activation of the local RAS in the brain, reducing energy intake and increasing energy expenditure[12,13].
The reduced energy intake might raise some doubts regarding the real contribution of telmisartan to the observed body mass loss. However, a previous study revealed that the reduced energy intake in the absence of treatment (pair-feeding group) did not produce a significant reduction in body mass. Hence, the noticeable body mass loss can be attributed to telmisartan action once the pair-feeding group remained overweight[7]. On the other hand, recent reports stated that losartan treatment does not influence food intake[12,14]. In agreement with these observations, losartan treatment did not change energy intake herein, though it elicited a slight reduction in body mass.
Both losartan and telmisartan were effective in reducing SBP values, even with a chronic HF diet intake, as previously shown[14,15]. A recent human study reported equal efficacy of both losartan and telmisartan on blood pressure control.Nevertheless, telmisartan shows more favorable effects on lipid profiles, implying an additive beneficial effect in patients[16].
It is worth mentioning that the reduction of fasting glycemia was only observed following telmisartan treatment, but both treatments affected insulin resistance,suggesting that the normalization of insulin sensitivity is independent of the effects of PPAR-gamma activation and relies more on AT1r blockade[17]. This is consistent with our previous findings in the pancreas, where relief in hyperinsulinemia stemmed from adequate glucose-stimulated insulin secretion by pancreatic islets as a result of the selective AT1r blockade[7].
Favorable effects of telmisartan on metabolism have been related to its dual property as an ARB and partial PPAR-gamma agonist[18]. In the liver, combined partial PPAR-gamma and PPAR-alpha activation play a pivotal role in regulating carbohydrate and lipid metabolism through the transcription of their target genes,with marked effects on lipotoxicity and insulin resistance control[8,19,20]. Hence, the normalization of hepatic triacylglycerol levels due to telmisartan is consistent with the augmented insulin sensitivity and better glycemic control, implying a favored hepatic beta-oxidation over lipogenesis[21].

Figure 1 Body mass (A) and systolic blood pressure (B) pre-treatment (10th week) and end of treatment (15th week). Data are the mean ± SD, n = 5 for each group. Differences between the groups were tested with one-way ANOVA and Holm-Sidak post hoc test (P < 0.05) compared to the C group (a), HF group (c) and HFL group (e). C:Control group; HF: High-fat diet; HFL: HF diet treated with losartan; HFT: HF diet treated with telmisartan.
On the contrary, losartan treatment did not minimize the harmful effects of the HF diet upon fasting glycemia and hepatic cholesterol levels, besides the less noticeable impact on hepatic triacylglycerol levels than telmisartan. In agreement with our observations, a recent study using a high fat-high sucrose diet showed that losartan did not significantly change the glucose levels nor influence total cholesterol levels[22].Increased hepatic cholesterol levels imply that the liver is more susceptible to harmful forms of liver disease because it correlates with hepatic inflammation and impaired transcriptional response[23].
In obesity, there is an interaction between hepatic cholesterol metabolism and intrahepatic RAS activation[24]. HF animals showed hepatic overexpression of ACE1/AT1r and reduced expression of ACE2/MASr parallel to enhanced hepatic cholesterol levels. Intrahepatic RAS overexpression triggers extracellular matrix synthesis and impairs LDL receptor function, leading to adverse liver remodeling[25].These events are mediated by AT1r activation by ANGII and predispose the subject to adverse hepatic remodeling and hepatic steatosis[26].
Conversely, HF animals treated with losartan or telmisartan benefited from AT1r blockade, as they favored the ACE2/MASr axis over the ACE1/AT1r axis, which has been previously associated with the amelioration of glucose intolerance, hepatic inflammation, and prevention of steatosis and fibrosis[8,15,20]. The RAS modulation by telmisartan can explain previous beneficial effects on the livers of an animal model of hepatic fibrosis[27]and in human with steatohepatitis[28], without side effects. Although the HF diet did not induce fibrosis, our results show that the AT1R blockade reduced PLIN 2 expression and hepatic triacylglycerol levels, both of which are strongly correlated with reduced hepatic steatosis[11,29].
Some tissues can store excessive lipids in cytoplasmic lipid droplets, which are dynamic organelle-like structures[29]. PLIN 2 is a cytoplasmic lipid droplet-associated protein, and mice lacking PLIN 2 are resistant to obesity-associated fatty liver disease,as its deficiency is linked to increased PPAR-alpha activation and subsequent increases in beta-oxidation[30]; suppressed SREBP-1 and SREBP-2 and the resulting suppression ofde novolipogenesis and hepatic cholesterol biosynthesis[30]; and enhanced hepatic FGF21 expression and the browning of white adipose tissue with metabolic improvements[31].

Figure 2 Angiotensin type-1 receptor (A) and PLIN 2 (B) assessed by immunofluorescence (green) in the liver. Scale bars correspond to 50 µm, same magnification for all immunoreactions (40 x). C: Control group; HF: High-fat diet; HFL: HF diet treated with losartan; HFT: HF diet treated with telmisartan.
In conclusion, we propose that the modulation of intrahepatic RAS, with a preference for the ACE2/rMAS axis over the ACE1/AT1 axis after losartan or telmisartan treatments, cause beneficial hepatic and metabolic effects, as demonstrated by reduced hepatic triacylglycerol levels coupled with reduced PLIN 2 expression and improved glycemic control. Additional beneficial effects of telmisartan were perceived in hepatic cholesterol levels and normalization of fasting glycemia.Both drugs, which are frequently used as anti-hypertensive agents, can be a useful option for obese patients to control IR and NAFLD through AT1r blockade.

Figure 3 Local gene expression of components of the classical ACE1/AT1r axis in the liver: Renin (A), ACE1 (B), AT1r (C) and AT2r (B). B-Actin was used as an endogenous control to normalize the expression of the selected genes. Data are the means ± SD, n = 5 for each group. Differences between the groups were tested with one-way ANOVA and post hoc test of Holm-Sidak (P < 0.05) when compared with the C group (a) and HF group (c). ACE1: Angiotensin-converting enzyme 1; AT1r: Angiotensin type-1 receptor; AT2r: Angiotensin type-2 receptor; C: Control group; HF: High-fat diet; HFL: HF diet treated with losartan; HFT: HF diet treated with telmisartan.
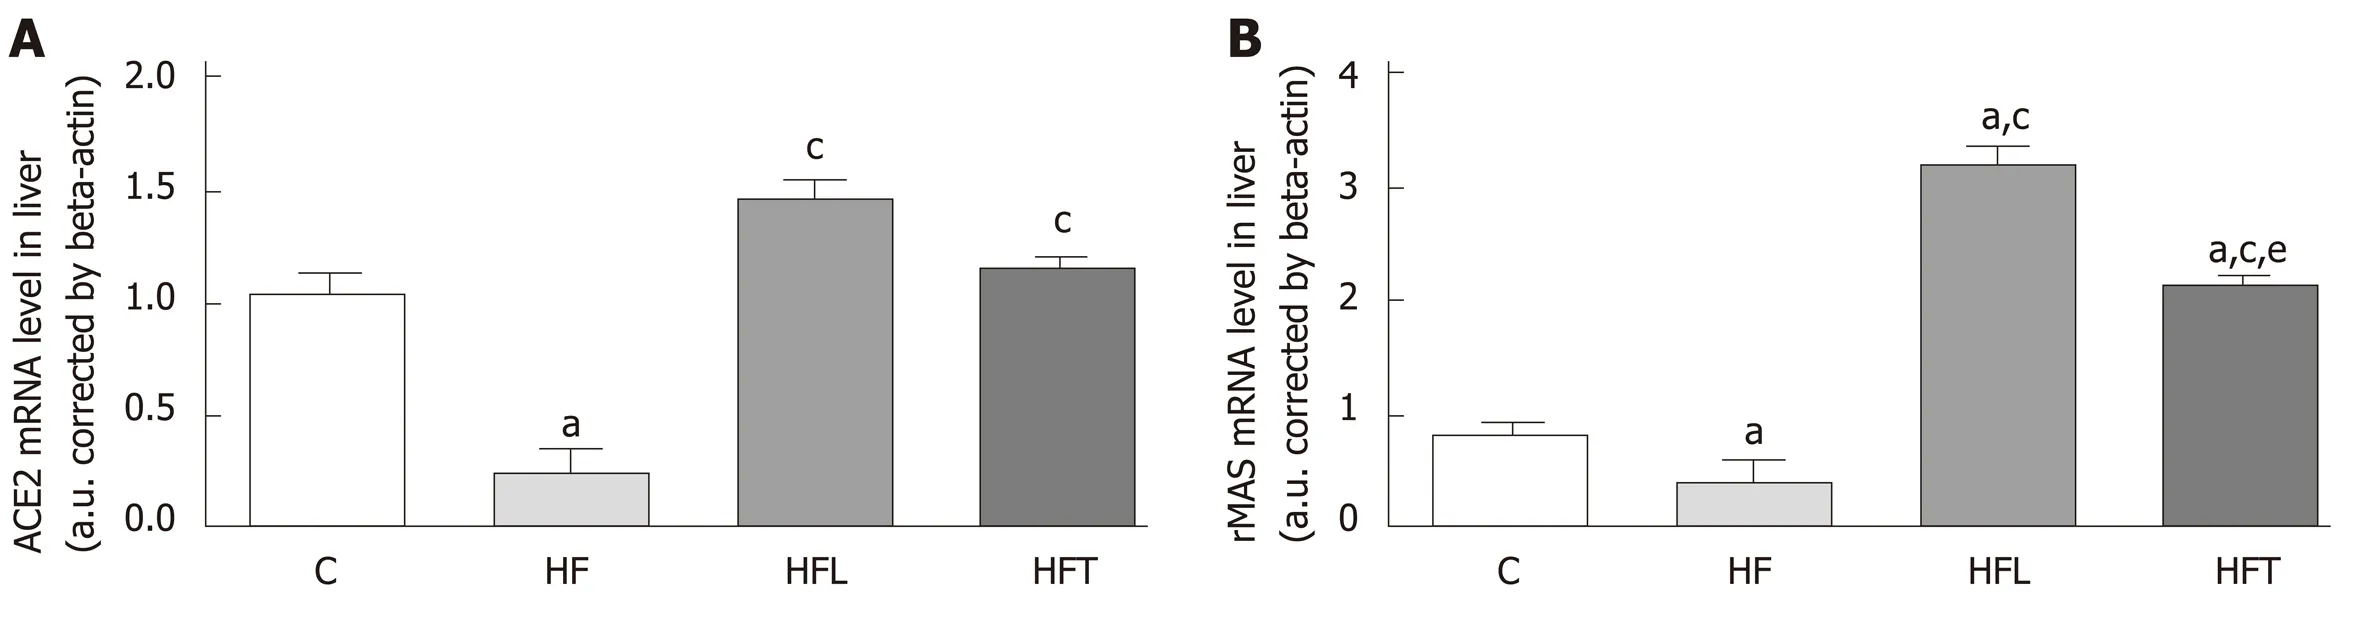
Figure 4 Local gene expression of the ACE2/MASr axis in the liver: ACE2 (A) and rMAS (B). B-Actin was used as an endogenous control to normalize the expression of the selected genes. Data are the means ± SD, n = 5 for each group. Differences between the groups were tested with one-way ANOVA and post hoc test of Holm-Sidak (P < 0.05) compared to the C group (a), HF group (c) and HFL group (e). ACE2: Angiotensin-converting enzyme 2; rMAS: MAS receptor; C:Control group; HF: High-fat diet; HFL: HF diet treated with losartan; HFT: HF diet treated with telmisartan.
ARTICLE HIGHLIGHTS
Research background
Drugs that target the renin-angiotensin system (RAS) could benefit the adverse hepatic remodeling and glycemic control in the diet-induced obese mouse.
Research motivation
Most obese subjects show insulin resistance and non-alcoholic fatty liver disease (often referred to as NAFLD), whose consequences lead to high healthcare costs. Currently, there is no established drug treatment for NAFLD.
Research objectives
To evaluate the action of losartan or telmisartan on the modulation of intrahepatic RAS and the resulting metabolic effects in a diet-induced obesity murine model.
Research methods
Twenty C57BL/6 mice were randomly divided into two nutritional groups for 10 wk and, then,into four groups for a 5-wk treatment: control group (C,n= 5), high-fat group (HF,n= 15), HF treated with losartan (HFL,n= 5, 10 mg/kg body mass) and HF treated with telmisartan (HFT,n= 5, 10 mg/kg body mass).
Research results
The HF group showed increased weight, glucose intolerance, high hepatic triacylglycerol, and overexpression of intrahepatic angiotensin-converting enzyme (ACE) 1/ angiotensin II (ANGII)type 1 receptor (AT1r). Losartan and telmisartan modulated the intrahepatic RAS, with preference for the ACE2/rMAS axis, resulting in ameliorated glucose intolerance and reduced hepatic triacylglycerol levels, both of which are related to diminished Plin2 expression in the liver. Only telmisartan could restore body mass, fasting glucose levels, and hepatic cholesterol levels, implying additional benefits.
Research conclusions
The modulation of intrahepatic RAS, with preference for the ACE2/rMAS axis over the ACE1/AT1r axis after losartan or telmisartan treatments, caused hepatic and metabolic beneficial effects, as demonstrated by reduced hepatic triacylglycerol levels coupled with reduced PLIN 2 expression and improved glycemic control.
Research perspectives
The pharmacological modulation of intrahepatic RAS showed beneficial effects in terms of hepatic steatosis, evaluated by reduced hepatic triacylglycerol levels, in addition to its effects on decreased body mass and better glycemic control. These drugs could be a viable option to treat NAFLD in obese and/or hypertensive patients.
 World Journal of Hepatology2019年4期
- World Journal of Hepatology的其它文章
- Endoscopic ultrasound guided liver biopsy for parenchymal liver disease
- MicroRNAs contribute to ATP-binding cassette transporter- and autophagy-mediated chemoresistance in hepatocellular carcinoma
- Being accompanied to liver discharge clinic: An easy measure to identify potential liver transplant candidates among those previously considered ineligible
- Effectiveness of venous thromboembolism prophylaxis in patients with liver disease
- Nonalcoholic fatty liver disease prevalence in an Italian cohort of patients with hidradenitis suppurativa: A multi-center retrospective analysis
- Leukocytoclastic vasculitis caused by hepatitis C virus in a liver transplant recipient: A case report