
Staged Premium Screen Completion Design for Horizontal Well Based on Laboratory Test: A Successful Application in Block 451, Shengli Oil Field
2019-08-05 09:23CHENYangWANGShaoxianCHENZongyiYANGHaiboZHANGJianguo
CHEN Yang; WANG Shaoxian; CHEN Zongyi; YANG Haibo; ZHANG Jianguo
[a]Drilling Technology Research Institute, Shengli Petroleum Engineering Corporation Limited, SINOPEC, Dongying, China.
[b] Research Institute of Petroleum Engineering Technology, Shengli Oilfield Company, Dongying, China.
Abstract Staged premium screen has been applied to balance the inflow profile of horizontal well under open hole completion in Shengli Oil Field, China. Perforation density of base pipe is the key parameter of staged screen for inflow control, however, it is used to be determined by only considering drawdown due to perforation itself,ignoring two dominant parts caused by formation sand filter cake around screen and sand retention material,therefore the decision plan is not suitable. To solve this problem, a laboratory apparatus was run to test a screen sample, and thoroughly analyzed the effect of perforation density on total inflow control drawdown. A base pipe was also tested, working as a reference to screen sample.The test simulated down hole flowing condition in Well DXY451P21, Block 451, Shengli Oil Field, test results were directly utilized to design staged premium screen for this target well. Finally, the following conclusions can be drawn: pressure drop in screen sample is much sensitive to perforation density, and is obviously larger than that in base pipe sample; flowing pressure is mainly lost in formation sand filter cake and sand retention material,where the flow pattern is seepage flow; perforations on base pipe of premium screen mainly play a part in regulating flowing field, i.e. smaller perforation density will lead produced liquid to flow a longer distance in seepage media and bring a larger additional drawdown;the production performance of Well DXY451P21 is much better than adjacent wells, and promotes economic benefits.
Key words: Perforation density; Staged premium screen; Inflow control; Laboratory test; Horizontal well
INTRODUCTION
Horizontal wells have been widely applied to develop the remaining oil in single layer in Shengli Oil Field, China,most of the blocks have stepped into middle-late stage of water flooding development, surrounded by active edge and bottom water. Formation water is easy to firstly break into a single point of horizontal production interval,owning to fluid frictional drawdown along well bore and heterogeneous formation, which will cause unbalanced inflow profile. And then horizontal well will suffer from rapidly increased water cut, high natural decline rate and poor economic benefits.
Youming Xiong et al. (Youming, Donghong, & Haixiong,2009) reported staged premium screen, working as a kind of inflow control completion method in open hole, was used to solve this problem, as shown in Figure 1.

Figure 1 Staged screen completed in open hole horizontal well
The base pipe of staged premium screen has smaller perforation density than standard value (160 holes per meter), and then flowing control drawdown can be introduced to inhibit the overlarge local inflow. Larger additional drawdown requirement corresponds to smaller perforation density, therefore, the base pipe perforation density in each production interval is different, and has a staged distribution along the whole completion string,from which the staged premium screen gets its name.Compared with other types of inflow control device (ICD)(Ouyang, 2009), e.g. Baker Hughes Spiral ICD, Halliburton EquiFlow ICD and Weatherford FloReg ICD, staged premium screen is hard to be plugged by fines and is more suitable for severe down hole working condition. So far,staged screen has been successively applied to Liuhua Oil Field in South China Sea (Youming, Liming, & Haixiong,2011), Honghe Oil Field (Dean, Qing, & Guofeng, 2013),PanYu Gas Field in South China Sea (Lin, Bin, & Jin,2016).
A reasonable staged premium screen design will balance the liquid inflow profile along well bore, delay water breakthrough time, and decrease water cut.However, it was used to be designed by considering that the inflow control drawdown is only caused by perforations of base pipe (Jinzhong, Guohua, & Lei, 2011;Xu, Yang, & Ma, 2011; Shan & Zhang, 2013), but ignoring those two parts due to formation sand filter cake around screen and sand retention material. Therefore, the planned base pipe perforation density was usually got to be too small to meet the required additional pressure drop of each interval, and brought an excessive throttling strength in reality.
To obtain proper decision, laboratory test method(Chanpura, et al, 2011; Chanpura, 2012; Lee, 2013; Procyk,2015; Yang, 2016) is utilized in this paper to simulate down hole flowing condition of horizontal wells in Block 451,Shengli Oil Field, all the parts of additional drawdown brought by screen completion under different perforation densities and liquid flow rates are monitored and recorded as test results. And then test results are plotted into data graphs and can be directly utilized to design staged premium screen for any target well in Block 451.
1. LABORATORY TEST
1.1 Test Apparatus Introduction
A test apparatus was run to simulate the real flowing condition and severe sanding process in horizontal well bore, as shown in Figure 2.

Figure 2 Test apparatus
The main body (component 11) works as a container for test, sample (component 2) to be tested will be installed in the center. Radial flowing guider (component 4) leads test liquid to radially flush artificial sand and flows through test sample. Flow rate can be automatically measured by flow meter (component 10) and adjusted to required value. The main body can be laid down around the rotating hollow shaft (component 14) to horizontal position to simulate the stream field in horizontal well bore, the red iron bar beside locking mechanism(component 9) working as a third supporting point of main body in horizontal state.
Differential manometer (component 13) measures the pressure differential between test sample outer surface and the inner. Flowing pressure in inlet pipe (component 3)can be gathered by pressure sensor (component 5), whose reading can be treated as the pressure on inner wall of main body by ignoring the pressure drop along inlet pipe and radial flowing guider. Pressure in outlet of main body is considered as atmospheric pressure, therefore pressure drop between sample inside and inner wall of main body is equal to the reading of component 5. Different types of pressure gauges are available to provide suitable measuring range and accuracy.
1.2 Test Samples

Figure 3 Test samples
There are two samples to be tested, as shown in Figure 3: Screen sample, installed in main body with synthetic sand fully and loosely filled in annular space between screen sample and main body; base pipe sample, installed without filled sands, is only a perforated base pipe without sand retention material around, and works as a reference of screen sample.

Figure 4Screws used to adjust perforation density
Base pipe sample and base pipe of screen sample have the same diameter and perforated length, and both are perforated with 160 holes per meter. In particular, all the holes are further processed with thread and should be fitted with screws illustrated in Figure 4. Screw Type A has a through-hole with diameter of 10 mm, while Type B doesn’t have. Different perforation density can be simulated by using certain numbers of Screws Type A and Type B. The inner diameter of samples is big enough to ensure every screw can be removed or set by putting in your arm.
1.3 Basic Parameter
Staged premium screen was going to be applied to Well DXY451P21, Oil Bed D2, Block 451, Shengli Oil Field.The geological map of target reservoir is shown in Figure 5.

Figure 5 Geological map of Block 451, Layer No. 2, sand group No. 2
Target layer inclines 8.5° to the south, it is a small graben block cut by faults of all sides. Remaining oil enriches near the northern boundary fault which seals the higher edge of target layer. Basic parameters of Block 451 are given in Table 1.

Table 1 Basic Parameters of Remaining Oil Zone in Block 451
The average viscosity of output liquid in Block 451 is decided to be 18.0 cP, on the basis of oil and water viscosity,and average water cut. Particle size distribution is obtained by gravimetric analysis on core samples from one of the representative wells in Block 451, as shown in Figure 6.

Figure 6 Particle size distribution of block 451
Well DXY451P21 was planed to drill 200m horizontal production interval to develop the remaining oil in Figure 5, and would be completed by staged premium screen with 5½ inch base pipe. The nominal opening size of sand retention material is decided to be 158 μm depending on Figure 6.
Fixed experimental parameters, as shown in Table 2, are provided based on the above basic parameters to simulate the real down hole working condition, and ensure the test results can be directly used to design staged screen completion for any target horizontal well in Block 451.Perforation density and test liquid flow rate are selected as two experimental variables which have been dispersed into several test levels, also shown in Table 2, and then effect of the two variables on total additional pressure drop introduced by screen pipe can be studied.
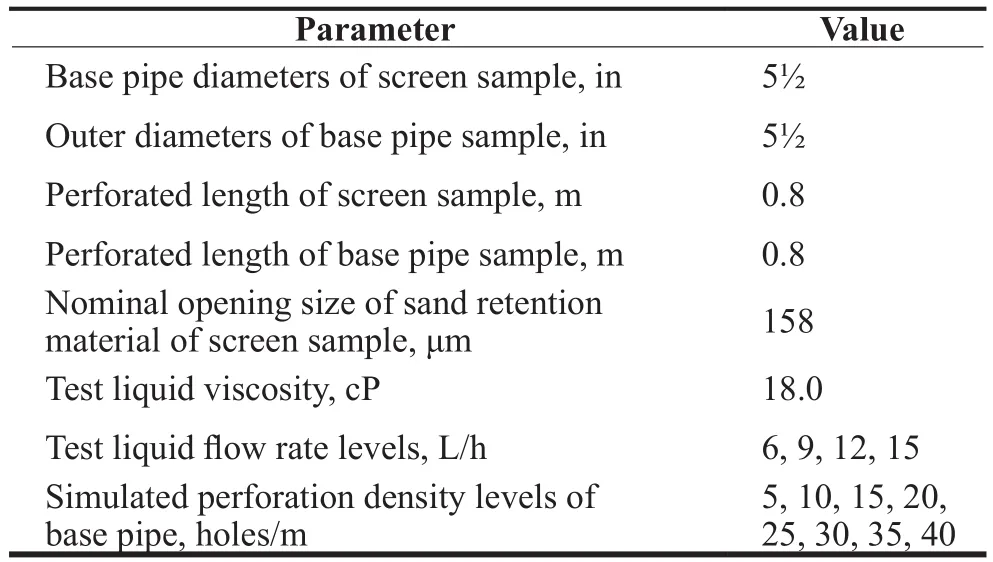
Table 2 Planned Basic Experimental Parameters
1.4 Test Procedure
For screen sample:
(1) Prepare synthetic sand with a particle size distribution similar to that in Figure 6;
(2) Prepare adequate CMC-Na (sodium carboxymethyl cellulose) solution with viscosity of 18.0 cP working as test fluid;
(3) Set all the holes of base pipe with Screws Type A, install screen sample in the center of main body, fill artificial sand;
(4) Flush screen sample at flow rate of 1200 L/h by a large discharge pump, 1200 L/h is a standard and commonly applied flush rate in laboratory sample test to make sure the artificial sand to migrate into a steady state as soon as possible: some of the sand accumulates outside the screen, another part is captured in pore of sand retention material, and the rest has passed through screen with test liquid. Stop the pump after readings of all the pressure gauges are stable;
(5) Set 96 number of Screws Type B on base pipe to replace Screws Type A to simulate the highest perforation level of 40 holes/m, flush sample with minimum test liquid flow rate level of 6 L/h by a small discharge pump,gather and save readings of all the pressure gauges when they have been stable for more than 5 minutes;
(6) Increase the flow rate to a higher level, repeat Step(5) with the same perforation level. A group of tests is finished after flushing all the flow rate levels;
(7) Set more Screws Type B to simulate the next smaller perforation level and repeat step (5) to (6), and finally finish all the test groups.
For base pipe sample:
(1) Clean the main body and install base pipe sample without filling sands;
(2) Finish simulating all the levels of perforation density and test liquid flow rate as screen sample does.
1.5 Test Results
Test results, as shown in Figure 7, are several curves of inflow control drawdown versus perforation density under a series of inflow rate levels. They are drawn based on readings of component 5 of test apparatus, which stands for the total additional pressure drop due to well completion. For screen sample, the total drop represents the inflow control draw down created by staged screen;for base pipe sample, the total drop is that only caused by perforations and works as an important reference of screen sample test result.

Figure 7 Test results
Test results show that:
(1) Pressure drop through screen sample is obviously bigger than that of base pipe sample under the same perforation density and test liquid flow rate;
(2) Pressure drop through screen sample is more sensitive to perforation density and flow rate than base pipe sample.
Test results can be explained by Figure 8 and Figure 9.(Take 12 L/H flow rate for example)

Figure 8 Pressure in different positions of screen sample test
In Figure 8, taking 12 L/h flow rate for example,three curves are generated to explain where most of the flowing pressure is lost in screen sample test. Curve in position 1 are those readings of component 5 in Figure 2,which stand for the total inflow control draw down; curve in position 2 are readings from component 13, which indicate sum of 2 draw down parts respectively created by sand retention material slightly plugged by fine particles and base pipe perforations; curve in position 3 represents draw down through base pipe perforations, they can not be directly monitored in screen sample test, but are equal to and can be replaced by readings of component 13 in base pipe sample test under the same flow rate. Figure 8 shows that flowing pressure mainly reduces between position 1 and 2, secondly between position 2 and 3. What locates between position 1 and 2 is sand filter cake, while between position 2 and 3 is sand retention material plugged by fines. Flowing patterns in the two kinds of medium are seepage flow, which brings large pressure drop. The part of drawdown through perforations on base pipe (between position 3 and Axis X) is so small that it can be ignored,except the perforation density is extremely small, e.g. only 0.2 holes/m.

Figure 9 Flowing control process in sample
Therefore, it can be found from Figure 9 that perforations of base pipe of screen sample are not valid pressure drop producers, but play a key part in controlling seepage flowing field. Smaller perforation density will lead test fluid to pass along a longer axial and circumferential distance in seepage media before flowing into base pipe, and then will produce larger pressure drop compared to direct radial inflow.
2. PERFORATION DENSITY DECISION
Liquid production and water cut of Well DXY451P21 is respectively planned to be 49.3 m3/d and 82.0%, according to Table 1. The design method of inflow control completion(Al Marzouqi, et al, 2010; Karim, et al, 2010; Minulina, et al,2012; Yang, et al, 2014; Van der Bol, et al, 2016) divides Well DXY451P21 into three production intervals by external casing packers, and requests particular production per meter and inflow control drawdown in each interval, which are shown in Table 3.

Table 3 Flowing Control Requests and Designed Perforation Density of Well DXY451P21
The two inflow control requests in Table 3 are plotted on result curves of screen sample in Figure 7, and then the proper perforation density of staged screen for each production interval can be given in Column 6, Table 3.
3. APPLICATION RESULTS
One year after Well DXY451P21 was brought on stream,oil and liquid inflow profiles interpreted from production logging are compared with that of an adjacent Well DXY451P20 completed with conventional premium screen in Figure 10.

Figure 10 Inflow profiles of well DXY451P21 and DXY451P20
Figure 10 demonstrates that, liquid inflow profile of Well DXY451P21 is more balanced than Well DXY451P20, especially, oil production near Well DXY451P20 heel end is obviously inhibited by the overlarge local water inflow, which indicates that staged screen completion effectively improve the drainage performance. Specially note that there is not any production in the two sealed intervals of Well DXY451P21, as shown in Figure 1, and then its inflow profiles are not continuous.
To better illustrate the benefits brought by properly designed staged screen to Well DXY451P21, a factorROWwas introduced:

Where:
QO—Cumulative oil production in one year after well open, m3;
QW—Cumulative water production in one year after well open, m3.
QOis a parameter related to income, whileQWreflects additional energy which has to be cost to lift oil.ROWis the ratio ofQOandQW, which greatly influences the economic benefits. Well performances of Well DXY451P21 and several adjacent wells in Block 451, especially focusing onROW, are given in Table 4.

Table 4 Statistics on Horizontal Well Performances in Block 451
Table 4 shows that bothQOandQWof Well DXY451P21 are obviously higher than adjacent wells, which indicates that stage screen completion string is well designed and has effectively promoted the economic benefits.
CONCLUSION
(1) Inflow control drawdown of a screen sample and a base pipe sample were tested in laboratory apparatus, the test results are directly utilized to design staged premium screen completion in Well DXY451P21;
(2) Compared with base pipe sample, pressure drop across screen sample is obviously larger under the same perforation density and flow rate, and is more sensitive to perforation density;
(3) Flowing pressure is mainly lost in formation sand filter cake around screen and sand retention material,where the flow pattern is seepage. Perforations on base pipe of premium screen mainly play a part in regulating flowing field, smaller perforation density will lead inflow liquid to pass a longer distance in seepage media and bring larger additional drawdown;
(4) Staged premium screen completion will get a more reasonable design on the basis of screen sample test rather than only considering drawdown due to perforation itself.The production performance of Well DXY451P21 is much better than adjacent wells, which proves that proper design has provided improved economic benefits for target well.
 Advances in Petroleum Exploration and Development2019年1期
- Advances in Petroleum Exploration and Development的其它文章
- Simulated Calculation of Bullheading Method When the Well is Empty
- Development of Organic Soil Suitable for Biodiesel-Based Drilling Fluids
- Study on the Affection of Drilling Tools’ Abrasion to the Regular Pattern of Tensile Strength
- Optimization Program for Difficult-to-Produce Reservoir in Bonan Oil Feild
- Producibility Scenario of Unidentified Productive Zone
- A Drilling Liquid to Reduce the Damage Coalbed Methane