
Producibility Scenario of Unidentified Productive Zone
2019-08-05 09:23AnthonyKerunwa
Anthony Kerunwa
[a]Federal university of Technology, Owerr, Nigeria.
Abstract Reservoir studies of naturally repressured reservoirs are highly problematic. Thus, their reserve estimation is notoriously in error. This is aggravated by the presence of communicating areas. The repressurization is due to the enhancement of the reservoir energy sourced by additional undeveloped productive zone(s). The aim of this study was to determine the source of constant recharging(repressurization) of a reservoir in the Niger Delta Oil Field. Several techniques were adopted to investigate the source of repressurization of the reservoir. An unknown productive zone was identified to be communicating with the reservoir which increased the STOIIP by over 100%.
Key words: Producibility; Repressurization;Interconnected; Prolific; Sand
INTRODUCTION
The production of crude oil to the surface is of great concern to the petroleum Engineer (Ademola, 2008a). A form of energy is therefore essential for the production of the crude oil to the surface. The overall performance of an oil reservoir is largely determined by the nature of the energy, that is the driving mechanism available for moving the oil to the wellbore (Craft and Hawkins,1959; Obah, 1991; Ademola, 2008b). In an oil reservoir,production results from a mechanism which utilizes the existing pressure, which is the natural energy indigenous to the reservoir (Obah, 1991; Smithson, 2016). During the course of oil production from a reservoir, there is usually a pressure decline resulting from withdrawal of fluids from the reservoir and in agreement with the law of conservation of mass. This is actually obtained throughout the primary life of the reservoir. A situation may arise where the decline in pressure is followed by appreciation of pressure (see figure 2). This pressure increase may occur naturally (Obah,1991) or due to a pressure maintenance scheme embarked upon to arrest the decline (Dake, 1978; Smithson, 2016).If the aquifer is large, the pressure maintenance could be carried out for a long period of time (Smithson, 2016).Exceptionally, there may be a case where a reservoir can be getting energy in some form, from outside the limits of the presently defined area. This is a situation where the reservoir is being repressured naturally. When repressurization occurs naturally, it implies that voidage replacement is greater than the withdrawal as a result of the additional energy source (Obah, 1991). The sources of energy of the reservoir may be either:
i. Additional Interconnected Productive Zone
ii. Unrecognized Water Drive That Is Constantly Influencing the Reservoir (Crichlow, 1972a).
On the other hand the repressurization may be natural and on a regional scale or may be induced by hydraulicfracture treatments during well completions, or both. In this case, matrix-driven properties are very much in play,but small fractures swarms or larger fractures within the region correlated with basement faults and fractures may be the major contributing factors (Byrneset al.,2007).
In this work, we investigated the source of repressurization of a reservoir in the Niger
Delta oil field of Nigeria by subjecting the reservoir to material balance calculation to re-evaluate the STOIIP.This was necessary to know if the initial STOIIP obtained was in error. Thereafter, the aquifer strength was determined by calculating the water influx into the reservoir and finally efficiency rate test was carried out to ascertain any possible communication.
Assumption
No hydraulic fracture treatment was carried out on the wells of the reservoir understudy.
This study presents various techniques adopted to determine the source of repressurization of the reservoir.
1. EVALUATION PROCEDURE

Figure 1 Flow chart of the methodology
During the declining pressure period during production,it was expected that a state of equilibrium would ensue,when the voidage withdrawal is equal to the replacement.This is however not the case with repressured reservoirs(Obah, 1991), it was observed that up to the point of pressure increase, that is after thirteen (13) months of production, the pressure started building up steadily keeping the production characteristics of the reservoir unstable (Ademola, 2008a; Ademola, 2008b). The reservoir was subjected to material balance calculation to re-evaluate the STOIIP. This was achieved by matching observed production with pressure data using the Havlena and Odeh approach (Havlena, and Odeh, 1963; Havkena,and Odeh, 1964; Dake, 1978). The strength of the aquifer was determined by calculating the water influx into the reservoir through the Hurst and Van Everdigen method.Due to the fact that the withdrawal leads to an increase in pressure, at the point of repressurization, a negative sign convention was used for the water influx term at that point(Crichlow, 1972b).

The reservoir was further subjected to efficiency rate test to get a clear evidence of any possible communication.The source of repressurization was established by comparing the results obtained by material balance calculation with that of the volumetrically determined values, the result of the water influx calculation and finally that of the efficiency rate test.
2. GENERAL OVERVIEW OF EZ-FIELD
The Ez-field consists of three main reservoirs namely: EZ-702, EZ-710 and EZ-803 reservoirs. The field is 120km offshore in the southern part of the Niger Delta. The field came on stream on November, 2009. The EZ-702 is the largest reservoir in the field. To date, the 702 reservoir has produced from five wells with five supporting water injectors. As at the end of August, 2011 cumulative production from the reservoir stood at about 85.23mmstb of oil and 56.3bcf of gas. On the other hand, EZ-710 reservoir is the second largest in the field. Currently, EZ-710 reservoir has two producers and two water injector wells. At the end of August, 2011 cumulative production from the reservoir also stood at about 8.29mmstb of oil and 9.3bcf of gas. Finally, EZ-803 reservoir which is the reservoir understudy is the smallest reservoir in the EZ-field. This is the only reservoir that is producing from a single well and without a supporting water injection. The cumulative production reaches 12.14mmstb of oil at the end of August, 2011 which is higher than that of EZ-710 reservoir which is the second largest reservoir, with two producers and two supporting water injectors.
3. RESULTS
The results of the investigation to determine the source of constant recharging or repressurization of EZ-803 reservoir is thus presented.
3.1 Reservoir Ez-803
The reservoir started production in November, 2009 and is producing from a single well, EZ-18. It has an initial reservoir pressure of 5414 Psig. The reservoir is an undersaturated reservoir that is producing above bubble point. The reservoir was estimated to be carrying 118mmstb determined volumetrically. The cumulative production reaches 12.14mmstb of oil at the end of August, 2011.The reservoir pressure declined to 5000 psi after 13 months of production before repressurizng to 5030psi and was steadly increasing as shown in Figure 1.Material balance calculation was then carried out to affirm the production characteristic of the reservoir. Summary of material balance calculations is shown in Table 1, figures 3 and 4. The plot revealed a reserve of 260mmstb which differs from the volumetric value of 118mmstb. The water influx into the reservoir was then calculated to gain insight of the aquifer strentgth. Table 2 shows sumary of the water influx alculations. Finally an efficiency rate test was carried out on reservoir EZ-803 after 55 days of shutdown.This was to confirm if reservoir EZ-803 has any possible communication with unknown prolific sand. This resulted in well EZ-18 being subjected to variable Choke settings,each choke setting lasted for six hours before beaming up to the next choke setting. Table 3 shows summary of efficiency rate test.
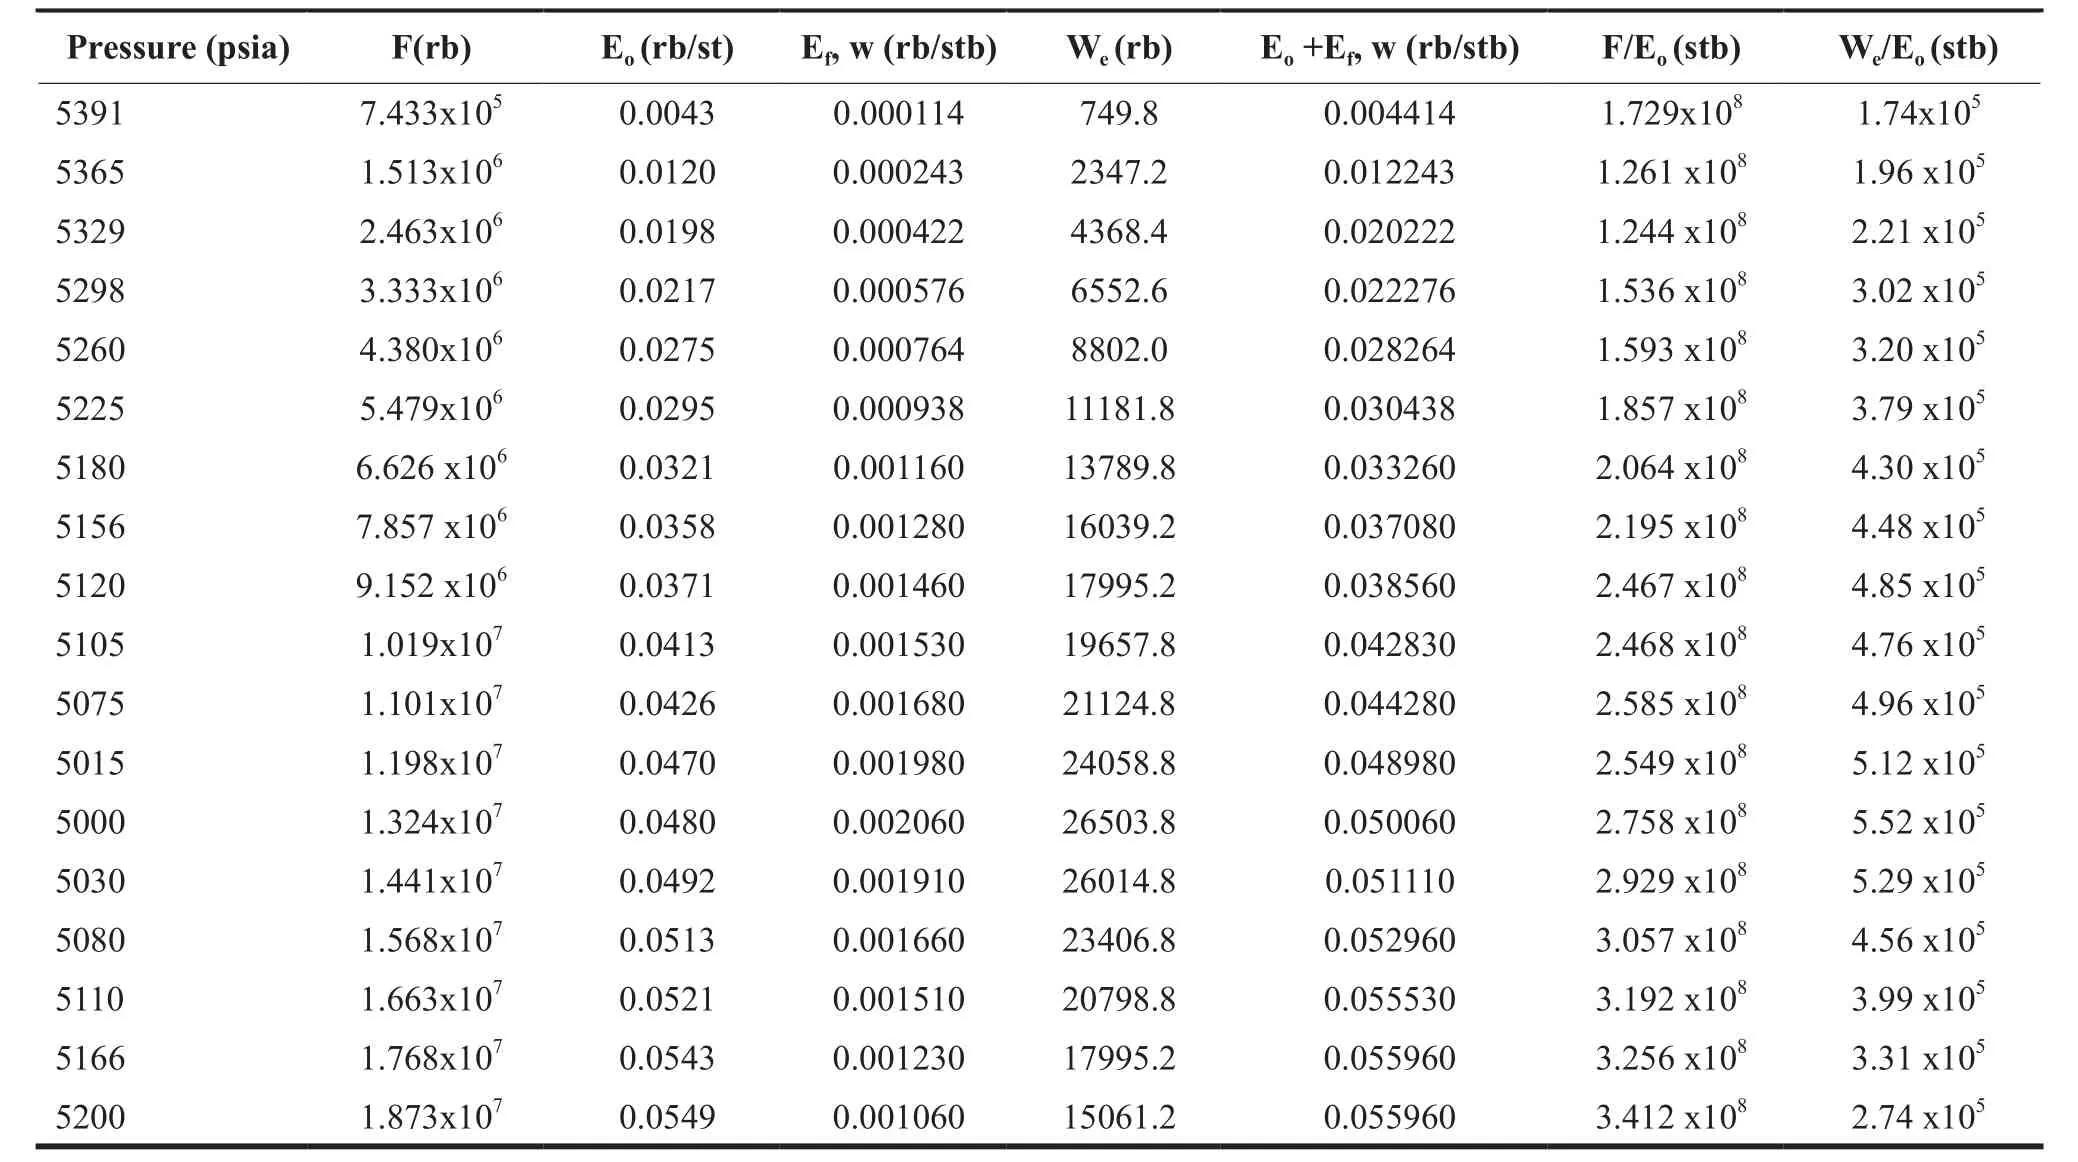
Table 1 Summary of Material Balance Calculations

Table 2 Summary of Water Influx Calculation

Table 3 Summary of Efficiency Rate Test

Figure 3 Material balance calculations, reservoir E8-803

Figure 4 Material balance calculations for reservoir Ez-803

3.2 Discussion of Results
The cumulative water influx into reservoir EZ-803 stood at 37, 946.4 rbbls. . From the calculation, this indicates presence of aquifer but not strong enough to support the reservoir as to cause such an appreciation of pressure.This is purely an indication of very low water cut. Since the water cut is very low, there is no evidence of an unrecognized water drive influencing the reservoir. In this study, the result obtained from the reserve estimation of 260 mmstb was not consistent with the volumetric estimate of 118mmstb. This result formed the basis for identifying the source of repressurization. The material balance estimate of 260mmstb indicates that the additional energy source is as a result of interconnected productive zones hitherto unknown. The result of the efficiency rate test gave 6% water cut which is an indication of near dry-oil. This is in agreement with the water influx calculation, which shows that the aquifer is not strong enough to support the reservoir as to cause such pressure appreciation. The Gas oil ratio (GOR)result maintained a near linear trend with maximum of 935 scf/stb and minimum of 929scf/stb in the wellbore.Being an undersaturated reservoir, the GOR trend would have been disproportionate because the critical gas saturation would have been exceeded at the largest choke setting. The largest choke setting was expected to flash the reservoir fluid thereby increasing the producing gas oil ratio (RP). This will allow the reservoir to produce below bubble point, but the reverse was the case as the reservoir was steadily being recharged by an unidentified energy source while the pressure was being maintained above bubble point. The fact that the largest choke setting could not flash the reservoir fluid thereby increasing the producing gas oil ratio caused the reservoir to produce below bubble point. This is a clear evidence that reservoir EZ-803 is communicating with another polific reservoir sand that is constantly recharging the reservoir. In this case of unrecognized productive zone being responsible for the repressurization, the practical implication is the reevaluation of ultimate recovery and formulation of new depletion strategies. Even though a state of equilibrium is approximated for the repressured part of the pressure profile, it would be expected that represurization should not continue indefinitely. Finally, it is pertinent to point out that after sometimes, the additional energy source would not sustain the voidage replacement and pressure decline would follow.
CONCLUSION
Reservoir studies of naturally repressured reservoirs are problematic. This is worsened if communicating areas are involved. Reserve estimation of reservoirs whose repressurization are due to the enhancement of the reservoir energy sourced by additional undeveloped productive zone are notoriously in error. Geoscientists should accurately delineate the bed boundaries before reservoir estimation are carried out. This study provides a method to determine the presence of communicating areas as a source of repressurization. Once a clear evidence of communication has been ascertained, the practical consequence is to drill an offset well to firm up the additional productive acreage.
 Advances in Petroleum Exploration and Development2019年1期
- Advances in Petroleum Exploration and Development的其它文章
- Staged Premium Screen Completion Design for Horizontal Well Based on Laboratory Test: A Successful Application in Block 451, Shengli Oil Field
- Simulated Calculation of Bullheading Method When the Well is Empty
- Development of Organic Soil Suitable for Biodiesel-Based Drilling Fluids
- Study on the Affection of Drilling Tools’ Abrasion to the Regular Pattern of Tensile Strength
- Optimization Program for Difficult-to-Produce Reservoir in Bonan Oil Feild
- A Drilling Liquid to Reduce the Damage Coalbed Methane