
Objective response rate assessment in oncology:Current situation and future expectations
2020-03-21 06:54NuriFarukAykanTahsinzatl
Nuri Faruk Aykan, Tahsin Özatlı
Abstract The tumor objective response rate (ORR) is an important parameter to demonstrate the efficacy of a treatment in oncology. The ORR is valuable for clinical decision making in routine practice and a significant end-point for reporting the results of clinical trials. World Health Organization and Response Evaluation Criteria in Solid Tumors (RECIST) are anatomic response criteria developed mainly for cytotoxic chemotherapy. These criteria are based on the visual assessment of tumor size in morphological images provided by computed tomography (CT) or magnetic resonance imaging. Anatomic response criteria may not be optimal for biologic agents, some disease sites, and some regional therapies. Consequently, modifications of RECIST, Choi criteria and Morphologic response criteria were developed based on the concept of the evaluation of viable tumors. Despite its limitations, RECIST v1.1 is validated in prospective studies, is widely accepted by regulatory agencies and has recently shown good performance for targeted cancer agents. Finally, some alternatives of RECIST were developed as immune-specific response criteria for checkpoint inhibitors.Immune RECIST criteria are based essentially on defining true progressive disease after a confirmatory imaging. Some graphical methods may be useful to show longitudinal change in the tumor burden over time. Tumor tissue is a tridimensional heterogenous mass, and tumor shrinkage is not always symmetrical; thus, metabolic response assessments using positron emission tomography (PET) or PET/CT may reflect the viability of cancer cells or functional changes evolving after anticancer treatments. The metabolic response can show the benefit of a treatment earlier than anatomic shrinkage, possibly preventing delays in drug approval. Computer-assisted automated volumetric assessments, quantitative multimodality imaging in radiology, new tracers in nuclear medicine and finally artificial intelligence have great potential in future evaluations.
Key words: Objective response rate; Tumor shrinkage; World Health Organization criteria; Response Evaluation Criteria in Solid Tumors; Immune Response Evaluation Criteria in Solid Tumors criteria; Early tumor shrinkage; Depth of response; Waterfall plot; Spider plot; Swimmer plot
INTRODUCTION
The tumor objective response rate (ORR) is the assessment of the tumor burden (TB)after a given treatment in patients with solid tumors and has a long history. The ORR is undoubtedly an important parameter to demonstrate the efficacy of a treatment and it serves as a primary or secondary end-point in clinical trials. The first attempts to describe response criteria to anticancer drugs were performed by Karnofsky[1]in 1961,Moertel and Hanley[2]in 1976, Levin et al[3]in 1977 and Macdonald et al[4]in 1990 based on their clinical experiences. Karnofsky and his group classified the therapeutic effects of a drug into three major categories: No clinically useful effect on the course of disease (category 0), clinical benefit with favorable objective changes in all measurable criteria of disease (category I), interruption of or slowing the progression of disease without definite evidence of subjective or objective improvement (category II).Objective improvements include clinical (such as regression of palpable lesions),pathologic, radiologic and biochemical regressions according to the specific type of cancer and individual patient. This classification highlights the importance of response duration; for example, less than one month of duration occurs in category 0.Moertel and Hanley’s assessments were based on tumor size by palpation. The response criteria developed by Levin et al[3]and Macdonald et al[4]were only for malignant brain tumors. Later, World Health Organization (WHO) criteria and Response Evaluation Criteria in Solid Tumors (RECIST) were developed for all solid tumors by working groups, mainly for cytotoxic chemotherapies and based on anatomic imaging[5-8]. These conventional response criteria, especially RECIST, were used for more than two decades in the era of chemotherapy as a surrogate end-point to overall survival (OS) in clinical trials. The efficacy of a chemotherapy was usually correlated with tumor shrinkage over time[9,10]. After the introduction of molecularly targeted treatment with biologic agents into oncology clinics and routine use of an fluorodeoxyglucose-positron emission tomography (FDG-PET) scan and advanced magnetic resonance imaging (MRI) techniques as functional imaging brought new perspectives in response evaluation. Moreover, very recently, immunotherapy by checkpoint inhibitors has led to the development of more specific response criteria because the patterns of response and progression to immunotherapy are different than those of cytotoxic chemotherapy and targeted biologic agents[10].
This review summarizes chronologically standard ORR evaluation criteria [WHO,RECIST v1.0, RECIST v1.1, modified RECIST (mRECIST)], response evaluation in targeted treatments with biologic agents (Choi and morphologic criteria) and then response assessments in immunotherapy (irRC, irRECIST, iRECIST, and imRECIST).We emphasize the importance of early tumor shrinkage (ETS) and depth of response(DpR) by some virtual examples. Later, we give some examples of graphical methods(Waterfall plot, Spider or Spaghetti plot and Swimmer plot) to demonstrate the details of tumor shrinkage, pseudoprogression and a durable response.
Finally, we will discuss the current situation and the limitations of size-based response assessments and alternative metrics of response with the importance of response duration and future expectations.
LITERATURE SEARCH
A systematic literature search was performed using PubMed for “objective response rate”, “WHO criteria”, “RECIST criteria”, “modified RECIST”, “Choi criteria”, “tumor shrinkage”, “early tumor shrinkage”, “depth of response”, “morphologic response”,“immune-related RECIST”, “waterfall plot”, “spider or spaghetti plot”, “swimmer plot”, “PERCIST”, “iPERCIST” and “volumetric response”. Conference abstracts were also included. Furthermore, the references of all selected articles were reviewed to identify any additional information.
WHO AND RECIST CRITERIA
WHO criteria were published by The WHO[5]in 1979 and by Miller et al[6]in 1981 to define the objective response, and they were used until 2000. According to the WHO criteria, the tumor size reflects its surface and is determined by bidimensional measurements and multiplication of the longest diameter by the greatest perpendicular diameter for single lesions. The total tumor load of a patient is the sum of the products of the perpendicular diameters for multiple lesions. The objective response to treatment is divided into four categories: Complete response (CR), partial response (PR), stable disease (SD) and progressive disease (PD) (Table 1).
For more than two decades, the WHO response criteria were used as the standard method for tumor evaluation. Due to the development of some problems such as the interobserver variability of the number of lesions, selection of measurable targets,minimum lesion size and definition of PD, WHO criteria became no longer comparable among research organizations[7]. Measuring all lesions was also a timeconsuming procedure and carried the risk of measurement errors. Next, to standardize and simplify the methodology, the RECIST version 1.0 was proposed as a new guideline to evaluate the response in 2000[8]. The arrival of new technologies such as computed tomography (CT) and MRI has also led to some new definitions of measurable lesions. RECIST v1.0 criteria brought the term of “target” and “nontarget”lesions. Target lesions are selected based on their size (from those with the longest diameter to shortest ones), are representative lesions of all involved organs, and they should be reproducible by repeated measurements. According to RECIST v1.0, all measurable disease up to a maximum of 5 lesions per organ and 10 lesions in total were representative of all involved organs and should be identified and recorded as target lesions at baseline. All other lesions were nontarget lesions. The RECIST v1.0 guideline was revised in 2009; the maximum number of target lesions per organ was reduced from 5 to 2, and 10 to 5 in total, in RECIST version 1.1[11]. Assessment of the pathological lymph nodes was incorporated as well; nodes with a short axis ≥ 15 mm were considered measurable, pathological and assessable as target lesions. Lymph nodes with a short axis < 10 mm were considered normal. Lymph nodes with a short axis between 10 and 15 mm were included as nonmeasurable nontarget lesions.
Table 1 shows a brief comparison of WHO, RECIST v1.0 and RECIST v1.1 criteria[5,6,8,11,12]. The best overall response is a result of a combination of tumor responses in target and nontarget lesions. If there is any new lesion, the overall best response is always PD. In the absence of any new lesion, CR is the complete disappearance of all target and nontarget lesions. No change in nontarget lesions reduces a CR in target lesions to an overall PR, but no change in nontarget lesions does not reduce a PR in target lesions.
MODIFICATIONS OF RECIST CRITERIA
In 2006, the first mRECIST criteria were presented first by Zacharia et al[13]from the United States and then by a Korean group[14-16]in three small-sized studies and in one pooled analysis[17]. As a main modification, they proposed one single largest target lesion per organ instead of 2 in their patients with colorectal cancer (CRC), non-small cell lung cancer and gastric cancer. They reported a high level of concordance with the original RECIST v1.1., but the number of their patients was small (153 patients) for validation.
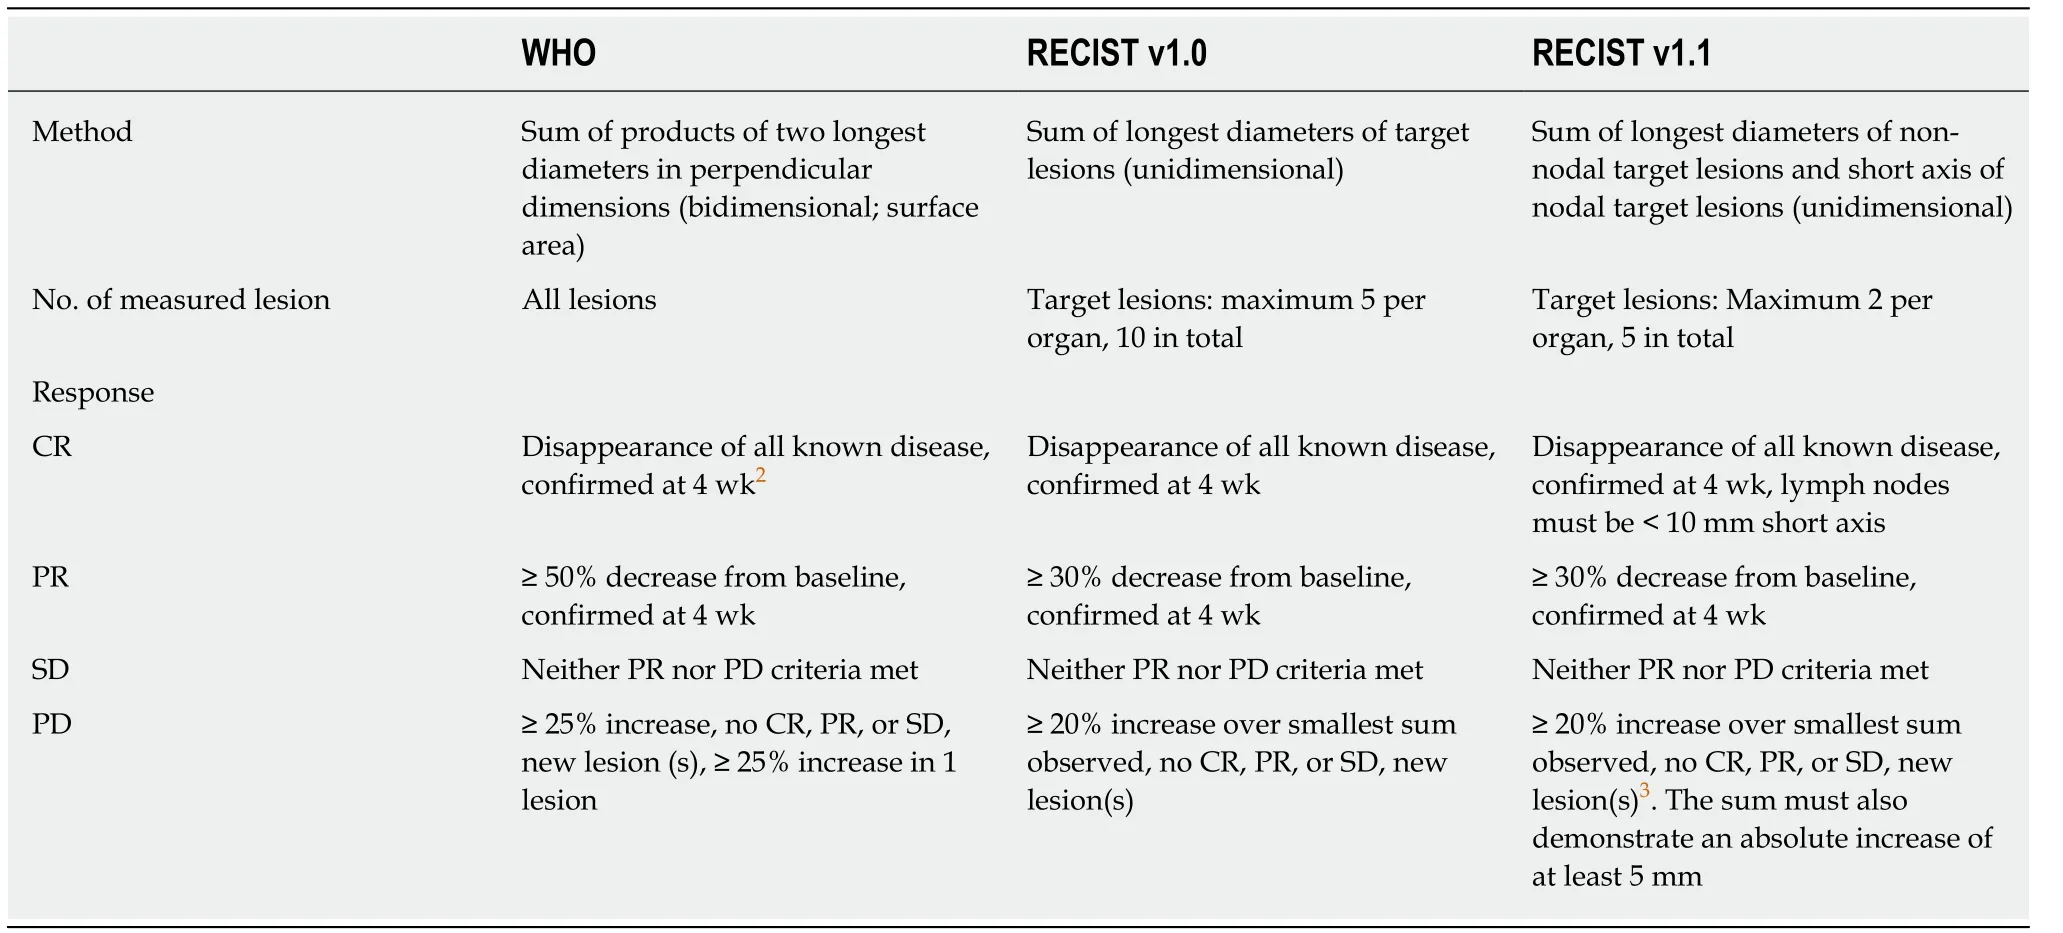
Table 1 The World Health Organization, Response Evaluation Criteria in Solid Tumors version 1.0 and Response Evaluation Criteria in Solid Tumors version 1.1 criteria1
Another mRECIST was described by Lencioni et al[18]for hepatocellular carcinoma(HCC). In intermediate-stage patients with HCC, according to the Barcelona Clinic Liver Cancer staging classification, the recommended first-line therapy was transarterial chemoembolization (TACE) and, in the advanced-stage patients, the recommended first-line therapy was sorafenib, which is an antiangiogenic tyrosine kinase inhibitor[19,20]. Recent studies have shown a poor correlation between the clinical benefit provided by sorafenib or interventional locoregional therapies such as TACE,transarterial radioembolization or radiofrequency ablation and conventional response criteria[18-22]. mRECIST for HCC was developed based on a new concept of a viable tumor proposed by the European Association for the Study of the Liver (EASL)panel[23]. A viable tumor was defined as showing intratumoral arterial enhancement by contrast agent during dynamic CT or MRI[23]. Therefore, measuring tumor enhancement is a surrogate marker of a viable tumor. Thus, tumor necrosis induced by treatment (TACE or sorafenib) is also considered as a response assessment.According to mRECIST for HCC, CR is the disappearance of any intratumoral arterial enhancement in all target lesions. PR is at least a 30% decrease in the sum of the diameters of viable (contrast enhancement in the arterial phase) target lesions, taking as reference the baseline sum of the diameters of the target lesions. PD is an increase of at least 20% in the sum of the diameters of viable target lesions, and SD is any cases that does not qualify for either PR or PD. Overall response is a result of the combined assessment of target lesions, nontarget lesions and new lesions[18]. The EASL proposed another set of response criteria for HCC[21]. EASL criteria include 2-dimensional methods like WHO, but they consider the enhanced tumor area like mRECIST.
Tumor shrinkage is not always symmetrical; tumors have heterogenous changes due to necrosis, fibrosis or intratumoral hemorrhage, especially after locoregional therapies or biologic agents[24]. The new proposed criterion, quantitative EASL(qEASL), is the 3-dimensional volumetric assessment of enhancing tumor tissue[25].Table 2 shows a comparison of mRECIST for HCC, EASL and qEASL[18,22-25]. qEASL predicted survival better than RECIST, mRECIST and EASL criteria in patients with HCC[24].
Another alternative of conventional RECIST was developed and validated for malignant pleural mesothelioma (MPM)[26,27]. Due to anatomic reasons such as the curved structure of the chest wall, defining the limits of the longest unidimensional diameter of tumor mass before and after the treatment may be difficult. The mRECIST criteria for MPM consider tumor thickness perpendicular to fixed structures such as the chest wall or vertebral colon in two positions on the same transverse cut of CT scan. The sum of the two measurements in three axial sections (six measurements)defined a pleural unidimensional measure. Nodal, subcutaneous and otherbidimensionally measurable lesions are measured unidimensionally per the RECIST criteria and are added to the total TB. PR is at least a 30% reduction in the total tumor measurement, PD is defined as an increase of at least 20% in the total tumor measurement over the nadir, or the appearance of new lesions.
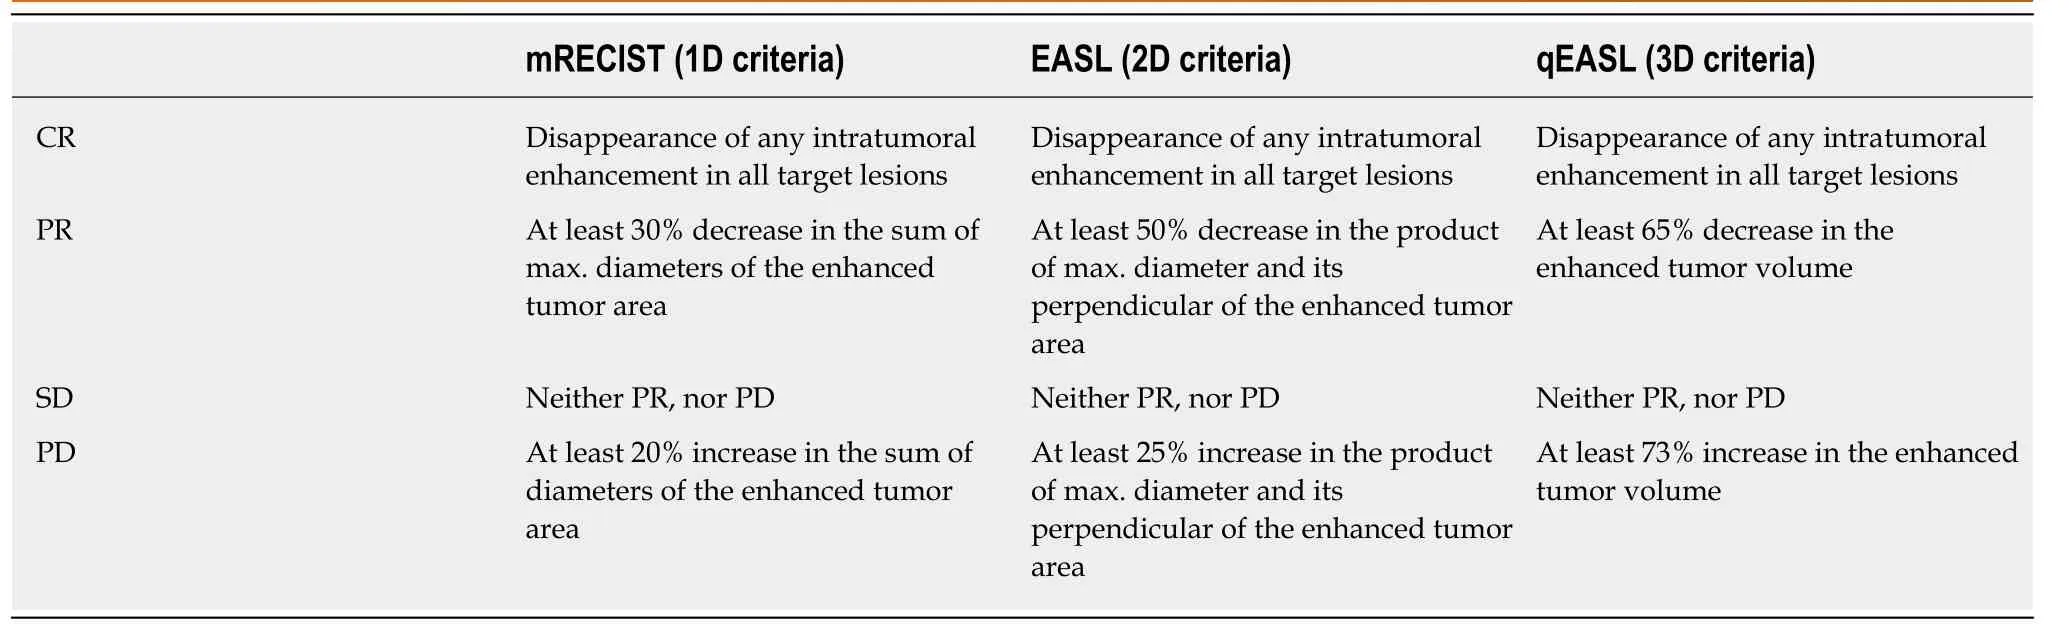
Table 2 Comparison of modified Response Evaluation Criteria in Solid Tumors, European Association for the Study of the Liver and quantitative European Association for the Study of the Liver criteria for hepatocellular carcinoma[18,19,22-25]
RESPONSE EVALUATION IN TARGETED TREATMENTS WITH BIOLOGIC AGENTS
The first targeted antitumor agent that requires re-evaluation of the existing response criteria used to assess treatment response is imatinib mesylate which is a c-KIT receptor tyrosine kinase inhibitor in gastrointestinal stromal tumors (GISTs)[28-30].Following imatinib treatment, in some cases, the tumor size increases due to intratumoral hemorrhage, necrosis or myxoid degeneration. In many GISTs, the early decrease in the tumor size is minimal. On the other hand, more dramatic changes in responding GISTs is the decrease in the tumor density, which can be measured as the Hounsfield unit on CT. Therefore, Choi criteria were proposed and prospectively validated in patients with imatinib-treated metastatic GIST[28,29]. The response by Choi criteria is a 10% decrease in the tumor size or a 15% decrease in the density on contrast-enhanced CT and was found to be reproducible, more sensitive, and more precise than RECIST, and was correlated significantly with the time to tumor progression and disease-specific survival.
Two major biologic agents whose response rates were largely discussed in new large-scale randomized trials are the anti-vascular endothelial growth factor-targeted monoclonal antibody (MoAb) bevacizumab and an anti-epidermal growth factor receptor (EGFR) MoAb cetuximab. First, in the NO16966 study which is a randomized phase III trial comparing oxaliplatin-based chemotherapy with or without bevacizumab as first-line therapy in metastatic CRC, the response rates were found to be similar in both arms, although the median progression-free survival (PFS) was significantly superior with the addition of bevacizumab to oxaliplatin-based chemotherapy[31]. In a retrospective analysis of the pathological response in patients with CRC liver metastases (LM) following treatment with bevacizumab-containing chemotherapy, the pathological response rate was significantly superior in bevacizumab-treated patients than in those receiving chemotherapy alone (49% vs 27%, P = 0.03), although the RECIST response rates were similar (51%) with and without bevacizumab[32]. Another three previous retrospective studies showed improvement of the pathological response in patients treated with bevacizumab plus chemotherapy[33-35]. The addition of bevacizumab to oxaliplatin-based chemotherapy significantly reduced the degree of tumor viability[33]. Fluoropyrimidine plus oxaliplatin and bevacizumab combination therapy is one of the independent predictors of a pathologic response[34]. Bevacizumab improves the tumor regression grade to chemotherapy significantly[35]. Stremitzer and colleagues[36]prospectively investigated whether the type of MoAb (bevacizumab or cetuximab) with neoadjuvant chemotherapy was associated with the histological response and the pattern of tumor destruction in patients with CRC LM. They found that the addition of bevacizumab to combination chemotherapy showed more necrosis but less fibrosis than cetuximab.
On the other hand, a complete pathologic response (CPR) is a strong predictor of prolonged survival or cure in CRC LM[34,37-39], but total tumor necrosis or CPR does not always indicate a complete clinical response identified by CT[32,37].
As a result, RECIST criteria may not be optimal to evaluate the response to bevacizumab; size-based radiological methods may not differentiate between the tumor and fibrotic tissue due to effective biological therapy[32,33,36]. Recently, new criteria (morphologic response) based on morphologic changes, such as a sharply or poorly defined tumor-liver interface and homogeneous or heterogeneous attenuation observed on contrast-enhanced CT, were defined in patients with CRC LM,undergoing chemotherapy with or without bevacizumab[40,41]. The CT morphology comprises three groups of lesions: Homogeneous lesions with sharp edges (group 1),heterogeneous structures with poorly defined edges (group 3) and intermediate mixed lesions (group 2). Nishioka et al[42]showed that the CT morphology predicts tumor viability and long-term surgical outcomes after chemotherapy in patients with CRC LM. Intratumoral heterogeneity in the primary tumor and its vasculature(angiogenic or non-angiogenic), as well as related lymphatic and hepatic metastasis,may also result in different responses to anticancer therapy[43,44].
Recently, in the FIRE-3 trial comparing cetuximab with bevacizumab, in combination with fluorouracil, folinic acid and irinotecan (FOLFIRI), as a first-line treatment in patients with KRAS exon 2 wild-type metastatic CRC, the primary endpoint was the objective response rate according to RECIST v1.0, and this was found to not be significantly different between the two arms; the median PFS was also similar, but the OS was significantly superior in the FOLFIRI plus cetuximab arm[45].Several explanations are possible for these surprising results, such as a lack of an independent radiological review of response data and effect or underuse of secondline treatments, and one of them is the inadequacy of RECIST for different targeted therapies[45-47]. Later, an independent, central radiological evaluation showed that the rate of ETS and DpR were significantly greater in patients treated with FOLFIRI plus cetuximab[48]. ETS was defined as a reduction in the tumor diameter of more than 20%at the first tumor assessment (week 6) after the baseline. DpR was defined as the maximal tumor shrinkage observed in a patient. The median time to the maximal tumor response was 3.5 mo in the cetuximab arm and 3.6 months in the bevacizumab arm[49]. DpR is a nadir of tumor shrinkage compared with baseline[50]. According to RECIST, at least a 30% decrease in the sum of the longest diameters indicates PR, and minor tumor progression (1%-19%) and minor tumor shrinkage (0%-29%) cover SD category. ETS, as a categorical measure, includes tumor size reduction in the range of 10%-30% according to a trial as a cut-off percentage, and this was shown to be significantly associated with PFS and OS in several retrospective analyses from previous trials[50-53]. Among these trials, in the BOND study the ETS cut-off was set at 10% and the time of the first response assessment was set as 6 wk[50,53]. Figure 1 shows a simple model of different ETS definitions on a waterfall plot. A systematic review and pooled-analysis of 21 trials showed that patients with ETS were associated with better OS and PFS than early nonresponders in metastatic CRC (mCRC)[54]. On the other hand, early and fast maximum tumor shrinkage (at week 6 or 8) may allow a possible safer resection of CRC LM, before the occurrence of liver damage induced by prolonged chemotherapy[55,56]. The impact of ETS and resection on the outcomes in patients with wild-type (wt) RAS mCRC was investigated in the PRIME trial as a secondary end-point[56]. The PRIME trial compared FOLFOX4 chemotherapy vs FOLFOX4 plus a fully human anti-EGFR MoAb panitumumab as first-line treatment in mCRC and demonstrated that panitumumab+FOLFOX4 significantly improved PFS and OS in patients with wtRAS mCRC[57-59]. Douillard et al[56]indicated that more patients receiving panitumumab+FOLFOX4 had tumor shrinkage and they concluded that ETS appeared to be associated with improved PFS and OS irrespective of the treatment received. ETS and DpR are RECIST-independent parameters; they are not recorded by RECIST-based assessments[45,49].
The early morphologic response was also evaluated in patients with RASwt mCRC in a retrospective analysis[60]. An early optimal morphologic response (EOMR) was defined as a change from group 3 or 2 according to morphologic response criteria at baseline CT to group 1 at the first assessment by CT. In this trial, Masuishi et al[60]found that patients with EOMR had longer PFS than those without EOMR in patients treated with bevacizumab.
The term of “the depth of response (DpR)” shows that all PRs are not the same. We present here hypothetical 2-D examples to compare and contrast WHO and RECIST criteria (Figure 2). Here, in example 1, we draw a regular spheroid mass (A) with symmetric (proportional) shrinkage following treatment. Example 2 shows an irregular mass (X) with asymmetric shrinkage after treatment. The baseline (at time 0;t0) perpendicular diameters for both tumors are the same; 6 cm × 5 cm.
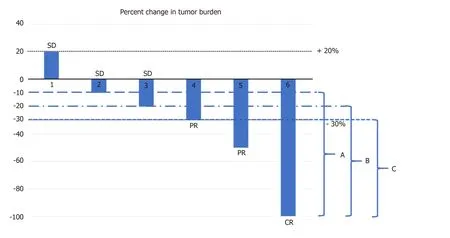
Figure 1 Different cut-off levels of E of early tumor shrinkage at first tumor response assessment (6 or 8 wk). A: ≥ -10% (5 cases); B: ≥ -20% (4 cases); C: ≥ -30% (3 cases). CR: Complete response; PR: Partial response; SD: Stable disease.
As shown in Table 3, in example 1, no difference was found in the response evaluation at time point 1 (t1) and time point 2 (t2) between WHO and RECIST.However, in example 2, at t1, the tumor response was PR according to RECIST while the WHO response was SD (Table 3). On the other hand, among PRs, although the longest diameter was the same (4 cm) of tumors B, Y and Z, the smallest tumor according to surface was Z; therefore, WHO criteria could distinguish a DpR, but not RECIST (Table 4). We previously presented this virtual comparison of size-based tumor shrinkage methods and the effect of tumor heterogeneity in 2016[61].
RESPONSE EVALUATION IN IMMUNOTHERAPY
Immune checkpoint inhibitors such as ipilimumab (an anti-CTLA4 MoAb),nivolumab or pembrolizumab (anti-PD 1 antibodies) or atezolizumab (an anti-PD L1 antibody), are active immuno-oncology drugs that have received marketing authorizations since 2011 and have become increasingly available in oncology clinics[10,62,63]. In early studies with these drugs, researchers observed different, atypical and unique response patterns than those with traditional cytotoxic and other molecularly targeted agents[10,63]. This indicated an initial radiological progression by RECIST and subsequent delayed tumor shrinkage; this phenomenon was termed as peudoprogression[62]. During pseudoprogression, biopsy demonstrated inflammatory cell infiltrates, edema or necrosis[62]. The use of RECIST in this situation resulted in premature discontinuation of therapy, although there was a clinical benefit or a later response[10]. Delayed but durable responses were associated with prolonged survival in a subset of patients. These insufficiencies demonstrated the need for more precise criteria in immunotherapy. Figure 3 illustrates pseudoprogression.
Immune-specific response criteria were described chronologically as the irRC(immune-specific related response criteria), irRECIST (immune-related RECIST),iRECIST (immunotherapy RECIST) and imRECIST[63-66]. One of the main differences in these criteria compared with RECIST is the necessity for the confirmation of true PD at least 4 wk after from the first assessment. The baseline measurable minimal target lesion size is 5 mm × 5 mm in irRC and at least 10 mm in irRECIST and iRECIST for non-nodal metastases. irRC represents a bidimensional criteria like the WHO criteria,while the others are unidimensional. The appearance of new lesions during treatment is incorporated into the sum of the measurements; this is another difference from RECIST. Because many immunotherapy trials used conventional RECIST since 2010,making a universal comparison of data from different trials is difficult; thus, a consensus guideline published iRECIST in 2017 to minimize the variability of interpretation[10]. iRECIST is a mRECIST v1.1; the definitions of measurable and nonmeasurable disease, target and nontarget lesions are the same. Table 5 compares immune-specific response criteria.

Figure 2 Two hypothetical examples of tumor shrinkage. Example 1: Spheroid mass, symmetric (proportional)shrinkage; Example 2: Irregular mass, asymmetric shrinkage. t0: Time point baseline; t1: Time point-1; t2: Time point-2; A, B, C: Spheroid mass; X, Y, Z: Irregular mass.
GRAPHICAL METHODS TO DEMONSTRATE TUMOR SHRINKAGE AND RESPONSE DURATION
The ORR depends on the categorization of the used response criteria. These categorizations have a certain degree of arbitrary cut-off values such as a 20% increase for PD or a 30% decrease for PR at a certain time point (4 or 8 wk)[8,11,67,68]. It does not demonstrate continuous change in the TB over time. Intermittent measurement of the response by certain intervals to obtain the response duration may result sometimes in the loss of information such as early progression before the time of visit or death. The continuous longitudinal analysis of the TB data requires some graphical methods[67].The popular graphical methods are the waterfall plot, spider (or spaghetti) plot and swimmer plot[67,69-71](Figure 4). The waterfall plot is a bar chart that shows the largest percentage change relative to baseline in TB for each patient[67,69]. The horizontal axis(x) is used generally as a baseline measure and the vertical bars may go either above or below the baseline. Each bar represents one patient. The vertical axis (y) is generally used to quantify the response to treatment for example, percentage of growth or reduction. The negative vertical bars demonstrate reduction between 0%and -100%, and positive bars show nonresponders or progression. The bars are usually ordered from the worst (PD) response on the left side to the best (CR) value on the right side of the plot. We can easily see responders, nonresponders and stable patients in an area between the +20% and -30% lines; at a glance, an idea about the effectiveness can be obtained between two different treatments if different colorcoded bars are used. The waterfall plot does not demonstrate the timing and durability of the response. Another commonly used graphical method is the spider plot where the percentage change from baseline is plotted against time for each patient. Each line represents one patient. We can observe pseudoprogression and response duration in the spider plot. Both methods have some limitations; they do not provide any statistical results when there is more than one treatment arm, and their use is limited when there are many patients[67,68]. Waterfall plots should be generated by trained radiologists due to the high interobserver variability[72]. A third graphical method is called the swimmer plot that shows an individual subject’s pattern of response[70]. In the swimmer plot, we observe multiple pieces of a patient’s response story, the duration of response and treatment. In Figure 4, we tried to demonstrate these graphical methods using 12 hypothetical cases.
These longitudinal graphical alternative methods of evaluating the response and some new simulation models with survival can be used, especially in early-phaseclinical trials to better characterize the treatment effect and inform decisionmaking[67,73].
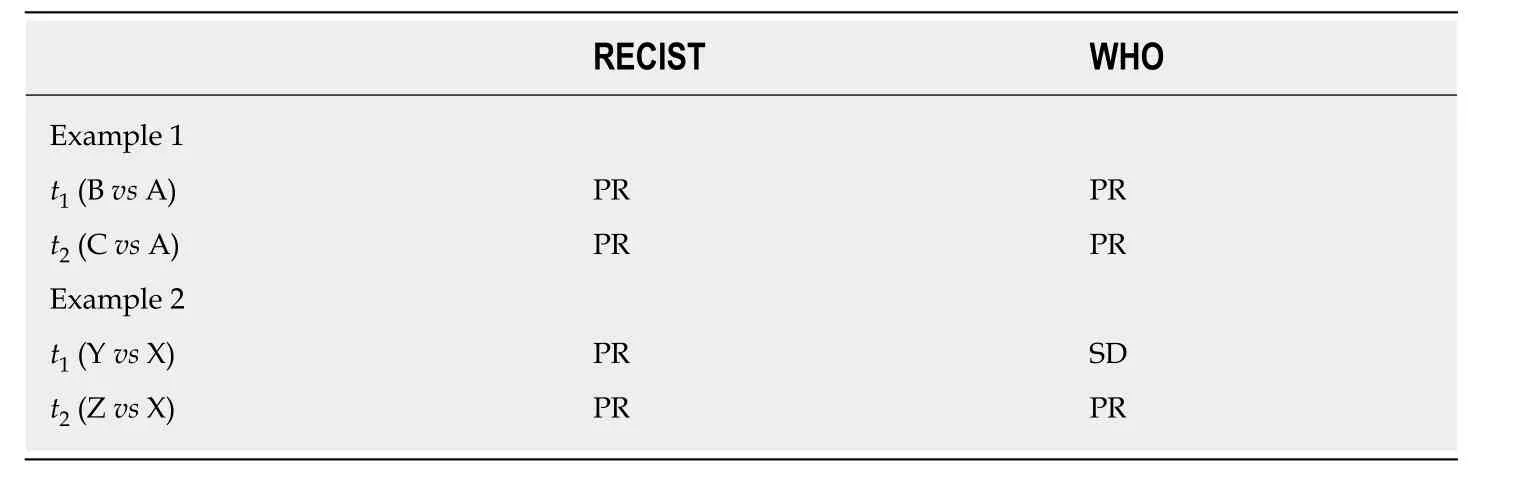
Table 3 Response evaluation in example 1 and example 2 of Figure 2
METABOLIC RESPONSE
WHO criteria, RECIST and RECIST v1.1 are anatomical response criteria. They are based on the visual assessment of the tumor size in morphological images provided by CT or MRI. As mentioned above, the reduction in the viable tumor does not always result in a volume reduction, because the tumor tissue can be replaced by necrotic or fibrotic tissue and morphological changes cannot differentiate among these different tissue types, and volume changes are quite late events such as 2-3 mo[74]. In addition to anatomical and morphological imaging, metabolic imaging has become increasingly important in recent years.
Accelerated glucose metabolism is one of the functional changes observed in cancer cells, and this hallmark of cancer was first recognized by Otto Warburg[75,76].Radioisotope-based molecular imaging techniques such as PET and single-photon emission CT capture functional pathologic changes[77]. A strong relationship was shown between18F-FDG uptake and cancer cell number in a substantial number of studies[78]. PET can detect cancers that are smaller than demonstrated on CT. The limit of resolution for detecting cancers by18F-FDG PET generally ranges between 0.4 and 1.0 cm, corresponding to approximately 108-109cells[78].18F-FDG-PET CT can detect early metabolic changes in tumor cell metabolism before any change in tumor size occurs[79].
In RECIST v1.1, FDG-PET is included in the detection of new lesions in 2009[11]. In the same year, PET response criteria in solid tumors (PERCIST) were published by Wahl et al[78], and a simplified guide to PERCIST 1.0 was published in 2016[80]. Before PERCIST, EORTC PET response criteria were published in 1999[81]. EORTC PET response criteria and PERCIST follow the model of RECIST and define 4 response categories: Complete metabolic response (CMR), partial metabolic response (PMR),stable metabolic disease and progressive metabolic disease[82]. As a quantitative parameter, EORTC PET criteria use the mean standardized uptake value (SUVmean),normalized to the body surface area. PERCIST uses the SUVpeak, normalized to the lean body mass (abbreviated as SUL). The threshold of SUV change to define a response is 25% in EORTC PET criteria. PERCIST uses a change in the FDG uptake by 30% as a threshold for response and progression. These thresholds were calculated based on excluding the fluctuations of measurements of SUVs and have therapeutic effects[82]. Table 6 summarizes EORTC PET criteria and PERCIST 1.0. Recent clinical studies compairing these two metabolic criteria with each other as well as with RECIST and a pooled analysis have indicated that metabolic criteria lead to very similar classifications but there are significant differences between them and RECIST[82,83]. PERCIST is better correlated with patient outcome and may be a better predictor for the effectiveness of new anticancer treatments than RECIST. These findings require confirmation by data from randomized trials.
Metabolic response assessments using PET have the potential also after immunotherapy. Goldfarb et al[84]proposed immune PET Response Criteria(iPERCIST), which were adapted from PERCIST and iRECIST[63,80](Table 6). iPERCIST is a dual-time-point evaluation of “unconfirmed progressive metabolic disease(UPMD)”; baseline PET imaging (SCAN-1) is performed within 1 mo before the start of immunotherapy, follow-up PET (SCAN-2) is peformed at 8 wk after the first dose,and, in the situation of UPMD, a second follow-up FDG-PET (SCAN-3) is performed 4weeks later to confirm PD.
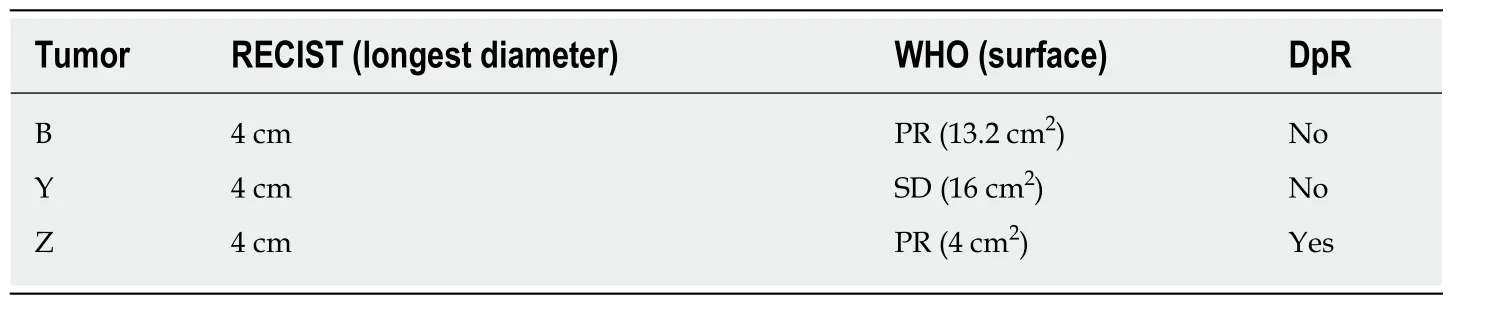
Table 4 Depth of response in Figure 2
It appears that18F-FDG uptake by the tumor is a consequence of an intact metabolic activity and reflects the viability of neoplastic cells[85]. Presently,18F-FDG-PET CT occurs in the standard management of lymphomas as a reliable biomarker. After two cycles of the ABVD regimen in Hodgkin lymphoma (HL), interim18F-FDG-PET CT is used to assess the treatment response in patients with early-stage disease. In 2009, the Deauville criteria were defined to interpret this interim and end-of-treatment PET scans[85,86]. Deauville criteria use a 5-point scale (5-PS) based on the visual uptake of18F-FDG in the involved sites (Table 7). This 5-PS has been validated for use at interim PET (iPET) and end-of-treatment PET in lymphomas[87]. A score of 1 (no uptake) or 2(uptake ≤ mediastinum) is considered a CMR at iPET and end-of-treatment PET[86-88].A score of 3 is considered an inadequate response at the time of iPET, and undertreatment of HL should be avoided. A score of 4 or 5 with reduced uptake compared with baseline without new lesions is considered a PMR at iPET. At the end of treatment, a score of 4 or 5 indicates treatment failure even if uptake is reduced. In non-Hodgkin lymphomas (NHLs), Lugano response criteria are based on the metabolic response by PET/CT using 5-PS, and the radiologic response by contrastenhanced CT[88]. iPET scan can be used after 2 or 4 cycles of chemotherapy in NHL,but has limited prognostic value due to false-positive results[88].
CONCLUSION AND FUTURE EXPECTATIONS
OS is the gold standard that shows a treatment benefit in oncology. However,sometimes, it takes a long time and waiting for a comparison of the OS difference between treatment arms may delay drug approval by regulatory authorities. The TB data that cover ORR and PFS may be used as surrogate endpoints to OS. As we mentioned in the Introduction section, the assessment of the tumor ORR is important to report the results of clinical trials and for clinical decision making in routine practice[82]. The WHO (bidimensional) and RECIST (unidimensional) criteria are anatomic response criteria that reflect tumor shrinkage, mainly after cytotoxic chemotherapies. The theoretical reason of the unidimensional measurement of tumor size is essentially based on the direct relationship between the number of tumor cells in a spherical tumor and maximum diameter of the tumor mass[89]. Cell killing by chemotherapy is directly related to the dose; a PR is a function of the maximum diameter in the situation of proportionate (symmetrical) reduction of the initial tumor mass. If we consider the tumor tissue heterogeneity, tumor vascularization, necrosis,fibrosis, and intratumoral hemorrhage, tumor shrinkage may not always be symmetrical, especially in the era of biologics[28,29,32,39,40]. Tumor mass decrease is sometimes due to fragmentation rather than shrinkage of the primary tumor, as seen in rectal cancer after chemoradiotherapy[90]. Asymmetric shrinkage is also observed in prostate cancer after external beam radiation therapy[91]. Therefore, anatomic response criteria may not be optimal for biologic agents, some disease sites, some regional therapies. Consequently, modifications of RECIST, Choi criteria and morphologic response criteria were developed based on the concept of the evaluation of a viable tumor (contrast enhancement area and changes in tumor density)[28,41,42]. On the other hand, anatomic assessments alone may take two or three months to detect morphological changes or a shrinkage, whereas metabolic response assessment by PET can show changes as early as 8 d after the start of treatment[74,92,93].

Figure 3 Pseudoprogression. t0: Time point baseline; t1: Time point-1; t2: Time point-2; NK: Natural killer.
RECIST was introduced based on retrospective clinical data, including more than 4000 patients assessed for the tumor response and then validated in prospective studies[92]. RECIST v1.1 was developed from the assessment of a large database that consists of > 6500 patients and > 18000 target lesions[11]. In a recent survey performed from key partners of the RECIST collaboration, it was shown that 52.3% responders were satisfied with RECIST v1.1[93]. A newest published pooled database analysis from the RECIST Working Group also indicated the good performance of RECIST v1.1 to evaluate the tumor response to targeted cancer agents (TCAs) independent of the subclass of TCA (signal transduction inhibitors or angiogenesis inhibitors) or tumor type[94]. Although validation studies exist and are generally accepted by regulatory agencies, the RECIST v1.1 criteria cannot capture the atypical responses observed with immunotherapy[11,95]. Atypical patterns of response (pseudoprogression) to anti-PD-1 therapy are observed at approximately 6%-10%[96]. Immune RECIST criteria are based essentially on the definition of true PD after confirmatory imaging.
Another clinically important reflection of tumor heterogeneity is contradictory progression of one or a few sites of disease despite an overall TB response to systemic therapy; this concept is called oligoprogression[97,98]. This concept is different than oligometastasis which indicates small number of metastases (generally less than five).In the oligometastatic state of cancer, patients are still candidates for regional potential curative therapy (surgical resection, ablation or RT)[97]. In oligoprogression,there can be diffuse metastatic disease, there is no upper limit of the number of metastases, and a few metastases progress whereas the most of the other tumors are not progressing[98].
With increasing use of immunotherapy, some rapid progression was described, and this immunotherapy-induced acceleration of tumor growth (twofold or greater increase in a time less than 2 mo) was called hyperprogression[10]. Actually, this exceptional situation is a very hot topic of research in immuno-oncology.
In the genomic era, due to smaller homogeneous populations, powering a randomized clinical trial for an end point of OS may no longer be feasible; therefore the ORR and duration of response in single-arm trials may lead to an accelerated approval of new drugs[99]. In a recent analysis of 542 arms for 294 regimens in solid tumors, Oxnard et al[100]found that demonstrating an ORR exceeding 30% with a single agent was highly specific to identify regimens achieving regulatory approval.
For some disease sites, such as the bone and brain, organ-specific response criteria were developed: MD Anderson (MDA) criteria for bone metastases, RANO for brain tumors[101,102]. Bone lesions are not measurable according to RECIST v1.1, only bone lesions with an identifiable soft tissue component may be used as target lesions[11,93].MDA criteria incorporated CT and MRI to assess the response of bone metastatic lesions besides using plain radiography and skeletal scintigraphy[101]. Sclerosis of previous lytic lesions on CT or regression of measurable lesions on CT or MRI was considered as a PR[101]. In neuro-oncology, the Macdonald criteria, which was widely used until recently, determines the response as a change of a product of the maximal cross-sectional enhancing diameters together with changes in the neurologic status of patients and corticosteroid use[4]. These criteria did not consider the nonenhancing tumor, pseudoprogression and pseudoresponse. To address pseudoprogression,which is a transient increase in contrast enhancement observed in 10%-30% of patients with glioblastoma immediately after chemo-radiotherapy, the RANO criteria recommended, for recurrent disease, clear progression outside the radiation field or clear histologic documentation of progression after the first 12 wk after RT[102]. A pseudoresponse which is a marked decrease in contrast enhancement as early as 1-2 d after antiangiogenic therapies due to a decrease of vascular permeability, does not reflect a true response[103]. The RANO criteria recommended a confirmatory scan at least 4 weeks later to ensure a sustainable response. The RANO criteria defined progression not only as a 25% increase in the contrast-enhancing area but alsoincluded any significant enlargement of a nonenhancing T2/FLAIR signal on MRI.Table 8 summarizes current objective response assessment criteria.

Table 5 Immune response criteria[63-66]
Tumor tissue is a three-dimensional (3D) mass in the body, and, theoretically volumetric assessment of the objective response may detect precise changes in the TB.In spherical tumors, a decrease in the volume [V = (4/3) πr3] of 65% or greater corresponds to a 50% reduction in the product results [(2r)2] (WHO criteria) or 30%reduction in the diameter (2r) (RECIST) and indicates PR[5,6,89]. PD, which indicates a 20% increase in the diameter according to RECIST, corresponds to a more than 73%increase in volume, but a 25% increase in area according to WHO is corresponds to a 40% increase in volume[89]. Several studies have used 3D or volumetric measurements in different types of tumor and performed different comparisons since 1996[104-119].Tumor volume measurements using CT initially started for radiotherapy treatment planning in the 1980s and was found to be highly accurate in early trials[120-122]. The comparison of 1D, 2D and 3D assessment of the response in various solid tumors such as lung nodules, metastatic pulmonary nodules, CRC LM, and metastatic lymph nodes was performed in different trials containing a small number of patients. Some of these trials showed good concordance among 1D, 2D and 3D measurements[104,105,111].Moreover, Hopper et al[104]showed a 23.2% of change in the treatment response category using the 3D volume versus the 2D area methods, and this change was significant. Prasad et al[110]compared these three measurements in patients with LM from breast cancer and found that volumetric measurement produced different results in a considerable proportion of patients. Semiautomated volumetric analysis of lymph node metastases in patients with malignant melanoma was found to be feasible in one study and more reliable than manual measurements in another study evaluating the tumor volume from MRI images in patients with malignant glioma[116,117]. The ORR by volumetric assessment based on brain MRI was used as an approval end point for everolimus in subependymal giant-cell astrocytoma[99,118].Warren et al[109]found less concordance in the minor response and PD categories between 3D and 1D in childhood brain tumors; however, this concordance was high in detecting PR. In a trial compairing manual 1D measurements versus automated volumetry (AV) in patients with pulmonary metastases, the authors concluded that AV allows better reproducibility and should be preferred[114]. Inversely, some other studies did not support the use of 3D measurements in the place of 1D or 2D assessments because 1D evaluation is comparable to 3D methods and simpler for clinical routine use[106-108,113,115,119]. Galanis et al[115]indicated that response assessment by 1D, 2D and computer-assisted volume methods was similar. A recent trial published in 2017 that compares volumetric versus 1D assessment in mCRC showed that 3D assessment is fairly reproducible and similar to 1D measurement[119]. Briefly, the superiority of volumetric response evaluation was not validated until now in large and prospective trials. On the other hand, tumors do not always have a regular contour; they may be spiculated and may contact various structures, such as the pleura, vessels and chest wall, making the assessment of volume difficult[112].

Figure 4 Waterfall, spider (spaghetti) and swimmer plot for 12 hypothetical cases. A: Waterfall; B: Spider (spaghetti); C: Swimmer. Case 8 (blue arrow with cycle) represents pseudoprogression at the 4th week. RR: Response rate; CR: Complete response; PR: Partial response; SD: Stable disease; PD: Progressive disease.
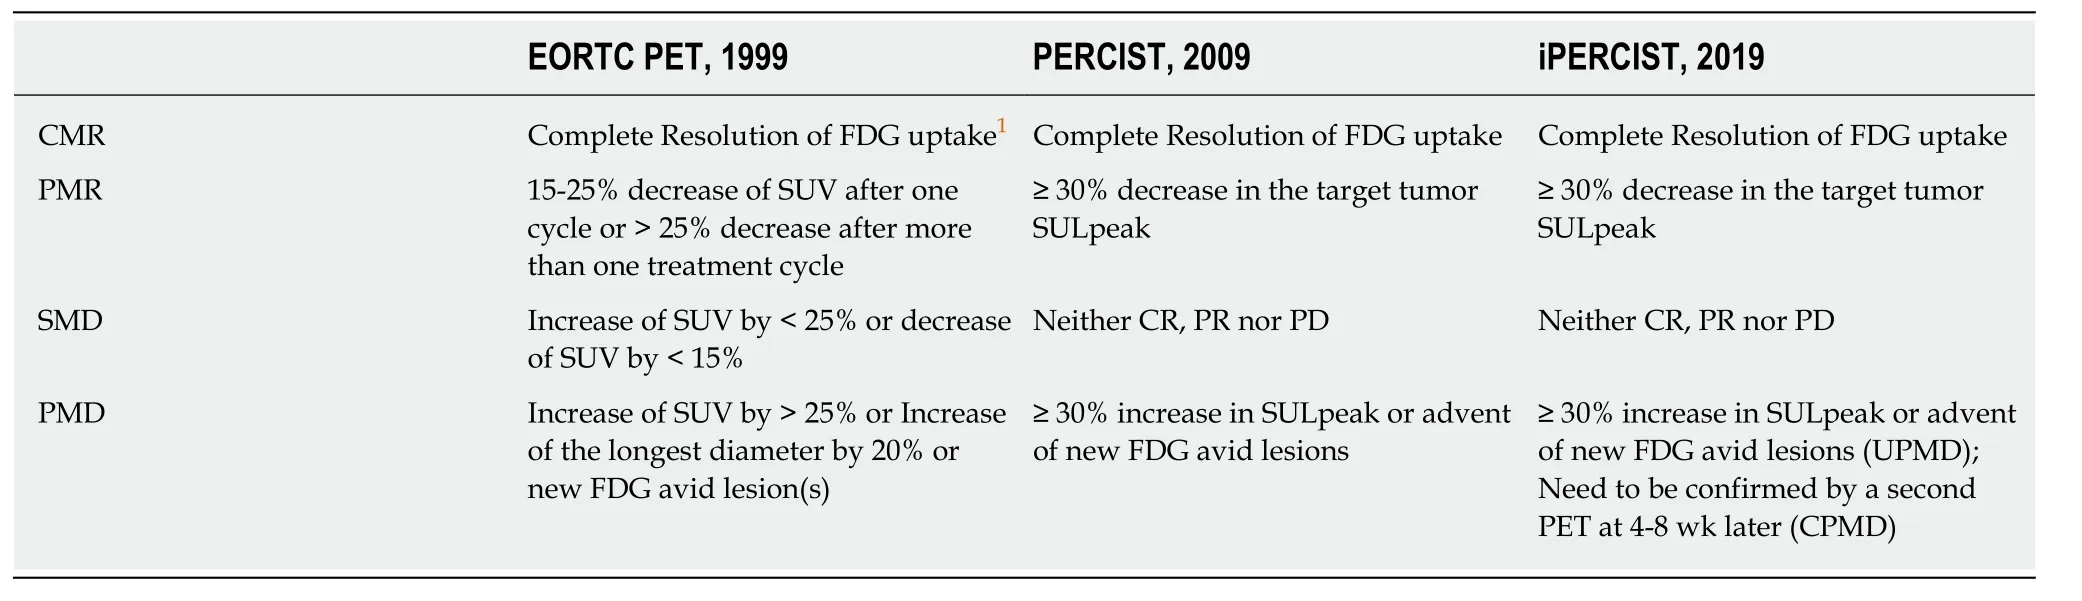
Table 6 Comparison of fluorodeoxyglucose-positron emission tomography response criteria[78,80,81,84]
Imaging quality is the principal issue in radiologic assessments. New imaging techniques, such as diffusion-weighted imaging, dynamic contrast-enhanced MRI and perfusion CT, may add functional information to the morphological evaluation,especially in hepatic and pancreatic tumors[123]. Quantitative multimodality imaging in oncology, such as multiparametric MRI, the PET hybrids (PET-CT, PET-MRI), and new tracers in PET other than FDG (such as radiotracers to image oxygen status,receptor status, and proliferation), may provide a more-comprehensive and more accurate characterization of the tumor phenotype[124]. Importantly, the radiation exposure to patients during diagnosis, staging and response monitoring must be considered. The amount of radiation exposure from an imaging test is shown in Table 9[125]. Hybrid imaging procedures inevitably lead to an increase in patient radiation exposure[126]. MRI has no risk of ionizing radiation.
Finally, radiologic image pattern analyses (radiomics) by computer-aided detection systems and, very recently artificial intelligence algorithms, particularly deep learning, have demonstrated remarkable progress in image-recognition tasks and are expected to identify wide applications in the evaluation of the treatment response and monitoring[127,128].

Table 7 The 5-point scale scores and Deauville criteria in Hodgkin Lymphoma[85-88]
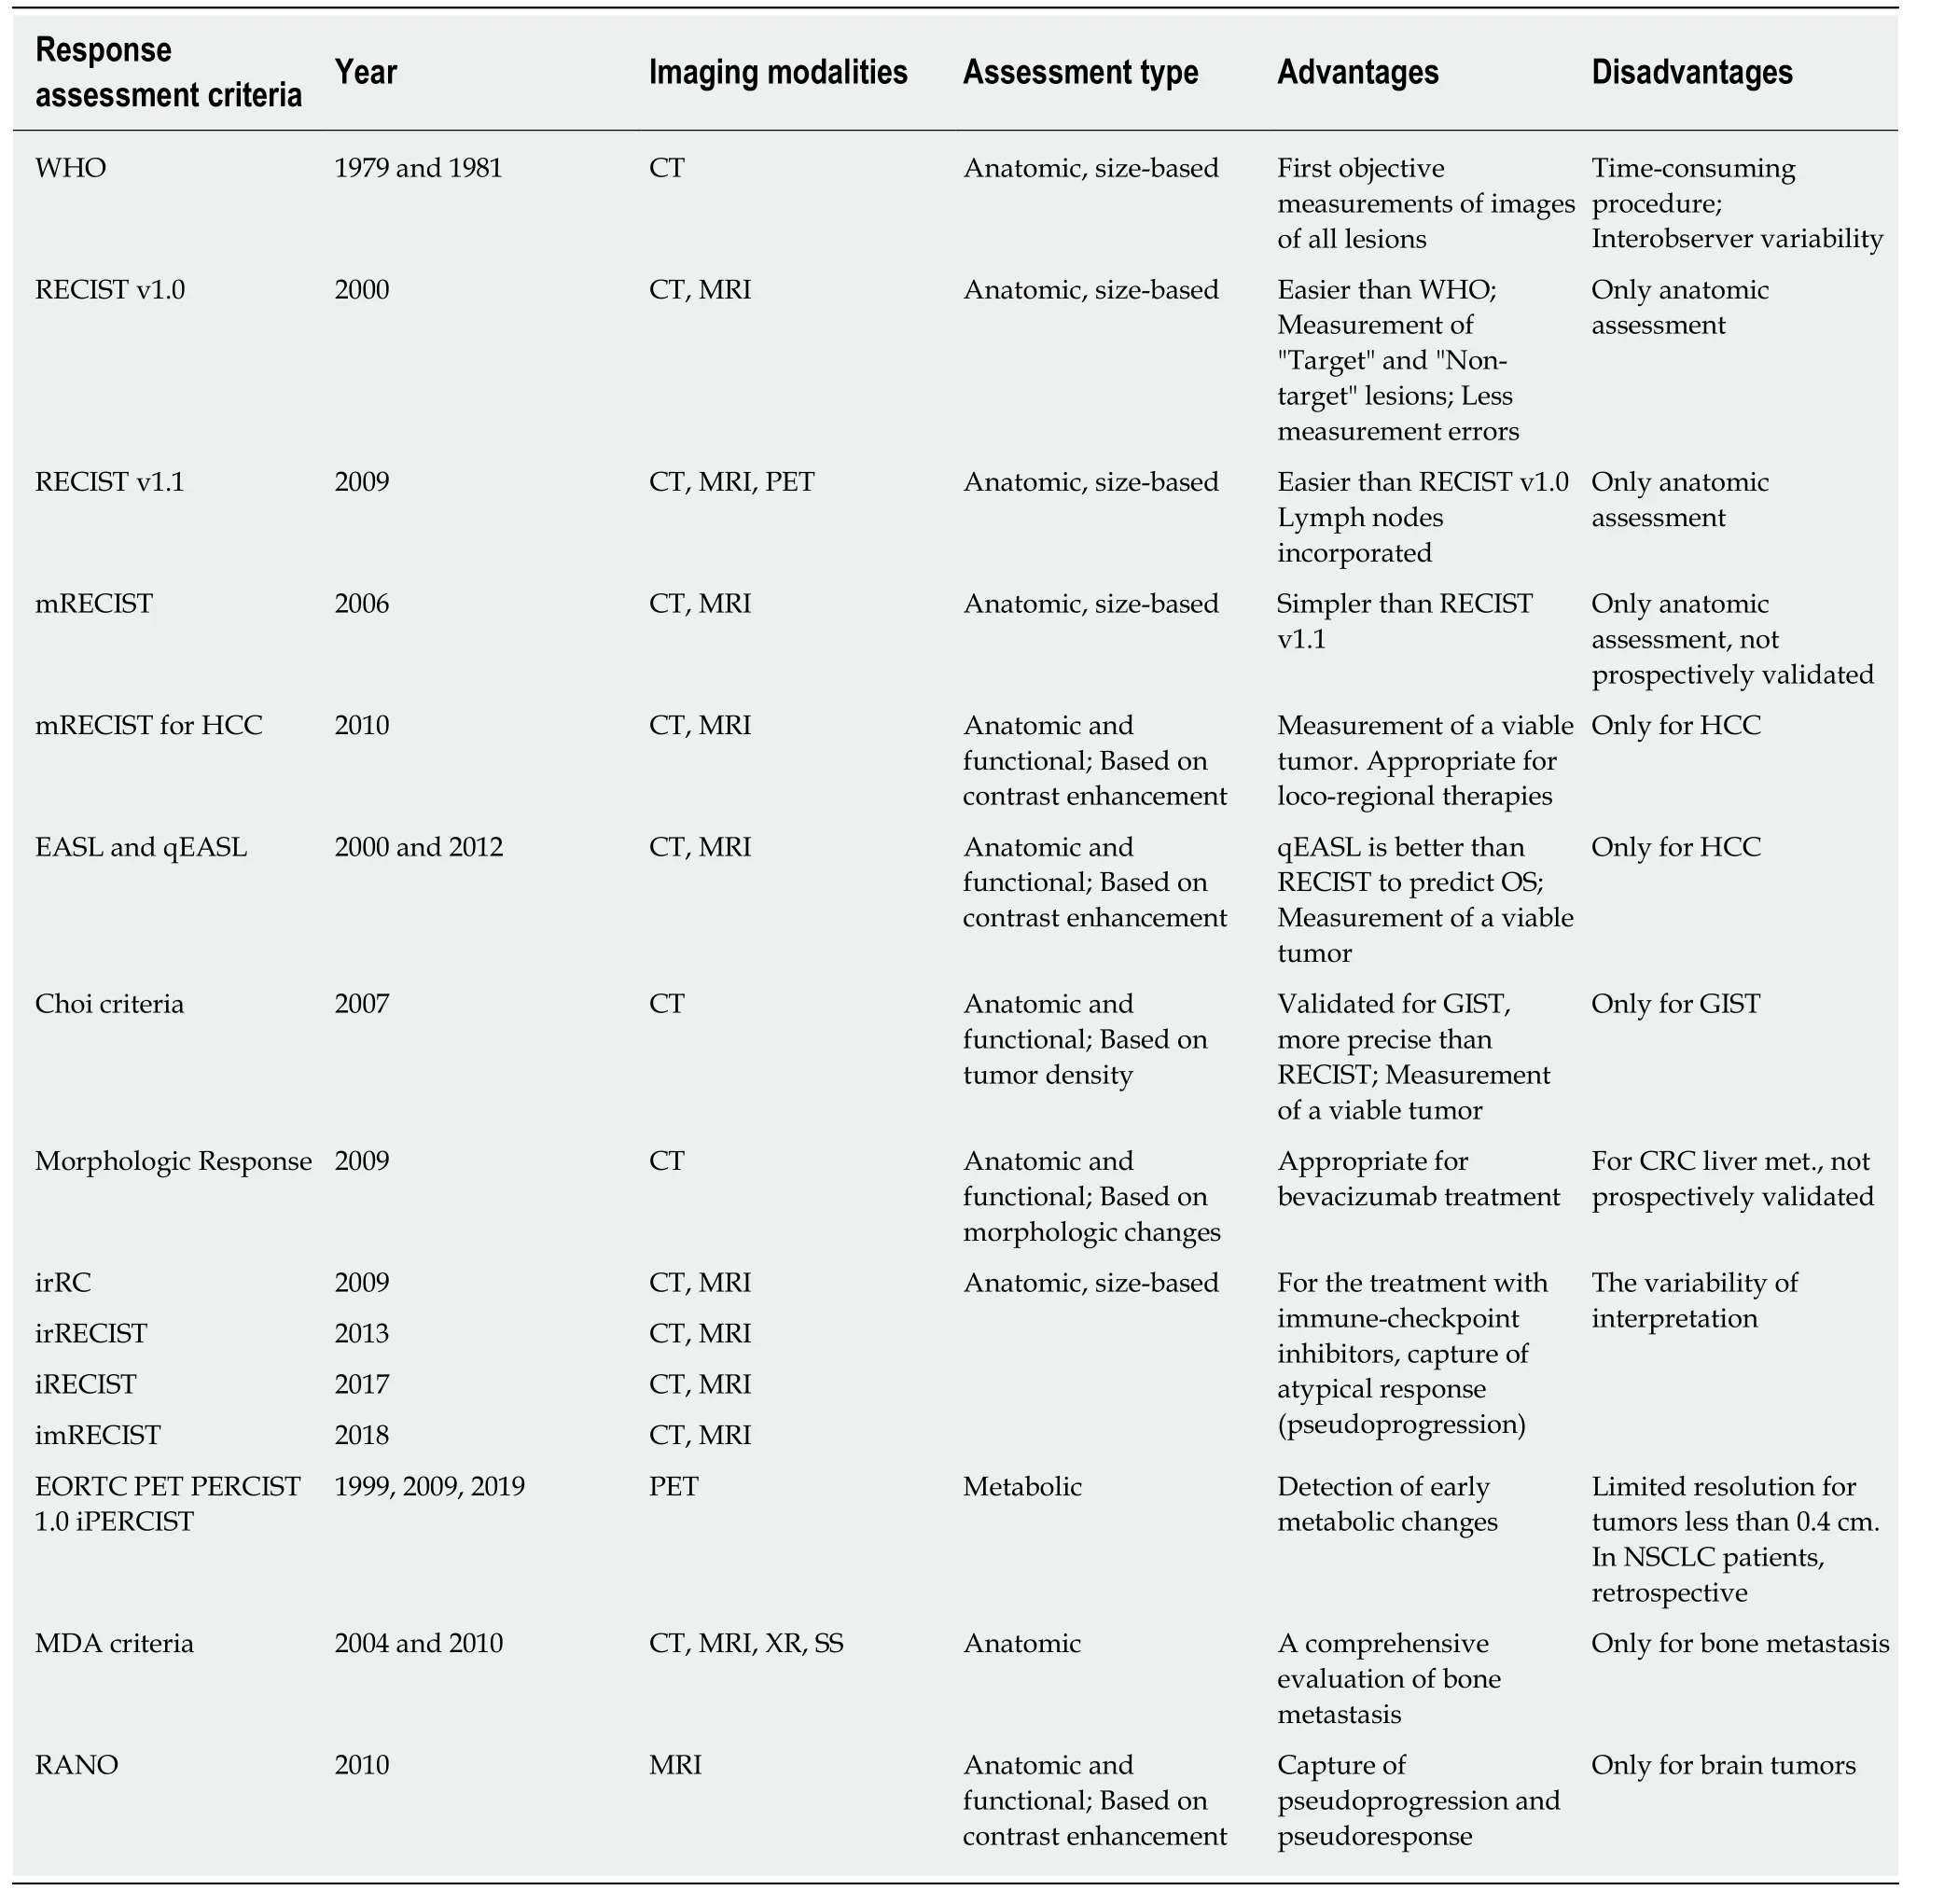
Table 8 Summary of current objective response assessment criteria

Table 9 Radiation dose in adults for some radiology procedures[125]
 World Journal of Clinical Oncology2020年2期
- World Journal of Clinical Oncology的其它文章
- Can epigenetic and inflammatory biomarkers identify clinically aggressive prostate cancer?
- Abdominal metastases of primary extremity soft tissue sarcoma:A systematic review
- Pancreatic adenocarcinoma with early esophageal metastasis:A case report and review of literature
- Pituitary carcinoma: Two case reports and review of literature
- Metastatic clear cell renal cell carcinoma in isolated retroperitoneal lymph node without evidence of primary tumor in kidneys: A caes report