
Quantitative computed tomography analysis for stratifying the severity of Coronavirus Disease 2019
2020-05-10 08:17CongShnNnYuShuoCiJiZhouJixinShngKngLiuHpingZhouYouminGuoGngNiu
Cong Shn , Nn Yu , Shuo Ci , Ji Zhou , Jixin Shng , Kng Liu , Hping Zhou ,Youmin Guo ,*, Gng Niu ,*
a Department of Medical Imaging, The First Affiliated Hospital of Xi'an Jiaotong University, Xi'an, 710061, Shaanxi, China
b Department of Radiology, The Affiliated Hospital of Shaanxi University of Traditional Chinese Medicine, Xianyang, 712000, Shaanxi, China
c Department of Radiology, Xi'an Chest Hospital, Xi'an, 710100, Shaanxi, China
d Department of Radiology, Hanzhong Central Hospital, Hanzhong, 723000, Shaanxi, China
e Department of CT&MR Imaging, Weinan Central Hospital, Weinan, 714000, Shaanxi, China
f Department of Radiology, Ankang Central Hospital, Ankang, 725000, Shaanxi, China
Keywords:
ABSTRACTTo examine the feasibility of using a computer tool for stratifying the severity of Coronavirus Disease 2019 (COVID-19) based on computed tomography (CT) images. We retrospectively examined 44 confirmed COVID-19 cases. All cases were evaluated separately by radiologists (visually)and through an in-house computer software. The degree of lesions was visually scored by the radiologist, as follows, for each of the 5 lung lobes:0,no lesion present;1,<1/3 involvement;2,>1/3 and <2/3 involvement;and 3,>2/3 involvement. Lesion density was assessed based on the proportion of ground-glass opacity (GGO),consolidation and fibrosis of the lesions.The parameters obtained using the computer tool included lung volume(mL),lesion volume(mL),lesion percentage(%),and mean lesion density(HU)of the whole lung,right lung, left lung, and each lobe. The scores obtained by the radiologists and quantitative results generated by the computer software were tested for correlation. A Chi-square test was used to test the consistency of radiologist- and computer-derived lesion percentage in the right/left lung, upper/lower lobe, and each of the 5 lobes. The results showed a strong to moderate correlation between lesion percentage scores obtained by radiologists and the computer software (r ranged from 0.7679 to 0.8373,P <0.05), and a moderate correlation between the proportion of GGO and mean lesion density(r =-0.5894,P <0.05), and proportion of consolidation and mean lesion density (r =0.6282,P <0.05).Computer-aided quantification showed a statistical significant higher lesion percentage for lower lobes than that assessed by the radiologists (χ2 = 8.160, P = 0.004). Our experiments demonstrated that the computer tool could reliably and accurately assess the severity and distribution of pneumonia on CT scans.
1. Introduction
The Coronavirus Disease 2019 (COVID-19) has spread in China[1-3]and in other countries.Radiological examinations,especially thin slice chest computer tomography (CT), have become vital for early diagnosis and the assessment of the disease course[4-6]and have demonstrated excellent performance in visualizing the features of COVID-19.Imaging can reveal the following[5]:(1)number of lesions (often more than three); (2) lesion's size (patchy, large block, nodular, lumpy, etc.); (3) lesion density (ground glass density, paving stones-like change, consolidation, fibrosis, etc.); (4)lesion distribution (sub-pleural or along the bronchial vascular bundles); and (5) other concomitant signs (air-bronchogram, rare pleural effusion and mediastinal lymph node enlargement, etc.).However, it is not easy for a human expert to visually assess the extent of the disease and its progress over time.

Fig.1. Study flowchart.
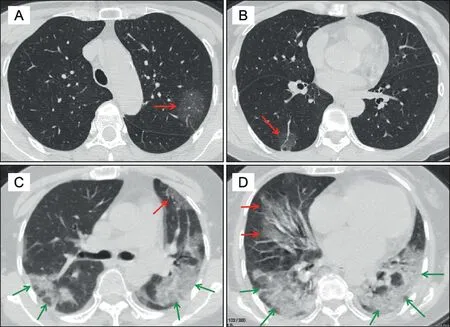
Fig. 2. Examples of severity evaluation by a radiologist.(A,B):Images from a 60-year-old female patient with confirmed COVID-19.A pure GGO lesion can be seen in the left upper lobe(A,red arrow).As the lesion occupied <1/3 of the left upper lobe,the lesion percentage score was 1.Another GGO can be seen in the right lower lobe(B,red arrow);this also had a lesion percentage score of 1.The proportion of GGO,consolidation, and fibrosis were 10, 0, and 0, respectively.(C,D):Images from a 66-year-old female patient with confirmed COVID-19.GGO(C,red arrow;D,red arrow)and bilateral multifocal consolidation were observed(C,green arrow;D, green arrow). The scores of GGO, consolidation, and fibrosis were 3, 7, and 0, respectively.GGO, ground glass opacity.
An efficient and accurate assessment method is urgently needed due to the rapid increase in computed tomography (CT) examinations and the need for accurate assessment or staging of COVID-19 pneumonia [7,8]. Based on the number of lung lobes involved (5 lobes,score 1-5 for each lobe,total range:0[none]to 25),a recent study that focused on the dynamic changes in COVID-19 pneumonia [9] showed that lung tissue involvement peaked at approximately 10 days from the onset of symptoms. Owing to the rapid increase in the number of patients, repeated examinations,and the rapid progress of this disease, efficient and accurate assessment is warranted. Hence, it is necessary to develop novel solutions to improve diagnosis performance and efficiency.
In this study, we validated the performance of a newly developed computer tool that aims to quantitatively assess COVID-19 pneumonia using CT images by comparing the results obtained by radiologists and the computer tool.
2. Materials and methods
2.1. Patients
In this study, initial CT images from 44 patients with COVID-19 confirmed between January 22, 2020 and February 7, 2020 were reviewed retrospectively. Diagnostic criteria for COVID-19 were based on the diagnosis and treatment protocols from the National Health Commission of the People's Republic of China[10]. The confirmed cases met the following criteria: (1) history of travel to Wuhan and its circumjacent area or other communities with confirmed COVID-19 cases within the past 14 days;(2) contact with others with confirmed COVID-19 (positive result on nucleic acid testing) within the past 14 days; (3) contact with someone from Wuhan and its circumjacent area or other communities wherein fever or respiratory symptoms have been reported within the past 14 days; or (4) onset of symptoms after involvement in a public gathering. Patients with severe respiratory dyspnea (respiratory rate >30 breaths/min), low SpO2(<93%)at rest,and PaO2/FiO2 ≤300 mmHg who required oxygen treatment or mechanical ventilation were defined to have severe disease.
All CT images were assessed by a radiologist and processed with the in-house computer software. The percentage of lesion to lung volume,lesion density,and lesion distribution were evaluated and compared (Fig.1).
The study was approved by the institutional board of each participating center.

Fig. 3. Illustration of lesion identification.The first step was the segmentation of the bilateral lung, and the results are displayed a three-dimensional model (shown in A,the right lung is colored green and the left lung is colored blue).The second step was the segmentation of pulmonary vessels(shown in B,the vessels are colored blue).After the subtraction of the pulmonary vessels from the lung regions,the fourth and final step was the segmentation of pneumonia lesions(shown in C).The red irregular nodular shapes were observed as a result of this lesion segmentation.

Fig. 4. Illustration of lesion segmentation by the computer software.(A,B,C):Images from a 60 year-old female patient with early stage COVID-19.Multifocal pure ground glass opacity(GGO)can be seen in the bilateral lung(A,red arrows).All GGO lesions were segmented, as shown on the same coronal view (B, within red line). All lesions (C, red nodular) can be seen on the three-dimensional reconstruction view.(D,E,F):Images from a 40-year-old female patient in the progressing stage of COVID-19.Multifocal GGOs(D,red arrows),patchy consolidation(D,green arrow),and fibrosis(D,blue arrows) can be observed. All lesions were segmented, as shown on the same coronal view (E, within red line). F represents the three-dimensional reconstruction of the lesion.(G,H,I):Images from a 50-year-old male patient in the severe stage of COVID-19.Diffused GGO(G,red arrows)and consolidation(G,green arrow)can be seen in the bilateral lungs.All lesions were segmented, as shown on the same coronal view (H, red color). I represent the three-dimensional reconstruction of the lesion.

Table 1General characteristics and comparison of quantitative CT parameters between nonsevere and severe patient groups.
2.2. Acquisition of CT images
CT images were collected using multi-detector CT (MX 16,Phillips, Cleveland, Netherlands; BrightSpeed, Siemens, Erlangen,Germany; SOMATOM Perspective, Siemens, Erlangen, Germany;Optima CT680 Series, GE MEDICAL SYSTEMS, America; Aquilion,TOSHIBA, Japan; Emotion 16, Siemens, Erlangen, Germany). All patients were scanned in the supine position with their breath held at the end of inspiration.The field of view was set from the apex to the base of the lungs.The tube voltage and the current were 120 kV and 30-140 mA, respectively. All data were reconstructed using a standard reconstruction kernel. The reconstruction matrix was 512 × 512, and the slice thickness of reconstructed sections was between 0.625 mm and 1 mm. Images were viewed at window settings optimized for the assessment of the lung parenchyma(width 1500 HU; level-500 HU).
2.3. Severity evaluation
The severity of pneumonia was evaluated by radiologists and the computer tool separately. The evaluation of the indices of COVID-19 included the degree of lesions,mean lesion density,and the distribution of the lesions.
2.3.1. Severity evaluation by radiologist
As described by Pan et al.[9]the percentage of lesion to lung size was evaluated in particular lobes. This study extended beyond previously described methods[9]by visually scoring each of the 5 lobes(i.e.,right upper lobe,right middle lobe,right lower lobe,left upper lobe and left lower lobe)on a scale of 0-3(0:no lesion,1:<1/3 of the lobe volume involved,2:>1/3 and <2/3 of the lobe volume involved, 3: >2/3 of the lobe volume involved). This was done to decrease inter-observer inconsistency. The total CT score for each case was the sum of the score for the 5 lobes, with a maximum possible score of 5×3=15.Two examples of CT scoring are shown in Fig. 2. The radiologist-defined lesion percentages of the whole lung, right upper lobe, right middle lobe, right lower lobe, left upper lobe, and left lower lobe were recorded as RLPWL, RLPRUL,RLPRML, RLPRLL, RLPLUL, and RLPLLL, respectively.
The evaluation of lesion density manually was based on the proportion of three major CT signs, that is, ground glass opacity(GGO),consolidation,and fibrosis,which were judged according to the international standard nomenclature defined by the Fleischner Society glossary [11] and peer-reviewed literature on viral pneumonia [8,12]. The composition of each CT sign was evaluated on a scale of 0-10, with a sum score of 10. The proportion of GGO,consolidation, and fibrosis was recorded as PGGO, Pconsolidation, and Pfibrosis, respectively.
Two radiologists with more than 5 years of thoracic-imaging analysis experience evaluated the severity of images in a double blind manner.Any disagreement between the two radiologists was resolved by another, more experienced, radiologist.
2.3.2. Computerized quantification of lesions
A computerized quantitative approach was used to evaluate the severity of COVID-19.The scheme consisted of four primary phases:(1) segmentation of the lung [13,14] and 5 lobes [15]; (2) segmentation of the pulmonary vessels [16,17]; (3) subtraction of pulmonary vessels from the lung region; and (4) the detection of pneumonia (Fig. 3). The details of the last two steps have been presented elsewhere.
The lesion region was segmented based on thresholds and adaptive region growing [18]. The results of segmentation were reviewed by a radiologist with more than 10 years' experience.False positives were deleted, and false negatives were added manually.The computerized parameters included the lung volume(mL), lesion volume (mL), the ratio of lesion volume to that of the corresponding lung or lobes (%), and mean lesion density (HU) of the whole lung, right lung, left lung, and each of the 5 lobes. The segmentation and three-dimensional reconstruction of COVID-19 lesions at the early stage, the progressing stage and the severe stage are shown in Fig. 4.
2.4. Statistical analysis
Statistical analyses were performed using IBM SPSS Statistics Software(version21;IBM,New York,USA).Discrete variables were presented as the number of cases unless otherwise specified.Continuous data were presented as mean ± standard deviation(minimum-maximum). The independentt-test was used for the comparison of patients with and without severe disease. Correlations between the radiologist-defined CT score of lesion percentage and lesion percentage quantified using the computer tool, and between the radiologist-defined GGO/consolidation proportion and mean lesion density quantified using the computer tool were evaluated by Pearson correlation.Strong correlation was defined asr>0.8, moderate correlation asr<0.8 and >0.5, and mild correlation asr<0.5.A Chi-square test was used to test the consistency of lesion distribution results obtained by the radiologists and the computer software. AP-value of <0.05 was defined as statistically significant for all results.

Fig. 5. Correlation of lesion percentage derived by radiologists and the computer software.The scatter diagram (A-H, plotted with red reversed triangles) shows the correlation between lesion percentages assessed by the radiologist and the computer software for the whole lung (A), right lung (B), left lung (C), right upper lobe (D), right middle lobe (E), right lower lobe (F), left upper lobe (G), and left lower lobe (H).WL, whole lung; RL, right lung; LL, left lung; RUL, right upper lobe; RML, right middle lobe; LUL, left upper lobe; LLL, left lower lobe.RLP, radiologist-assessed lesion percentage; CLP, computer-assessed lesion percentage.

Fig.6. Correlation of lesion density derived by radiologists and the computer software.The scatter diagram (A-B, plotted with red filled circles) shows a moderate negative correlation between the proportion of GGO and mean lesion density(shown in A),and a moderate positive correlation between the proportion of consolidation and mean lesion density (shown in B).PGGO, proportion of ground glass opacity to the overall lesion;Pconsolidation, proportion of consolidation to the overall lesion.
3. Results
3.1. General lung characteristics of the enrolled patients
We examined a total of 44 patients (21 male and 23 female) in the study (Table 1). The CT scores for the whole lung and each individual lobe were significantly larger in those with severe disease than in those without severe disease (P<0.05). The lung volume quantified using the computer tool was significantly lower in those with severe disease than in those without severe disease(P<0.05)for the whole lung, right lung, and right lower lobe. The lesion volume quantified using the computer tool was significantly larger in the group with severe disease(P<0.05). The lesion volume to lung/lobe volume percentage (%) quantified using the computer tool was significantly higher in the group with severe disease(P<0.05);however,this did not hold true for the right middle lobe.
3.2. Correlation between CT scores and parameters quantified using the computer tool
The Pearson correlation analyses showed a moderate to strong correlation between lesion percentage determined by radiologists and the computer software (rranged from 0.7679 to 0.8373, allP<0.05) (Fig. 5). A moderate negative correlation was observed between the proportion of GGO and mean lesion density(r= -0.5894,P<0.05), and a moderate positive correlation was observed between the proportion of consolidation and mean lesion density (r= 0.6282,P<0.05) (Fig. 6).

Table 2The lesion distribution of right/left lung observed by radiologist and obtained using computer tool.

Table 3The lesion distribution of upper/lower lobes observed by radiologist and obtained using the computer tool.
3.3. Distribution of lesions determined by the radiologist and computer tool
The distribution of lesions in the right and left side of the lungs observed by the radiologists was similar to that obtained using the computer software(Table 2,χ2=0.988,df=1,P=0.320).However,the distribution of lower lobe lesions obtained through computeraided quantification significantly differed from the results obtained by radiologists (Table 3, χ2= 8.160, df = 1,P= 0.004). The distribution of lesions among the five lobes observed by the radiologists was similar to that obtained through computer-aided quantification (Table 4, χ2= 8.423, df = 4,P= 0.077). The distribution of lesions was the highest in the right lower lobe, followed by the left lower lobe, left upper lobe, right upper lobe, and right middle lobe.
4. Discussion

Table 4The lesion distribution among five lobes observed by radiologist and obtained using computer tool.
In this study,a quantitative CT analysis for stratifying COVID-19 cases by severity was established.The CT scores for the whole lung and each individual lung lobe were significantly higher in severe cases than in non-severe cases.The lung volume of the whole lung,right lung,and the right lower lobe quantified using the computer tool was significantly lower in severe cases than in non-severe cases and the lesion volume quantified using the computer tool was also significantly higher in the severe group.The percentage of the lesion volume to the corresponding lung or lobe volume quantified using the computer tool was significantly higher in the severe group,although this was not true for the right middle lobe.Our results showed a strong or moderate correlation between the lesion percentage obtained by radiologists and the computer software, a negative correlation between the proportion of GGO and mean lesion density, and a moderate positive correlation between the proportion of consolidation and mean lesion density.
The results showed that as pneumonia progresses, the functional lung volume decreases. This was likely caused by the swelling of infected lung tissue and filling of alveoli with exudate,leading to a partial loss of lung function [19]. Because of this, the lesion percentage may be an important biomarker to examine in future studies.
A recent study on viral pneumonia [20] showed that the interobserver reliability of CT scans was poor to slight when determining the presence of intra-lobular reticulation, distribution of consolidation,and GGO. In this study, the lesions were segmented by a computer tool using a standard algorithm, and only a small part of lesion analysis (false positives and false negatives) was performed by a radiologist.This method made it much easier for us to assess the lesions. CT signs, GGO, consolidation, and fibrosis manifest differently over the course of the disease [21] and have different density ranges. This study shows that the proportion of consolidation increases with mean lesion density, and the proportion of GGOs, decreases with mean lesion density.
However, the distribution of lower lobe lesions obtained by computer-aided quantification significantly differed from radiologist-derived results(χ2=8.160,df=1,P=0.004).This could be due to the smaller volume and weight of the upper lobes than of the lower lobes and may have resulted in the under-or overestimation of the volume of lesions in the bilateral lower or upper lobes,respectively.The lesion distribution in the right and left side of the lungs obtained by the radiologist and computer software showed no significant difference,nor did the distribution of lesions among the five lobes.The severity of the involvement in the 5 lobes was similar to that reported in a recent study [9], which showed that the most commonly involved lung segments,in order,were the dorsal segment of the right lower lobe,the posterior basal segment of the right lower lobe,the lateral basal segment of the right lower lobe, the dorsal segment of the left lower lobe, and the posterior basal segment of the left lower lobe.
The limitations of this study included the retrospective nature of the study, selection bias (a lack of severeCOVID-19 cases), small sample size,and evaluation bias in the radiologist-defined CT score.In the future, examining the correlation between quantitative CT parameters and clinical symptoms and laboratory indices would be useful for guiding clinical decision-making.
In summary,computer-aided quantification is an accurate,easy,and feasible way to stratify COVID-2019 cases according to severity.
Conflicts of interest
The authors declare that there are no conflicts of interest.
Acknowledgments
The authors would like to express their gratitude to all emergency services, nurses, doctors, and other hospital staff for their efforts to combat the COVID-19 outbreak.The authors would like to express their thanks to the funders, and this study was supported by the Science and Technology Project of Shaanxi Province (No.2018SF-264), The National Natural Science Foundation of China(81701691), Natural and Science Foundation of Shaanxi Province(2019JM-361).
 Journal of Pharmaceutical Analysis2020年2期
- Journal of Pharmaceutical Analysis的其它文章
- Recent advances and perspectives of nucleic acid detection for coronavirus
- Molecular immune pathogenesis and diagnosis of COVID-19
- Hollow fiber-based liquid phase microextraction followed by analytical instrumental techniques for quantitative analysis of heavy metal ions and pharmaceuticals
- Erucic acid from Isatis indigotica Fort. suppresses influenza A virus replication and inflammation in vitro and in vivo through modulation of NF-κB and p38 MAPK pathway
- Metabolic profiling of four synthetic stimulants, including the novel indanyl-cathinone 5-PPDi, after human hepatocyte incubation
- Analysis of TRPA1 antagonist, A-967079, in plasma using highperformance liquid chromatography tandem mass-spectrometry