
Analysis of TRPA1 antagonist, A-967079, in plasma using highperformance liquid chromatography tandem mass-spectrometry
2020-05-10 08:17OedGymfiNestBorteySmAigilDonkorCrlWhiteBrinLogueDeprtmentofChemistryndBiochemistrySouthDkotStteUniversityBox2202BrookingsSD57007USA
Oed A. Gymfi , Nest Bortey-Sm , Aigil B. Donkor , Crl W. White ,Brin A. Logue ,* Deprtment of Chemistry nd Biochemistry, South Dkot Stte University, Box 2202, Brookings, SD, 57007, USA
b Pediatrics-Pulmonary Medicine, University of Colorado-Denver, Denver, CO, 80045, USA
Keywords:
ABSTRACTThe noxious effects from exposure to toxic inhalation hazards (TIHs, such as isocyanates, chlorine, etc.)are known to be triggered by the activation of transient receptor potential ankyrin 1(TRPA1)ion channel.Antagonists of TRPA1 have shown near complete attenuation of the noxious effects from TIH exposure.One of the TRPA1 antagonists,(1E,3E)-1-(4-fluorophenyl)-2-methyl-1-pentene-3-one oxime(A-967079),has shown impressive efficacy, high selectivity, high potency, and oral bioavailability. Although a validated method to quantify A-967079 in biological matrices is vital for the further development of A-967079 as a therapeutic agent,no method for its analysis from any matrix is currently available.Hence,a rapid and simple HPLC-MS/MS method was developed and validated to quantify A-967079 in rabbit plasma. The method presented here features an excellent LOD of 25 nM and a wide linear range (0.05-200 μM), with good accuracy and precision (100 ± 10.5% and <14.2% relative standard deviation,respectively). The stability of A-967079 in plasma was excellent for most of the storage conditions evaluated.The method was successfully applied to determine A-967079 from treated animals and it may facilitate the development of this TRPA1 antagonist as a therapeutic agent against the noxious effects of TIH exposure.
1. Introduction
Toxic inhalation hazards (TIHs) are noxious gases and vapors(e.g., methyl isocyanate (MIC), chlorine, chloroacetophenone,chloropicrin,etc.)that are harmful,and often deadly,when inhaled[1-5].However,because of their low cost and ease of manufacture,along with their high toxicity and relatively short half-life,they are used for many purposes, including fumigation, fungicide, disinfection,pest control,and cleaning.Many TIHs are also important for metallurgy, plastics, pharmaceuticals, and semiconductors [1,6,7].Therefore,industrial demands for TIHs,and their transport through highly populated areas, significantly increase the risk of exposure[8,9]. The potential use of TIHs by terrorists to injure and kill civilians is also a concern[2,10-12].The risk of TIH exposure is most infamously illustrated by the tragic accident in Bhopal,India(1984),where more than 8000 people died within a few minutes of MIC exposure [13,14].
Many TIHs are detected by olfactory neurons and peripheral sensory neurons by activating transient receptor potential (TRP)cation channels [15-17], and acid-sensitive ion channels (ASICs)[18,19]. The activation of these channels, following TIH exposure,triggers signaling to the brain, which leads to immediate unbearable irritation of the eye, nose, and throat, and induces sneezing,coughing, mucus secretion, upper airway inflammation, and tearing [4,18,20,21]. At prolonged or high-dose exposure, these responses progress to severe pain, intense coughing, profuse flow of tears,and resistance to airflow by bronchospasm,mucus hypersecretion, and pneumonitis [1,22,23]. TRP ankyrin 1 (TRPA1), a member of the TRP ion channel family expressed on nociceptive primary afferent C-fibers, is a main receptor for the noxious effect response of TIH exposure and is activated by about 40%of all TIHs,including all oxidizing and electrophilic TIHs (e.g., tear gas agents and MIC)[1,4,21,23].The importance of TRPA1 in TIH response has been shown experimentally with both TRPA1-knockout (Trpa1-/-) mice and TRPA1 antagonist-treated mice, showing complete cessation of the noxious effects of TIHs [23-27].
To date, very few TRPA1 antagonists have entered pre-clinical trials. The major setbacks of this therapeutic strategy is a lack of potency, selectivity, and bioavailability [28,29]. For example, AP18(4-(4-Chlorophenyl)-3-methyl-3-buten-2-one oxime, Fig. 1) is potent and selective for TRPA1 over other TRP ion channels[29-31], but shows poor bioavailability following intraperitoneal and oral administration. Similarly, HC-030031 (2-(1,3-Dimethyl-2,6-dioxo-1,2,3,6-tetrahydro-7H-purin-7-yl)-N-(4-
isopropylphenyl)acetamide, Fig.1) is also selective for TRPA1 over other TRP channels,but it has been reported to also inhibit several non-TRP pain signaling proteins [27,32].
The limitations of TRPA1 antagonist compounds have necessitated the continued search for more efficacious antagonists.Recently, (1E,3E)-1-(4-Fluorophenyl)-2-methyl-1-pentene-3-one oxime (A-967079, Fig. 1) has shown impressive efficacy as an antagonist to TRPA1 and has multiple advantages over other compounds,including high selectivity,potency,and oral bioavailability[26,33].A-967079 has IC50values of 67 and 289 nM for human and rat TRPA1 receptors, respectively. It displays 1000-fold selectivity for TRPA1 over other TRP channels, and >150-fold selectivity for over 75 other ion channels, enzymes and G-protein-coupled receptors [26,33-35]. Oral administration of A-967079 in rats produced robust bioavailability and analgesic efficacy for TIH-induced pain response (i.e., sneezing, tearing, coughing, etc.) and osteoarthritic pain[33,35].Intravenous injection of A-967079 has shown to decrease the reactive gas response of wide dynamic range neurons(i.e.,a second-order neuron that responds to more than one type of stimulus)and pain specific-neurons[26,35].Aditionally,A-967079 produces no known locomotor or cardiovascular effects,a common side effect of other TRP antagonists.
In spite of the potential advantages of A-967079, there is no currently available validated analytical method for its quantification. Therefore, the objective of this study was to develop and validate a high-performance liquid chromatography tandem mass spectrometry (HPLC-MS/MS) method for the analysis of A-967079 in plasma,which can be used in further development of A-967079 as a countermeasure for TIH exposure.
2. Materials and methods
2.1. Materials
All reagents and solvents were of at least HPLC grade, unless otherwise specified. Ammonium formate was obtained from Sigma-Aldrich(St.Louis,MO,USA).Acetone,ethanol,and methanol(LC-MS grade) were purchased from Fisher Scientific (Hanover-Park, IL, USA). A-967079 (>98% purity), supplied by Dr. Carl W.White (Pediatrics-Pulmonary Medicine, University of Colorado-Denver, Denver, CO, USA), was purchased from Med Chem 101(Plymouth Meeting,PA,USA;98%purity;Lot X101075).A polymeric reversed phase column, PLRP-S 300 Å (50 mm × 2.1 mm, 3.0 μm,part #:PL1912-1301) was purchased from Agilent (Santa Clara, CA 95051). Water was purified to 18.2 MΩ·cm using a Lab Pro polishing unit from Labconco (Kansas City, KS, USA). A-967079 was dissolved in ethanol:water (1:1,v/v) to make a stock solution of 10 mM concentration,which was further diluted to 5 mM in mobile phase A(pH~4),and stored at 4°C.The stock solution of A-967079(5 mM, in mobile phase A) was further diluted to 0.025-500 μM with either mobile phase A or plasma to produce working standard solutions.
2.2. Biological samples
For analytical method development and validation, rabbit plasma (non-sterile with EDTA) was purchased from Pel-Freeze Biologicals and was stored at -80°C until used. Rabbit plasma was used to develop the method presented here because we planned to utilize a rabbit model developed by our collaborators to prove the applicability of the analytical method for the analysis of A-967079 plasma concentrations. However, at the time we were finalizing the method validation,efficacy studies of A-967079 were transitioned to a rat model.Plasma samples from A-967079-treated male Sprague-Dawley rats were obtained from the Pediatrics-Pulmonary Medicine, University of Colorado-Denver, Denver, CO,USA.Rats(250-350 g)were separated into eight groups(n=3 for each group) and each group was intraperitoneally administered 100 mg/kg A-967079 in 5%DMSO/sesame oil.Animals from groups 1-8 were euthanized at 0.25, 0.5, 1, 1.5, 2, 4, 8, and 24 h posttreatment, respectively, and blood was collected. Another group(n=3)was euthanized without A-967079 treatment and blood was collected as a control (blank). Collected blood was placed in clean plastic tubes with EDTA anti-coagulant and centrifuged to separate the plasma from erythrocytes. Plasma was then transferred to a clean centrifuge tube, flash frozen, and shipped on dry ice (overnight) to South Dakota State University. Upon receipt, the plasma was stored at -80°C until analysis was performed. All animals were cared for in compliance with the “Principles of Laboratory Animal Care''formulated by National Society for Medical Research and the “Guide for the Care and Use of Laboratory Animals” prepared by the National Institutes of Health. The University of Colorado-Denver and Institutional Animal Care and Use Committee(IACUC) approved the animal study.
2.3. Sample preparation for HPLC-MS/MS analysis

Fig.1. Chemical structures of TRPA1 antagonists with their respective identification.
Plasma (100 μL) was added to a 2 mL centrifuge tube. Acetone(300 μL) was added to the plasma to precipitate proteins. The sample was vortexed for about 3 min, and then cold centrifuged(8°C) at 10,000 rpm (12,300×g) for 5 min. An aliquot (300 μL) of the supernatant was transferred into a 4 mL glass screw-top vial and evaporated to dryness (at room temperature) using nitrogen.The contents of the glass vial were then reconstituted with 100 μL of 0.1% ammonium formate in water (pH ~4). The solution was thoroughly mixed,filtered using a 0.22 μm tetrafluoropolyethylene membrane syringe filter, and transferred into an HPLC vial with glass insert (100 μL) for analysis.
2.4. HPLC-MS/MS analysis
Liquid chromatography was performed on a Shimadzu HPLC(LC-20AD, Shimadzu Corp., Kyoto, Japan). The chromatographic separation was performed on an Agilent polymeric reversed phase column, PLRP-S 300 Å (50 mm × 2.1 mm, 3.0 μm) protected by a guard cartridge with column temperature maintained at 40°C.Mobile phase A was 0.1%ammonium formate in water and mobile phase B was 0.1%ammonium formate in methanol,both with a pH of 4.The chromatographic separation was achieved using gradient elution at a flow rate of 0.35 mL/min as 20%B was held constant for 2 min,increased linearly to 100%over another 2 min,held constant for 2 min, decreased to 20% B over 2 min, and held constant for 2 min to equilibrate between injections. A volume of 10 μL was injected for HPLC-MS/MS analysis.
A tandem mass spectrometer (AB Sciex Q-Trap 5500 MS)equipped with an electrospray ionization interface operating in the positive polarity was used to detect the A-967079. The mass spectrometric conditions were optimized by directly infusing A-967079 standard solution into mass spectrometer at a flow rate of 10 μL/min where A-967079 (m/z = 207), as an oxime, undergoes Beckmann rearrangement under acidic conditions to gain two protons to form its precursor A-967079 (m/z = 209) [36-38]. Nitrogen (50 psi) was used as both the curtain and nebulization gas.The ion spray voltage and source temperature were 4,500 V and 500°C,respectively,with both nebulizer(GS1)and heater(GS2)gas pressures at 90 psi.The collision cell was operated with an entrance potential of 10.0 V and a collision cell exit potential of 11.0 V at a medium collision gas flow rate.A-967079 was analyzed in multiple reaction monitoring mode (MRM) and chromatograms were acquired and analyzed with the Analyst software program. The MS/MS operating parameters and MRM transitions are listed in Table 1.
2.5. Calibration, quantification, and limit of detection
The developed analytical method was validated using the Food and Drug Administration (FDA) bioanalytical method validation guidelines [39,40]. To determine the limit of detection (LOD),multiple concentrations of A-967079 were prepared in plasma and analyzed by HPLC-MS/MS. The LOD was defined as the lowest concentration of A-967079 that reproducibly produced a signal-tonoise(S/N)of 3.The noise was determined as peak-to-peak noise in the blank samples over the elution time of A-967079.
For the calibrators,a working standard of A-967079(1 mM)was prepared in rabbit plasma. From the working solution, calibration standards of A-967079 with concentration range of 0.025-500 μM(0.025,0.05,0.1,0.2,0.3,0.5,1,3,5,10,30,50,100,200 and 500 μM)were prepared in rabbit plasma. All calibration standards were analyzed in triplicate. The average peak areas were plotted as a function of A-967079 concentration. Both non-weighted and weighted(1/x and 1/x2)calibration curves were constructed using linear least squares. The linearity, accuracy, and precision of the calibration standards were used to determine the best model for quantification.
The lower limit of quantification (LLOQ) and upper limit of quantification (ULOQ) were defined as satisfying the inclusion criteria of <15% relative standard deviation (RSD, as a measure of precision), and a percent error (as a measure of accuracy) of 100 ± 20% back-calculated from the nominal concentration for all calibration standards within the linear range.The goodness-of-fit of the calibration curves was determined using percent residual accuracy (PRA) (i.e., PRA values ≥90% are indicative of a good fit)[41,42].
The accuracy and precision of the method were evaluated by analyzing three different quality control (QC) standards, i.e., 2 μM(low QC),20 μM(medium QC),and 60 μM(high QC),not included in the calibration curve. QCs were analyzed in quintuplicate over three days (within 7 calendar days). Intraassay precision and accuracy were calculated for each individual day, and interassay precision and accuracy were calculated from comparison of the data gathered over three separate days.

Table 1MRM transitions, optimized collision energies (CEs), and declustering potentials(DPs) for the detecting of A-967079 by MS/MS analysis.
2.6. Recovery, matrix effect and stability
The assay recovery (i.e., signal recovery) of A-967079 was determined by the analysis of low,medium and high QC standards from spiked plasma as a ratio of the same concentration of QCs spiked in aqueous solution. Spiked plasma was prepared and analyzed by the method described. Spiked aqueous solutions(100 μL) of the appropriate concentration corresponding to the amount of A-967079 representing 100% recovery were dried,reconstituted in mobile phase A, and analyzed via HPLC-MS/MS.The peak area of the spiked plasma was then divided by the peak area of the spiked aqueous solution for each QC concentration and multiplied by 100% to quantify the recovery.
The matrix effect was determined by creating calibration curves in both aqueous and plasma matrices and comparing their slopes.A slope ratio (plasma slope/aqueous slope) from the calibration curves greater than one indicates enhancement of the analyte in plasma,whereas slope ratio less than one indicates suppression of the analyte signal by plasma matrix.
The short- and long-term storage stability of A-967079 was evaluated by analyzing plasma spiked with high and low QC concentrations stored at different temperatures at multiple storage times. The stability (i.e., signal stability) of A-967079 was determined as a percentage of the initial signal. A-967079 was considered stable in plasma at a specific temperature if the signal was within 15%of the initial signal.Short-term stability of the QCs was assessed for 24 h both in the autosampler (at 15°C) and on the benchtop (at room temperature). Freeze-thaw stability was evaluated over three freeze-thaw cycles where four different sets of both low and high QCs were prepared.One set of both QCs was analyzed in triplicate on the same day, while the other sets were stored at-80°C.One set of the thawed QCs was analyzed in triplicate as first cycle. The remaining two sets of QCs were again stored at-80°C.This procedure was repeated twice more to evaluate the remaining two freeze-thaw cycles.For each cycle,all QC standards were thawed unassisted at room temperature. For the long-term stability studies, QC standards were stored at various storage conditions(-80,-30,and 4°C)and analyzed over 30 days(0,1,3,5 10,20, and 30 days).
2.7. Pharmacokinetic analysis
Pharmacokinetics parameters were determined based on plasma concentrations.The first order rate constants(k)associated with both the distribution phase (kdis) and elimination phase (kel)were estimated via linear regression of the log plasma A-967079 concentration-time curve.The plasma distribution half-life(t1/2,dis)and elimination half-life (t1/2,el) were calculated using natural logarithm (2)/k. The area under the plasma A-967079 concentration-time curve was calculated by the trapezoidal rule.
3. Results and discussion
3.1. HPLC-MS/MS analysis of A-967079
The analytical method for A-967079 from plasma reported here features a rapid and simple one-pot sample preparation method,consisting of protein precipitation, centrifugation, transfer and drying of the supernatant, and subsequent reconstitution in aqueous mobile phase for HPLC-MS/MS analysis. The overall sample preparation time was less than 20 min, with the total chromatographic analysis time of 10 min (including equilibration following sample analysis). The ESI(+)-MS of A-967079([M·]+= 209 m/z), with corresponding proposed assignments of fragments is shown in Fig. 2. Transitions 209→162 and 209→191 m/z were used for quantification and identification of A-967079,respectively.The optimized DPs and CEs for quantification and identification of A-967079 are shown in Table 1.
Representative HPLC-MS/MS chromatograms of the A-967079 analyzed from spiked plasma are shown in Fig. 3. Although the sample preparation protocol was simple, the method produced excellent selectivity.The A-967079 showed a sharp peak eluting at approximately 5.2 min,which was completely resolved from other components in the matrix. Although the A-967079 peak tailed slightly (As= 1.80), the tailing did not affect quantification of A-967079.

Fig. 3. Representative HPLC-MS/MS chromatograms of spiked (5 μM) and non-spiked A-967079 in rabbit plasma.The chromatograms represent signal response to the MRM transitions of A-967079 (209 →191 and 209 →162 m/z).
3.2. Linear range, calibration and limit of detection
Standard curves were constructed over the concentration range of 0.025-500 μM A-967079 in rabbit plasma.The 0.025 and 500 μM calibrators were beyond the linear range based on the accuracy and precision criteria. Therefore, the linear range of the method was 0.5 μM (LLOQ) to 200 μM (ULOQ) as best described by 1/x2weighted linear regression. The linear range of the method was large,spanning over three orders of magnitude,which is excellent for bioanalytical HPLC-MS/MS methods[40,43]and should be very useful for studies where analysis of a wide range of A-967079 concentrations is necessary. The calibration curves were found to be stable over three days as determined by consistency of the calculated slopes and the excellent fit of the data over the entire linear range for each day,as defined by the PRA(Table 2).Moreover,the method showed an excellent LOD of 25 nM in plasma as validated by analysis of multiple A-967079-spiked samples below the LLOQ over a 3 day period.
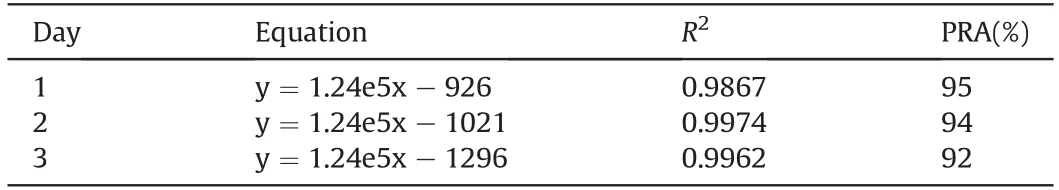
Table 2Linear equations, coefficients of determination (R2), and percent residual accuracy(PRA) for calibration curves created over 3 days.
3.3. Accuracy and precision
The accuracy and precision of the method were estimated by quintuplicate analysis of low, medium and high QCs on three different days (Table 3). The intraassay and interassay accuracies were both 100% ± 10.5% of the nominal QC concentrations. The precision of the method was good, with all QCs producing %RSDs<15%. The accuracy and the precision of the method were within the FDA-acceptable range for method validation from a biological matrix [40,42,43].
3.4. Matrix effect, recovery and stability
To determine the effect of the plasma matrix on the analysis of A-967079, the slopes of standard curves of A-967079 spiked in aqueous and plasma solutions were compared. The plasma to aqueous standard curve slope ratio was approximately 0.24,showing about 76%suppression of A-967079 signals via the current method.The recoveries for low,medium,and high QCs of A-967079 from plasma were 22%, 23%, and 26%, respectively. Since the % recovery value is the combination of matrix effect and recovery, the 24% average recovery is likely exclusively due to the 76% matrix effect suppression of A-967079 signals in rabbit plasma. Although there is a strong matrix effect, it was extremely consistent, and therefore, did not affect quantification of the A-967079. If desired,the signal suppression could be corrected via an internal standard,but over the course of method development, the consistency and accuracy of quantification of A-967079 via the method allowed for external standardization.
For the benchtop stability, A-967079 was stable for 10 h in plasma, but then started degrading below 85% of the control. A-967079 showed excellent freeze-thaw stability,with not more than 15% deviation from the control over the three freeze-thaw cycles evaluated.Moreover,the prepared A-967079 plasma samples were stable for 24 h in the autosampler. The long-term stability of A-967079 was evaluated at multiple temperatures.It was stable for 10 days at 4°C and showed excellent stability(i.e.,not more than 15%deviation from the control)in plasma at both-30°C and-80°C for 30 days(i.e.,the longest storage period evaluated).From the results of the stability studies, we recommend that when storage is necessary, plasma samples should be stored at either -30°C or -80°C and can be thawed and refrozen 3 times for analysis. If more than three freeze-thaw cycles or 30 days storage is necessary,the stability of A-967079 should be verified based on the specific storage requirements.If samples are to be analyzed within 10 days,they can be stored at 4°C.
3.5. Method application and pharmacokinetics
The validated method was applied to the analysis of plasma from rats treated with A-967079. Chromatograms from HPLC-MS/MS analysis of plasma of rats treated with A-967079 and rat plasma obtained prior to treatment are shown in Fig. 4. In the plasma of treated rats,A-967079 was elevated as a prominent peak eluting at 5.20 min, whereas no peak was present in the plasma obtained from rats prior to A-967079 treatment. This result confirmed the applicability of the method to analyze A-967079-treated animals,and further verified the selectivity of the method.
The pharmacokinetic profile of A-967079 for a single dose in rats is shown in Fig. 5 with pharmacokinetic parameters listed in Table 4. The profile shows a rapid increase and subsequent quick decrease in A-967079 concentration, with aCmaxandtmaxof 26.6 μM and 1.50 h, respectively. The distribution half-life (t1/2,dis)and distribution constant (Kdis) were 1.8 h and 0.3943 h-1, respectively. These results show that A-967079 is quickly absorbed and distributed in the rat.Elimination was slower,with at1/2,elof 92.2 h.The large area under the curve (i.e., AUC = 56.3 μM·h) along with relatively slow elimination of A-967079 is evidence of its relatively slow clearance.This suggests that A-967079 may have the ability to treat victims of TIH exposure for extended periods following treatment.
4. Conclusion
A simple and sensitive HPLC-MS/MS method for the determination of A-967079 in plasma was developed. The method presented here is the first validated method for the detection of A-967079 in any matrix. The method features simple and rapid sample preparation/analysis (30 min for a single sample), an excellent detection limit (25 nM), and a wide linear range of 0.05-200 μM (i.e., covered over 3 orders of magnitude). The method presented has the ability to analyze A-967079 from plasma of treated animals, which will allow further development of A-967079 as a therapy for pain and other noxious effects from TIH exposure.

Table 3The intra-and interassay accuracies and precisions of A-967079 analysis from spiked rabbit plasma by HPLC-MS/MS.

Fig.4. HPLC-MS/MS chromatogram from the plasma of A-967079-treated rats and rat plasma obtained prior to A-967079 treatment. The chromatograms represent signal response to MRM quantification transition of A-967079 (209 →162 m/z).

Fig. 5. Plasma concentration-time pharmacokinetic profile of A-967079 following intravenous administration of A-967079 to rats.Error bars represent standard error of the mean(SEM,n=3).Inset:Representation of elimination constant(Kel)of A-967079 by log concentration-time graph.

Table 4Pharmacokinetic parameters of A-967079 in a rat.
Conflicts of interest
The authors declare that there are no conflicts of interest.
Acknowledgments
We gratefully acknowledge support from the CounterACT Program, National Institutes of Health Office of the Director, and the National Institute of Environmental Health Sciences(NIEHS),Grant number U54 ES027698 (CWW). The opinions or assertions contained herein are the personal views of the authors and are not to be construed as official or as reflecting the views of the National Institutes of Health or the CounterACT Program.
 Journal of Pharmaceutical Analysis2020年2期
- Journal of Pharmaceutical Analysis的其它文章
- Recent advances and perspectives of nucleic acid detection for coronavirus
- Molecular immune pathogenesis and diagnosis of COVID-19
- Hollow fiber-based liquid phase microextraction followed by analytical instrumental techniques for quantitative analysis of heavy metal ions and pharmaceuticals
- Quantitative computed tomography analysis for stratifying the severity of Coronavirus Disease 2019
- Erucic acid from Isatis indigotica Fort. suppresses influenza A virus replication and inflammation in vitro and in vivo through modulation of NF-κB and p38 MAPK pathway
- Metabolic profiling of four synthetic stimulants, including the novel indanyl-cathinone 5-PPDi, after human hepatocyte incubation