
Biophysical interactions between silver nanoparticle-albumin interface and curcumin
2020-05-10 08:17VinodJaiswalDongre
Vinod D. Jaiswal, P.M. Dongre
Department of Biophysics, University of Mumbai, Vidyanagari, Santacruz, Mumbai, 400098, India
Keywords:
ABSTRACTActive targeted drug delivery methods facilitate effective uptake of functionalized nanoparticles through receptor-mediated transcytosis. In recent years, albumin-nanoparticle interaction has been critically examined so that this functionalized nanoparticle can be efficiently loaded with drugs. The present investigation aims at understanding the adsorption of Bovine Serum Albumin (BSA) on Silver Nanoparticle(SNP)surface,preparation of soft conjugates(SC)and hard conjugates(HC)of BSA-functionalized SNP (SNP-BSA), and their interaction with curcumin (CUR). HC contains tightly bound BSA whereas SC involves tightly and loosely bound BSA. Increase in the hydrodynamic radii of conjugates was observed upon SNP incubation with increased concentration of BSA.Three different SNP-BSA conjugate ratios were selected to study their interaction with CUR. Fluorescence spectroscopy showed a strong association between CUR and SNP:BSA conjugates. However, binding varied with a change in the conjugate ratio.Circular Dichroism (CD)/Fourier Transform Infrared (FTIR) spectroscopy revealed the alterations in the secondary structure of BSA upon CUR binding to the conjugates. Zeta potential data indicated stable conjugate formation. CUR in SNP:BSA conjugate was found to have a higher half-life as compared to the control. We believe that this is the first biophysical characterization report of conjugates that can be effectively extrapolated for targeted drug delivery.
1. Introduction
Nanomaterials have led to significant innovation in drug delivery strategies. Various compounds such as proteins, drugs and polymers adsorb onto nanoparticles due to their large surface to volume ratio. Nanoparticles are often surface-modified to target altered(diseased)cells. Surface-modified nanoparticles also minimize the toxicity to non-target organs. Extensive studies pertaining to SNP interaction with bovine serum albumin (BSA) have been carried out in recent years,since albumin performs important physiological functions such as regulation of oncotic pressure of blood, and binding of ions, hormones and anticancer drugs [1-6].Thus, BSA-functionalized SNP can act as a nano-based carrier for targeted drug delivery.
CUR possesses diverse pharmacological potentials that include anti-inflammatory, antioxidant, antiangiogenic, antiproliferative,anticancer and wound-healing properties [7]. At the cellular level,CUR inhibits NF-kappaB, which plays a vital role in cancer development. It also induces proteasome-mediated down-regulation of cyclin E and up-regulation of the CDK inhibitor p21 and p27 in several cancer lines apart from resisting tumor growth.CUR causes a rise in protein levels of the proapoptotic Bcl-2 family members Bax and Bak and, therefore, promotes cell death [8,9]. It also inhibits STAT3 signaling pathways,the activation of which plays a key role in breast cancer, head and neck cancer, prostate cancer, colon cancer, and lymphomas. [10]. Although CUR shows remarkable anticancerous properties, it has several drawbacks such as immediate degradation at physiological pH, low half-life, poor aqueous solubility,rapid metabolism to various products,and physiological unavailability in the body [11-14].
Many drug delivery systems have been reported to enhance the efficacy of CUR in suppressing tumor growth. Sun et al. [15] reported the delivery of CUR loaded in exosomes. Yang et al. [16]encapsulated CUR into micelles to suppress the growth of CT26 colon carcinoma cells. Patil et al. [17] prepared novel CUR-mixed micelles. Similarly, in another study, CUR was co-loaded with paclitaxel into PEG-PE-based micelles modified with transferrin as a targeting ligand [18].
However, most of the drug delivery systems are complex and require toxic solvents. For example, PEG-coated liposomal doxorubicin (Doxil) accumulates in the skin because of increased circulation time,resulting in the hand foot syndrome(palmar-plantar erythrodysesthesia). Similarly, liposomal drug products are sensitive to the manufacturing condition. These products lose their ability in optimal drug retention. Nonspecific serum protein adsorption on liposomal surfaces reduces its targeting capacity and thus,hinders tumor penetration.Further,they show instability due to high surface energy and undergo aggregation [19]. Therefore,there is a compelling need for a drug delivery system that is simple,biocompatible and nontoxic.SNP-based drug delivery systems have been studied extensively because of their stability, easy synthesis procedure and novel optical properties. Similarly, albumin-based systems have attracted research attention because they can be initiated naturally for drug release either by protease digestion or pH-based responsive methods. In this system, the payload release can be controlled by manipulating the amount of albumin on the nanoparticle surface [20].
SNP-BSA interaction has been extensively characterized in recent times,but these nano-carriers are yet to be studied in detail for their interactions with the drug. This investigation aims at understanding the characteristics of CUR on the SNP-BSA hard conjugates, i.e., at the nano-bio interface. A detailed study of interactions between CUR and SNP-BSA SC/HC has been performed using various biophysical techniques such as UV visible spectroscopy, fluorescence spectroscopy, FTIR spectroscopy, CD spectroscopy, dynamic light scattering (DLS) and Zeta potential. Detailed physicochemical characterization such as size, size distribution,surface morphology,drug binding study,kinetics,structural change in biologics,the stability of drug within the conjugates,stability and solubility in the system, and toxicity have been studied. This investigation also aims at overcoming the above-mentioned limitations of CUR.
2. Experimental
2.1. Materials
CUR (fromCurcumin longa) (Sigma Aldrich), BSA (Himedia),silver nitrate (SD fine), tri sodium citrate (Thomas Baker), and ethanol (Merck) were used in this experiment. Stock solutions of BSA(30 mg/mL)were prepared in 1 mM phosphate buffer(pH 7.4).CUR (10 mM) was prepared in ethanol. The final ethanol concentration in the system did not exceed 1.5%(v/v)to ensure a negligible effect on protein structure. Double distilled water was used for preparing all the reagents.All the chemicals used were of analytical grade.
2.2. Methods
2.2.1. Synthesis and characterization of SNP
Silver nanoparticles were synthesized using a chemical reduction method [16]. Silver nitrate (1 mM) was heated on a hot plate with a magnetic stirrer to a temperature up to 353K.Sodium citrate(1%)was added drop-wise with constant stirring until the solution turned yellow. The synthesized particles were cooled at room temperature and used for characterization.
UV visible spectrum of SNP was recorded in the wavelength range of 200-600 nm using a 10 mm path length quartz cuvette.Dynamic light scattering (DLS) experiment was performed to determine the average size of the nanoparticle(d)at 298K with an average of 3 runs.300 kV field emission gun-transmission electron microscope (HR-TEM) (model number Tecnai G2, F30) and 30 kV field emission gun-scanning electron microscope(FEG-SEM)(JSM-7600F)were employed to understand the shape of the synthesized SNP. Concentration of SNP was determined using Equation (1)[21-24].
where N is the number of silver atoms present in each silver nanoparticle(N=31 d3),d is the size of nanoparticle in nm,NTotalis the number of silver atoms added to the reaction mixture,which is the product of number of moles of silver and Avogadro's number.V is the volume of solution in dm3and NAis the Avogadro's constant.
2.2.2. Preparation and selection of SNP-BSA conjugates
In order to achieve optimum adsorption of BSA on SNP,varying concentrations of BSA were incubated with fixed SNP concentration(SNP - 0.16 nM and BSA - 15 μM, 45 μM, 75 μM,105 μM,135 μM,165 μM,195 μM, and 225 μM). Considering the SNP concentration of 0.16 nM as 1 unit and BSA concentration of 15 μM as 1 unit,the SNP:BSA ratios were named as 1:1,1:3,1:5,1:7,1:9,1:11,1:13 and 1:15, respectively, for the above-mentioned BSA concentrations.
The experimental sets were incubated at room temperature for 1 h before any further characterization. The resulting BSA-SNP conjugates were named as soft conjugates (SC). Hard conjugates(HC)were obtained by centrifuging SC at 15000 rpm for 15 min.The pellets of HC were carefully separated and the supernatant, containing unbound BSA, was discarded. Pellets were washed thrice with an equal amount of buffer and suspended in the buffer for further studies. Three conjugate ratios (least saturated, partially saturated and fully saturated) of both SC and HC were selected based on the DLS observations for studies of interaction with CUR.
2.2.3. Dynamic light scattering (DLS) measurement
DLS was employed to determine the hydrodynamic size of the SNP-BSA conjugates(SC and HC)using a Malvern ZS90 instrument at 298 K with an average of 3 runs using Polystyrene cuvettes.Zeta potential was used to monitor their stability using dip cell DTS1070 at 25°C. The wavelength of the laser used for measurement was 632.8 nm with the scattering angle of 90°.Dispersant viscosity was 0.89 cP and refractive index was 1.33.
2.2.4. Haemolysis assay
The haemolytic assay was performed with various concentrations of synthesized SNP to understand its biocompatibility. Red blood cells(RBCs)were obtained from a healthy donor.RBCs were centrifuged at 1500 rpm and the supernatant containing plasma was discarded.RBC pellet was washed three times with saline and final stock concentration of RBC was maintained at 5%. Stock solution of RBC(0.5 mL)was incubated with various concentrations of SNP(0.011 nM,0.136 nM,0.27 nM,0.41 nM,0.54 nM and 0.68 nM)for 3 h.Double distilled water(dw)and saline were the positive and negative controls, respectively. The haemolytic assay was also performed for three selected SCs and corresponding HCs. The percentage haemolysis was calculated using Equation (2) [25].

2.2.5. UV visible measurements
Varying concentrations of CUR were titrated against BSA, SNP and SNP-BSA SC and HC. The measurements were recorded on a nanophotometer (Implen) in the wavelength range of 200-800 nm. Triplicate measurements were performed for each sample set.
2.2.6. Fluorescence measurements
Fluorescence measurements were recorded on the Varian,Cary Eclipse Fluorescence Spectrophotometer using a 10 mm path length rectangular quartz cuvette.
Intrinsic fluorescence spectra of BSA, SNP-BSA conjugates (SC and HC) with and without CUR were measured in the emission range of 310-500 nm using an excitation wavelength of 295 nm.Excitation and emission slit width was set at 10 nm. For BSA and SNP-BSA SC,the PMT voltage was set at 450V,whereas for SNP-BSA HC, the PMT voltage was set to 600V.
CUR fluorescence intensities were recorded in the emission range of 450-600 nm using an excitation wavelength of 430 nm.PMT voltage was set to 540 V and 570 V for SC and HC,respectively.
2.2.7. Fourier-transform infrared (FTIR) measurements
FTIR spectra of SC with and without CUR were obtained using a Confocheck Tensor II Bruker spectrometer. All the measurements were performed in aqueous condition using an Aquaspec micro transmission cell with a path length of approximately 7 μm. For measurement purposes, 10 μL of the sample was filled into the transmission cell via an injection port using the Hamiltonian syringe. The spectra were corrected for the buffer-induced background emission. The FTIR spectra were recorded from 3100 cm-1to 1000 cm-1with a resolution of 4 cm-1.The number of scans used was 90 with an average scan speed of 15 s.The in-built software of Confocheck Tensor II was used to predict the percentage change in α helix.
2.2.8. Circular dichroism (CD) measurements
CD spectra were recorded using a Jasco CD spectrometer model number J-815 with a slit width of 1.0 and a cell of 1 mm path length.In the case of HC,the secondary structural changes produced in the protein(with and without CUR)were investigated using the far UV range,i.e.,190-250 nm wavelength.The CD spectrum of phosphate buffer was set as a blank. The concentrations of protein on the HC were calculated(supplementary information),which were used to calculate the molar ellipticity[θ](deg cm2dmol-1)defined as[θ] =CD/(10 ×n ×l ×C),where CD is in millidegree,n is the number of amino acid residues,l is the path length of the cell in cm and C is the molar concentration of the protein. The alpha-helical content was calculated using Equation (3) [26].

where[θ]208is the molar ellipticity value observed at 208 nm,4000 is the MRE of the β form and the random coil conformation cross at 208 nm, and 33000 is the MRE value of a pure helix at 208 nm.
3. Results and discussion
3.1. Characterization of SNP and SNP-BSA conjugates
3.1.1. Surface plasmon resonance(SPR)characterization of SNP and SNP-BSA conjugates
UV visible spectrum of SNP exhibited a surface plasmon resonance peak at 417 nm (Fig.1A), which confirmed the formation of SNP. At the nano level, plasmons (electron density waves) propagated at the interface of the metallic nanoparticle surface and the surrounding dielectric.In an external field,electric or magnetic,the plasmons became polarized, experienced a restoring force and oscillated. The oscillating plasmons underwent resonance at the resonating frequency of the electromagnetic waves.In this case,the synthesized SNPs were found to undergo resonance at 417 nm and exhibited a characteristic yellow color [27].
Our previous study showed that upon adsorption of BSA,the SPR peak of the SNP shifts 2-4 nm towards the blue region,explaining the sensitivity of nanoparticles towards the surrounding dielectric medium and indicating the formation of ground state conjugates[21].
3.1.2. DLS and zeta potential of SNP and SNP-BSA conjugates
DLS determines the size of the particle suspended in the liquid medium by measuring the Brownian motion of a particle.DLS value refers to particle diffusion within the fluid, thus measuring the hydrodynamic diameter.The hydrodynamic size of the synthesized SNP was found to be 34 ± 2 nm (Fig.1B). TEM image revealed the particles to be spherical(inset of Fig.1B).The concentration of the synthesized SNP was calculated using Equation (1) and was found to be 0.82 nM.
The hydrodynamic diameter of both SC and HC increased with increased ratio of SNP:BSA, reaching saturation at SNP:BSA (1:9)conjugate (Fig.1C). Increase in the size of the conjugates indicates the binding of SNP and BSA. Based on the saturation of nanoparticles surface,three conjugates-least saturated[SNP:BSA(1:1)],partially saturated [SNP:BSA (1:5)] and fully saturated [SNP:BSA(1:1)] conjugates were chosen for further studies.
The SEM image of SNP and SNP:BSA (1:9) conjugates revealed the adsorption of BSA on the SNP surface(Fig.S1).Both SNP and the conjugates were spherical. Fig. S2 shows the DLS measurement of both SC and HC, indicating their distribution (supplementary information).
Any change on the surface affects the diffusion speed, and therefore,a corresponding change in the apparent size is observed
[28]. A change in size of 2±1nm was observed in HC due to the removal of unbound BSA. Rocker et al. [29] have described the dependence of hydrodynamic radii (RH) on the number of protein molecules bound (N) (See supplementary information). The adsorption capacity of SNP:BSA(1:1),(1:5)and(1:9)HC was found to be 59,222 and 356 molecules per nanoparticle,respectively.For spectroscopic measurements, the final concentration was optimized to 0.09 μM [SNP:BSA (1:1)], 0.37 μM [SNP:BSA (1:5)] and 0.596 μM [SNP:BSA(1:9)].
Zeta potential is the potential at the slipping plane formed on the particle.Its magnitude determines the potential stability of the colloidal system. Particles with high zeta potential values tend to repel each other and thus, do not allow the particle to aggregate;hence,it is considered to be stable.SNP was found to be stable in a buffer solution(pH=7.4)with zeta potential value of-32±2 mV.Zeta potential values of HC and SC indicated their stability,with HC exhibiting higher stability (Fig.1D).
3.2. Haemolysis assay
Biocompatibility of therapeutic nanostructures is vitally important in any health application. SNP is known to elevate the cell-free haemoglobin content upon RBC rupture. It can be observed that percentage haemolysis increased with the increased concentration of SNP(Fig.2A).Percentage haemolysis was found to be 45% (0.11 nM SNP) to 98.35% (0.68 nM SNP). When SC and HC were incubated with RBC, the observed haemolysis reduction was in the range of 82.44%-90.1%for SC and 98%-99%for HC(Fig.2B).
The significant decrease in%haemolysis in both the conjugates indicates the formation of a BSA corona on the SNP surface,which prevents the haemolysis of RBC. Therefore, both the conjugates displayed biocompatibility. Previous reports on haemolysis also indicated a reduction in the haemolysis. Saha et al. [30] reported suppression in the haemolytic activity of hydrophilic and hydrophobic nanoparticles when modified with blood plasma protein.Martinez et al. [31] also reported the biocompatibility of proteinnanoparticle conjugates using haemolysis studies.
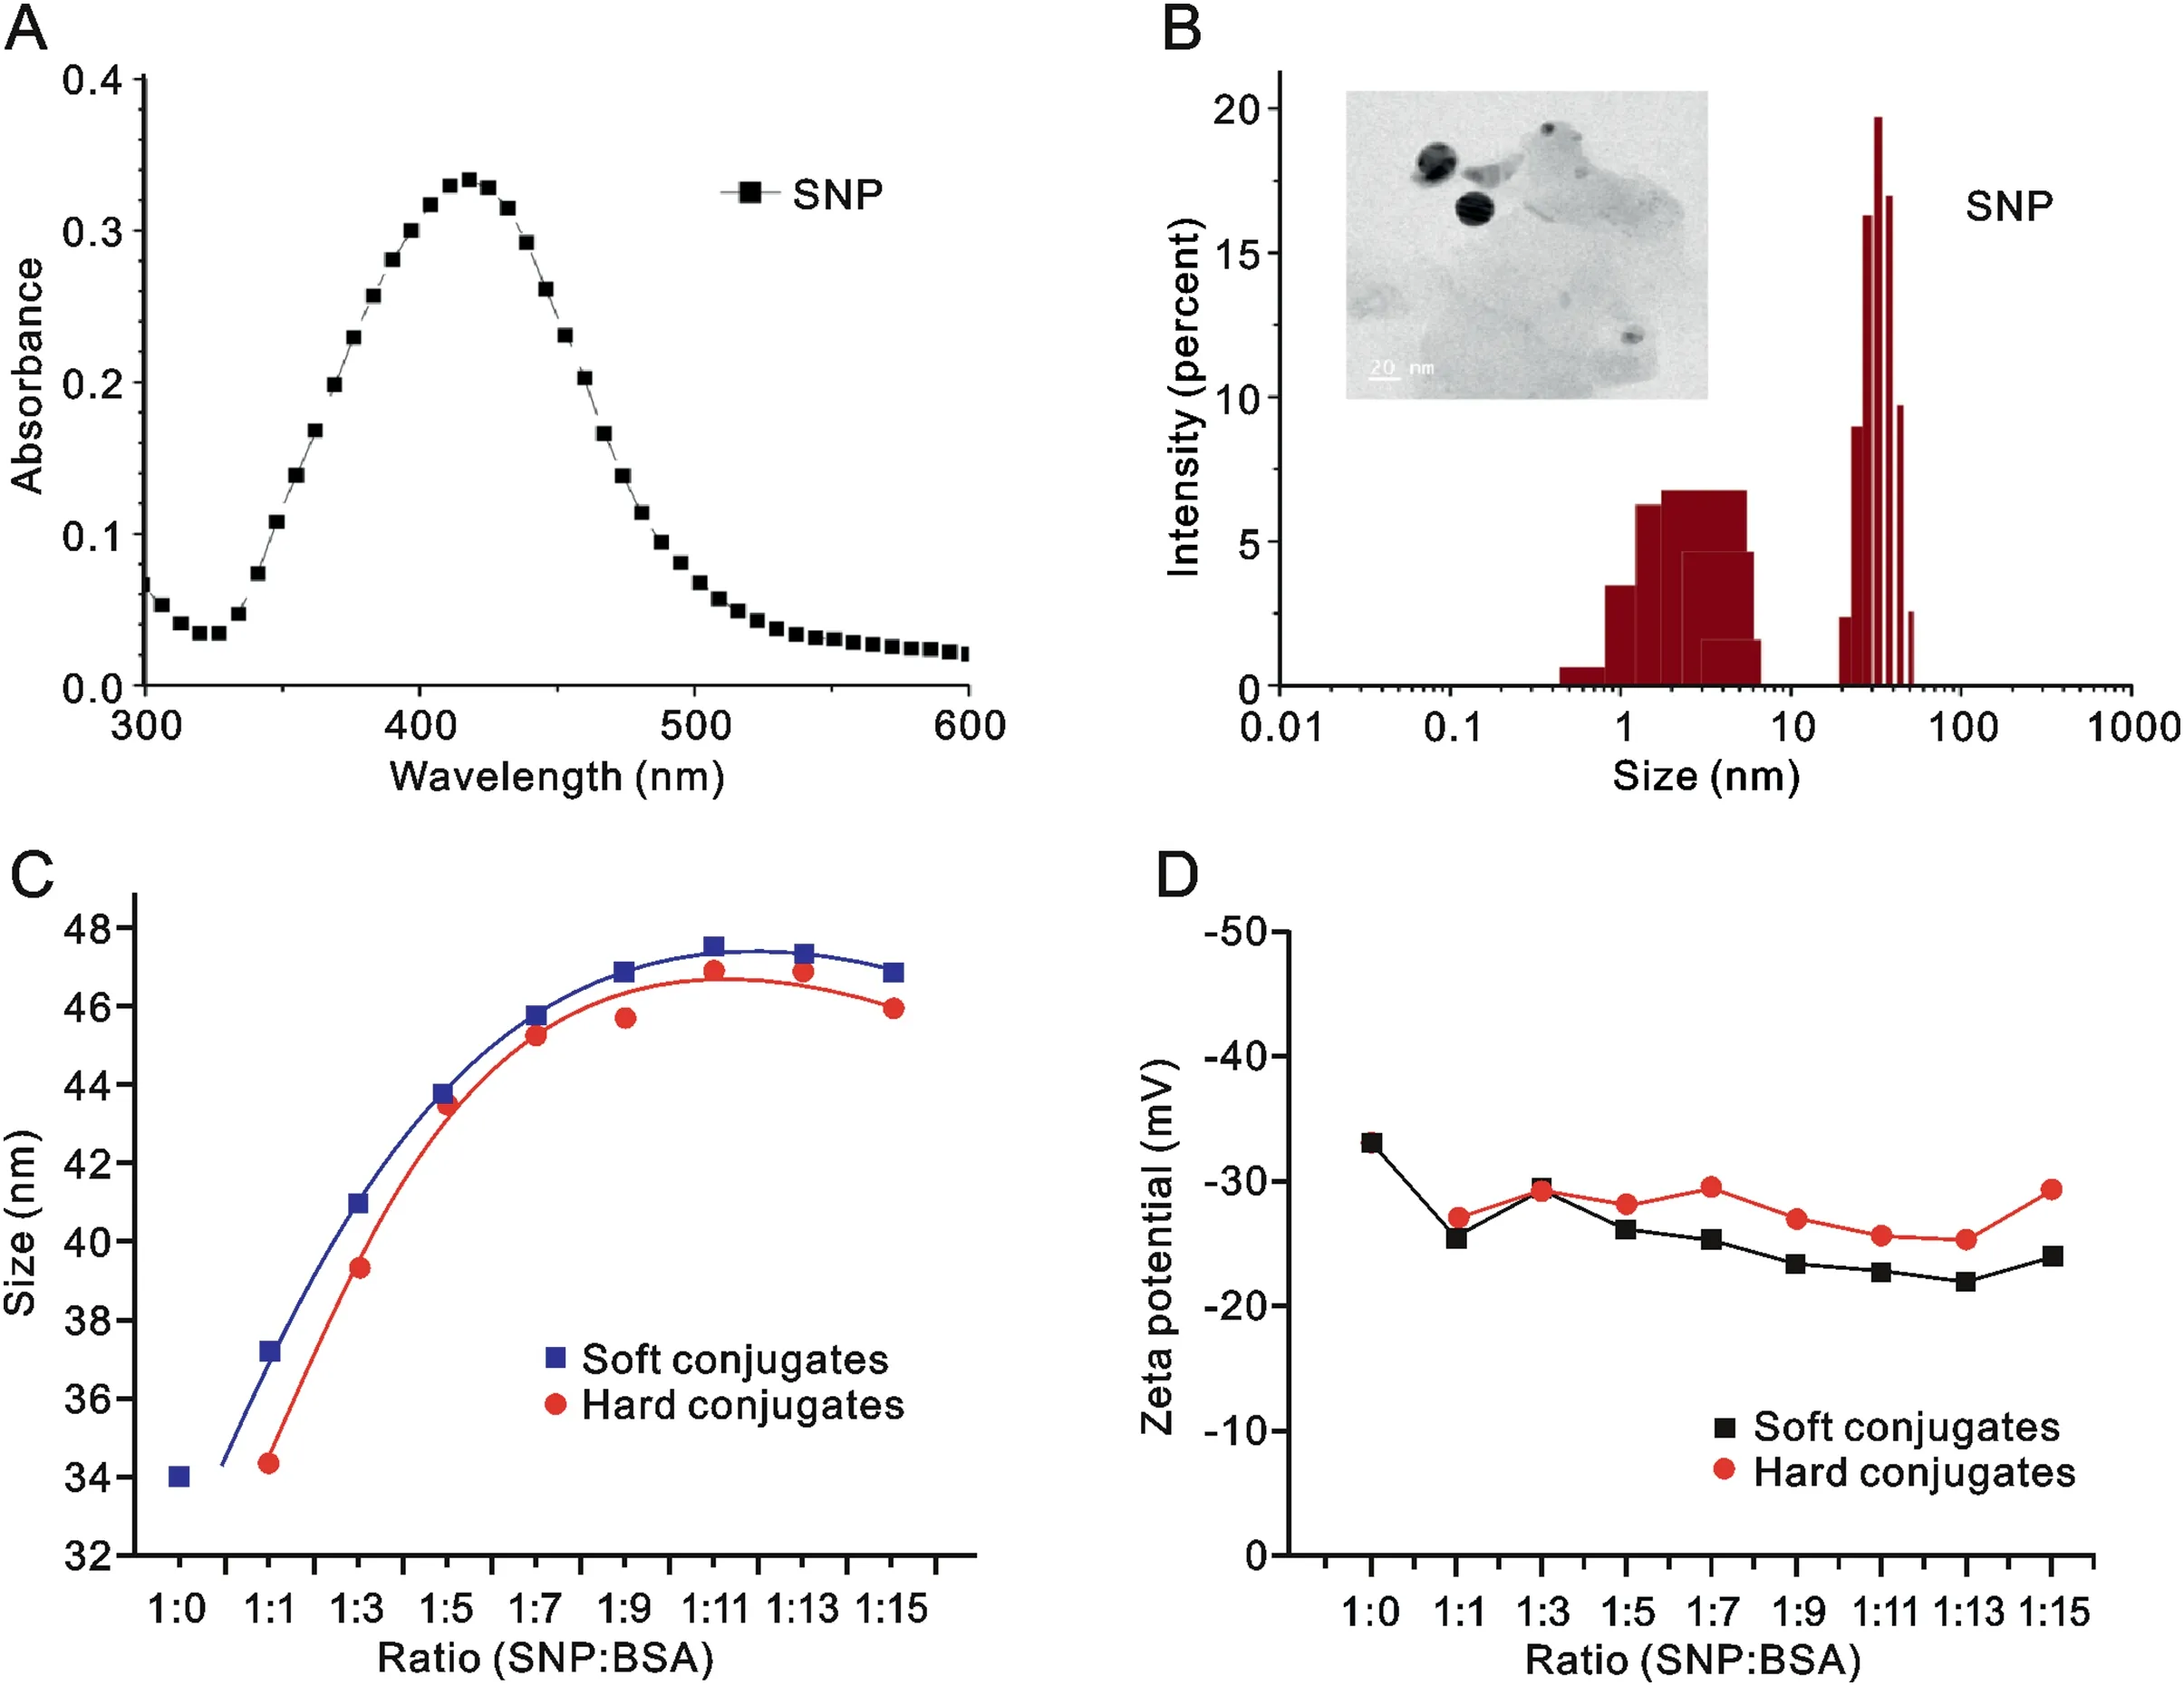
Fig.1. (A) UV visible spectrum and (B) DLS of SNP; Inset of B: TEM image of SNP, (C) DLS and (D) Zeta potential of SC and HC.

Fig. 2. Percentage haemolysis of (A) different SNP concentrations and (B) conjugates containing 0.11 nM SNP.
3.3. UV visible spectroscopy studies
At pH 7.4, UV visible spectra of CUR showed maximum absorption at 424 nm,accompanied with a shoulder peak at 259 nm(Fig.3A).The peak at 259 nm represented the degraded products of CUR [32]. CUR is known for its instability at neutral and basic pH wherein it undergoes spontaneous degradation. The removal of proton from the phenolic group of CUR at basic pH is responsible for the cleavage of CUR into the degraded product [11].
Upon CUR incubation with SNP, the characteristic peak of CUR was obtained at 425 nm at pH 7.4 (Fig. 3B). SNP is known for its catalytic activity towards CUR and, therefore, degrades CUR at a faster rate [32]. The UV visible peak at 259 nm indicated the formation of degraded CUR.
When CUR interacted with BSA(15 μM), absorption maxima of CUR was obtained at 434 nm(Fig.3C).The significant redshift from 424 nm indicated the extra stability provided to CUR by the hydrophobic pocket of BSA [33]. The peak at 259 nm was absent,indicating the protection of CUR from buffer degradation.BSA peak at 278 nm undergoes hyperchromic shift due to increased concentration of CUR, which indicates ground state conjugate formation between BSA and CUR [21]. UV visible spectra of all the three SNP: BSA SCs with CUR showed a peak at 434 nm, like BSA CUR conjugates. With increased concentration of CUR, the hyperchromic shift at 278 nm was visible. (Fig. 3D-F).
SNP:BSA(1:1)HC did not show any significant peak at 278 nm,which indicates negligible amount of protein adsorption on the SNP surface (Fig. 3G-indicated by arrow). In the case of both SNP:BSA(1:5)and(1:9)HC,the peak at 278 nm provided evidence of protein adsorption on the SNP surface (Fig. 3H and I).
The absorption maxima of CUR in SNP: BSA (1:1) HC was obtained at 424 nm.It differed from the CUR peak(434 nm)observed in the case of BSA-CUR interaction and SC-CUR interaction. This indicated the insufficient amount of protein present on SNP: BSA(1:1) HC to incorporate CUR. The peak obtained at 424 nm was a characteristic absorption of CUR alone.The peak at 259 nm strongly indicated CUR degradation. In SNP:BSA (1:5) and (1:9) HC, CUR peak was observed at 428 nm,which indicated the stabilization of CUR by the adsorbed BSA molecules.
These results indicate the extent of protein adsorption on the SNP surface and its effect on the stability of CUR. Since the SNP surface is not completely occupied in SNP: BSA (1:1) HC, CUR undergoes immediate degradation after encountering SNP surface[32]; hence, a peak was observed at 259 nm. SNP: BSA (1:5) and(1:9) HC showed higher protein adsorption on the SNP surface, as indicated by the 278 nm peak.Therefore,more CUR molecules were incorporated into the adsorbed BSA. As the SNP surface was covered in these two conjugates, CUR degradation was less.
3.4. Fluorescence quenching - BSA fluorescence studies
A decrease in the fluorescence intensity is called quenching,which may be attributed to molecular interaction,energy transfer,or non-fluorescent ground state conjugate formation between the fluorophore and the quencher [21].
The quenching constantKSVwas calculated using Equation (4),known as the Stern-Volmer equation.

where KSVis the Stern-Volmer constant, kqis the biomolecular quenching rate constant, τois the life-time of the fluorophore without quencher, Foand F are the fluorescence intensities in the absence and presence of the quencher and [Q] is the quencher concentration.
For n number of binding sites on the surface of the protein,the equilibrium between free and bound ligand is expressed using Equation (5).
where K is the binding constant.
The fluorescence emission spectra of BSA-CUR interaction are shown in Fig. 4A. With the increased concentration of CUR, intensity of the BSA peak decreased with a blue shift of 7 nm.In the inset(Fig.4A),temperature dependence,Stern Volmer and double logarithmic graphs were plotted to understand the type of quenching and to estimate the thermodynamic parameters governing the interaction.
There are two modes of fluorescence quenchingviz., static and dynamic. Both require molecular contact between the quencher and the fluorophore. In static quenching, there is a ground state conjugate formation and the resulting conjugates are nonfluorescent. However, in dynamic quenching, the quencher diffuses to the fluorophore and makes contact during the lifetime of its excited state. Consequently, the fluorophore returns to the ground state without the emission of a photon. Static and dynamic quenching can be distinguished by their varied dependence on temperature. At higher temperature, collisional quenching takes place more frequently due to the faster diffusion rate,resulting in a higher quenching constant. However, in static quenching, dissociation of weakly bound conjugates results in a lower value of the quenching constant [21,34,35].
Thermodynamic parameters ΔHoand ΔSowere determined using the van't Hoff equation (6).

Fig.3. UV visible spectra of(A)CUR;(B)CUR-SNP;(C)CUR-BSA;(D)SNP:BSA(1:1)SC-CUR;(E)SNP:BSA(1:5)SC-CUR;(F)SNP:BSA(1:9)SC-CUR;(G)SNP:BSA(1:1)HC-CUR;(H)SNP: BSA (1:5) HC-CUR and (I) SNP: BSA (1:9) HC-CUR.
where K is the binding constant at a given temperature T.The slope and the intercept of the plot of ln K versus 1/T yields ΔHoand ΔSovalues, respectively. The equation ΔGo=ΔHo-TΔSodetermines the Gibbs free energy change.
These parameters enable us to understand the type of interactive forces that exist between the two molecules. ΔHoand ΔSovalues were found to be -33.355 kJ/mol and -9.58 J/mol·K,respectively. Since ΔHo<0 and ΔSo<0, the major binding forces are hydrogen bonding and van der Waal's interaction [21]. The negative ΔGovalue indicates the spontaneity of the reaction(Table 1).Hao et al.[36]reported a similar interaction.From Table 1,it is evident that the binding constant and association constant decreased with increased temperature, indicating the probable quenching mechanism to be static.
Fig. 4 (4B, 4C and 4D) shows the fluorescence spectra of SNP:BSA SC - CUR interaction. In the case of SNP: BSA (1:1) SC, initial shift due to SNP alone was 5 nm,whereas in both SNP:BSA(1:5)SC and SNP: BSA (1:9) SC, the shift was just 2 nm towards the blue region.The additional blue shift of 3-5 nm was observed on further addition of CUR.
The binding parameters were calculated using Equations(4)and(5). Table 2 shows the corresponding number of binding sites (n),biomolecular quenching rate constant (kq), and Stern-Volmer constant(KSV)at 300K.The binding number of BSA-CUR interaction was 1.19, which was in good agreement with previous investigations[36,37].For the SNP:BSA(1:1)SC-CUR interaction,the binding number reduced to 1.00 and their association constant also decreased. There could be two possible reasons for the decreased binding capacity - the degradation of CUR on the exposed nanoparticle surface leading to decreased CUR concentration[32]or the structural perturbation of BSA caused by the nanoparticles,making CUR inaccessible to the fluorophore.
Fig.5 shows fluorescence graphs along with double logarithmic plots for SNP-BSA(HC)-CUR interactions.In the SNP:BSA(1:1)HC- CUR interaction, no significant quenching was observed upon CUR addition.Insignificant quenching in the case of SNP:BSA(1:1)HC indicated the low availability of protein on the surface of the SNP.In SNP:BSA(1:5)and(1:9)HC,emission peak was obtained at 340 nm. The peak shifted to the blue region wavelength with increased concentrations of CUR. The binding number and association constant of HC are shown in Table 2. SNP: BSA (1:9) HC showed better binding capacity and a higher association constant than the other HC conjugates.
However, to avoid the effect of SNP (also acting as a quencher)on the fluorescence intensity of BSA, the fluorescence intensity of CUR was also studied.The observations are in the following section.
3.5. Fluorescence enhancement - CUR fluorescence studies
Upon interaction with BSA, the fluorescence peak of CUR increases sharply. The fluorescence enhancement (ΔFE), which is linearly related to the extent of binding,was calculated according to Equation (7) [38].
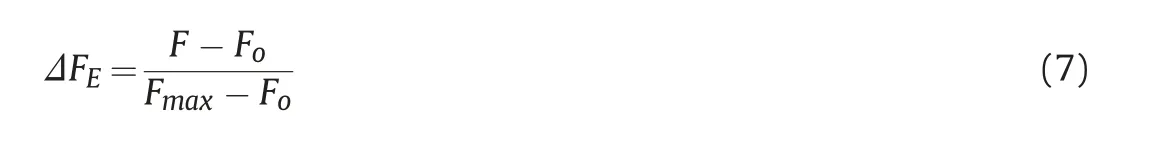
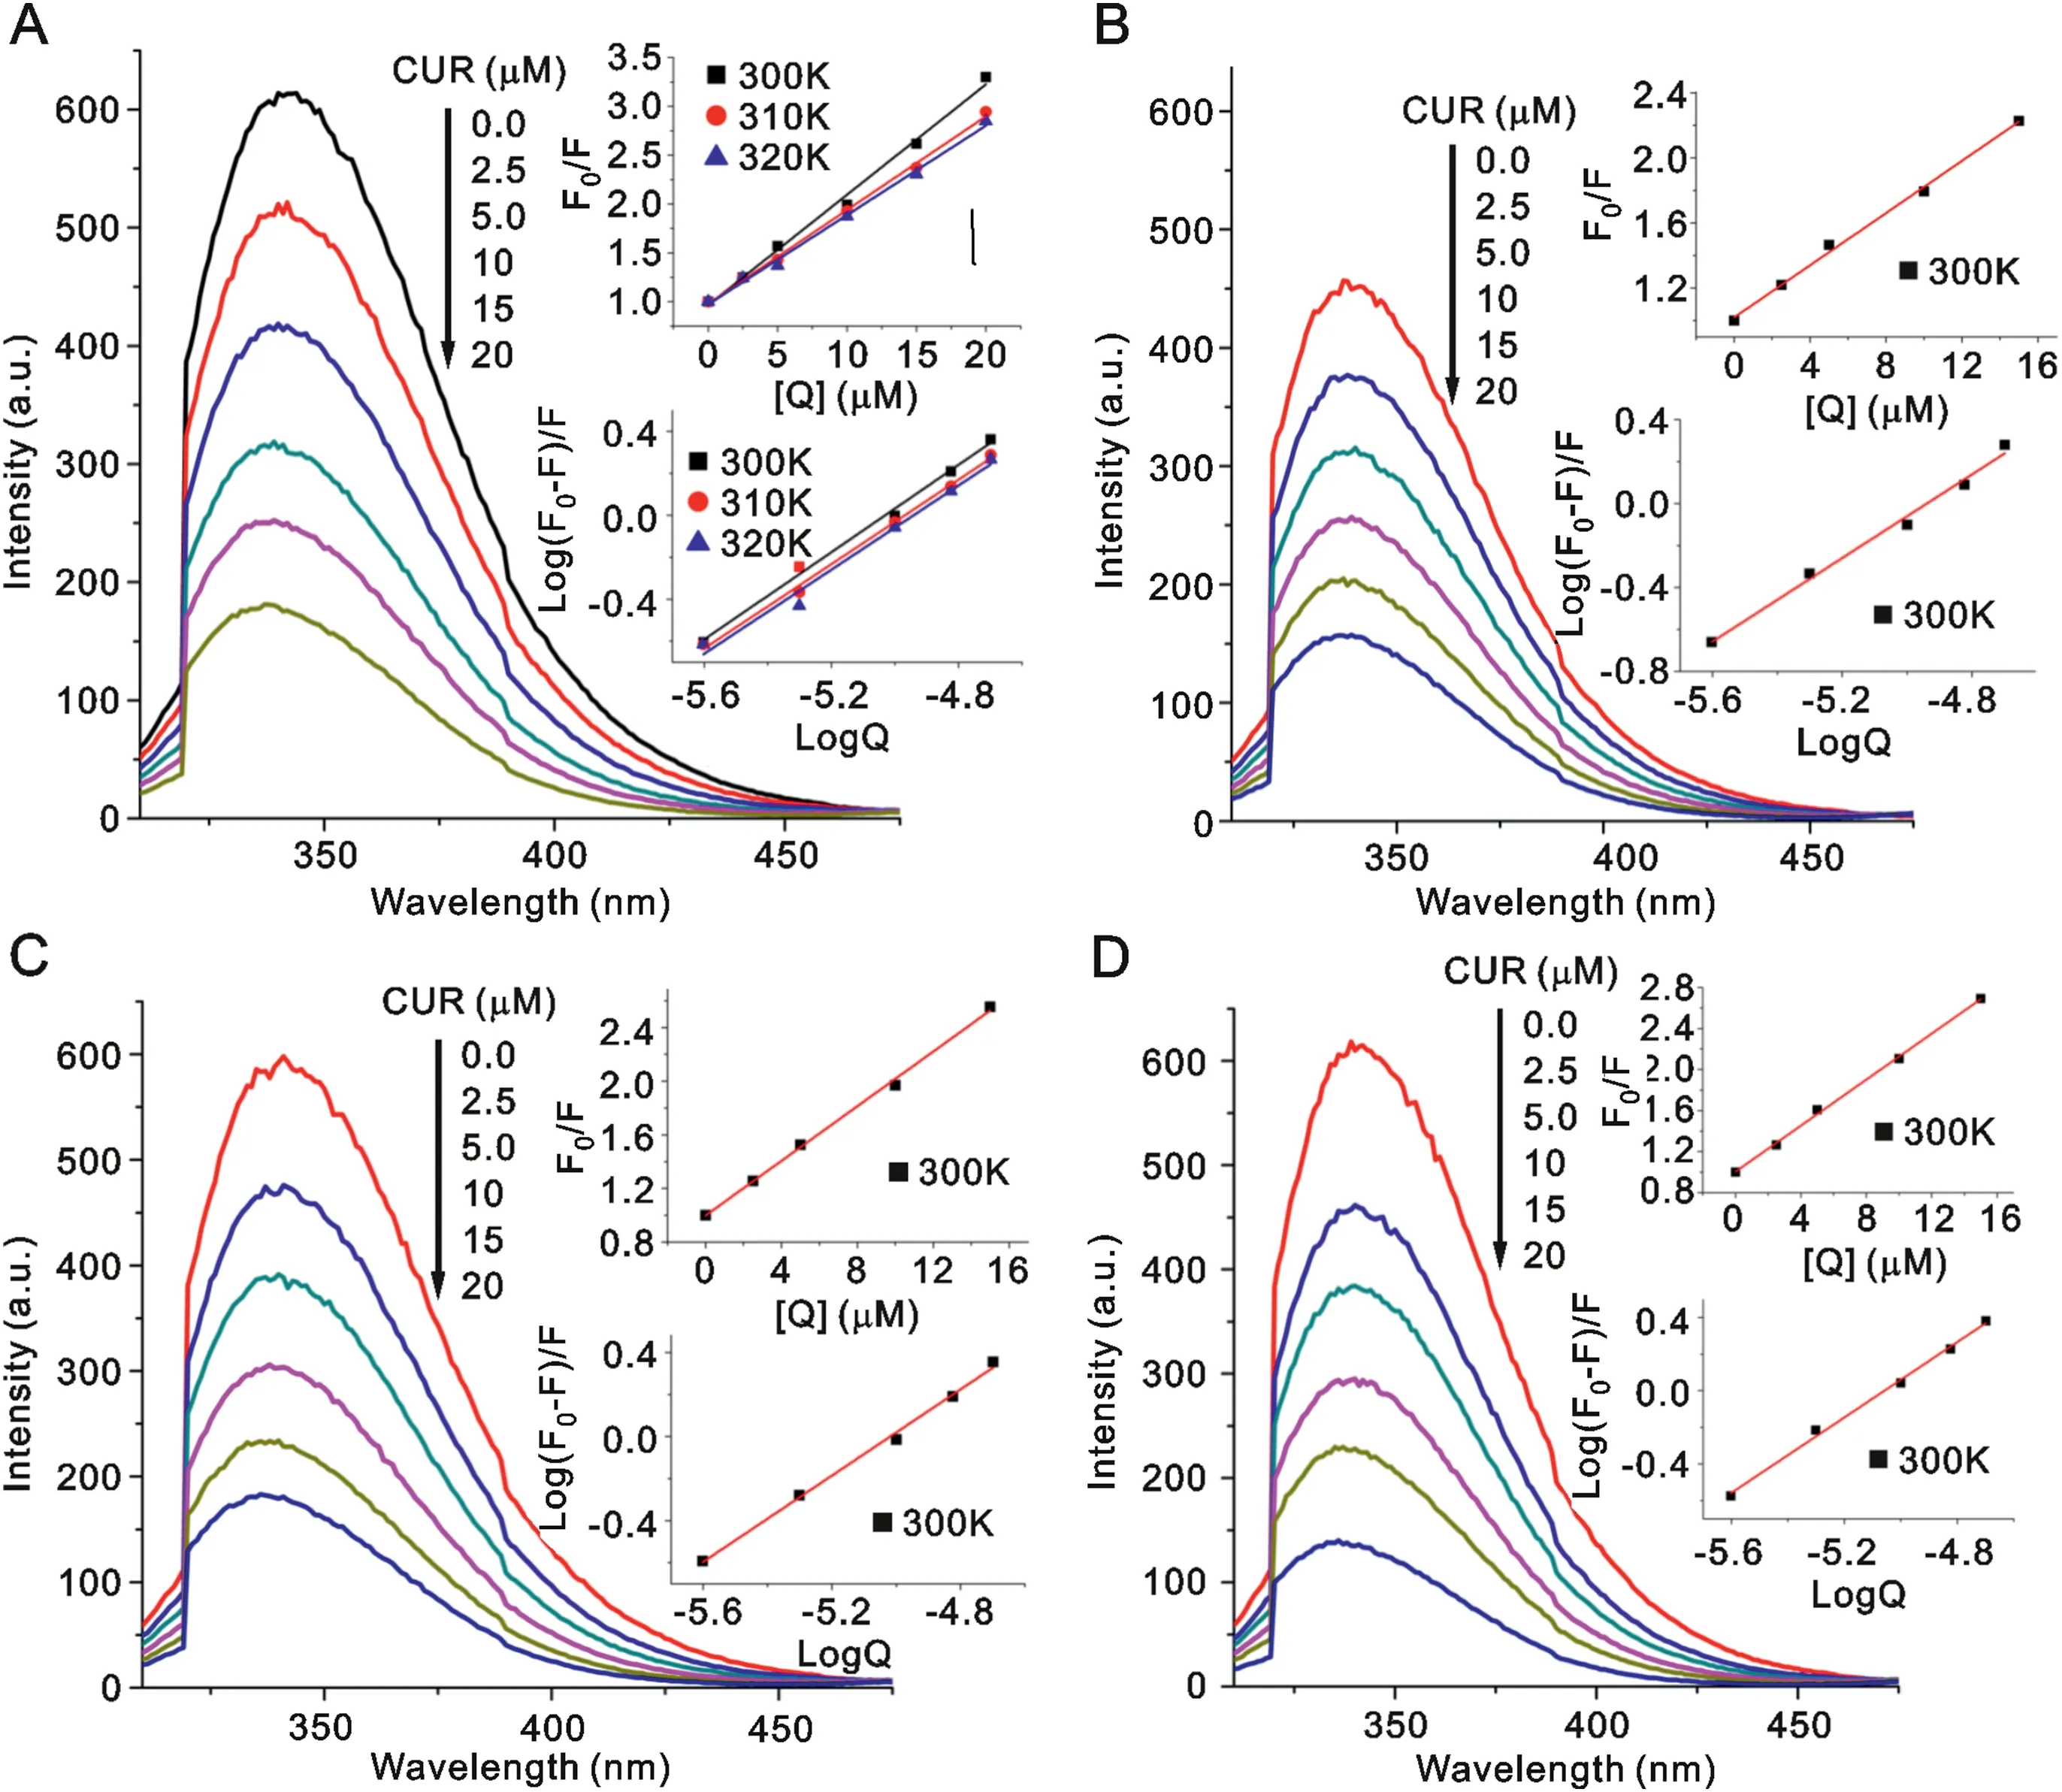
Fig. 4. Fluorescence spectra of (A) BSA and BSA-CUR conjugates; (B) SNP: BSA (1:1) SC-CUR; (C) SNP: BSA (1:5) SC-CUR and (D) SNP: BSA (1:9) SC-CUR conjugates with corresponding stern volmer plot and double logarithmic plot.
where F represents the individual fluorescence peak, Fmaxand Foare the fluorescence intensities at maximum and zero CUR concentration, respectively.
Fluorescent enhancement(ΔFE)is related to binding number(n)and the dissociation constant (Kd), according to Equation (8).
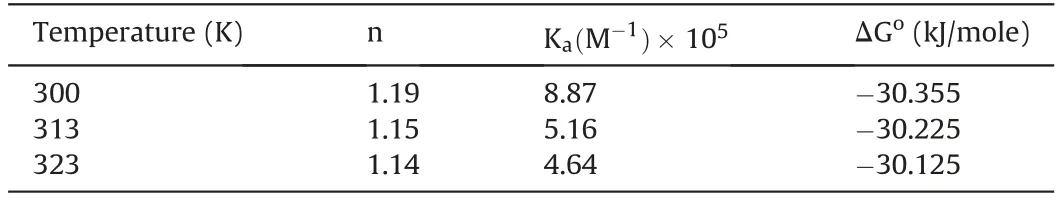
Table 1The binding parameters and Gibb's free energy change for the BSA-CUR interaction at different temperatures.

Table 2Stern-Volmer quenching constant and binding parameters for the interactions of SC and HC with CUR.
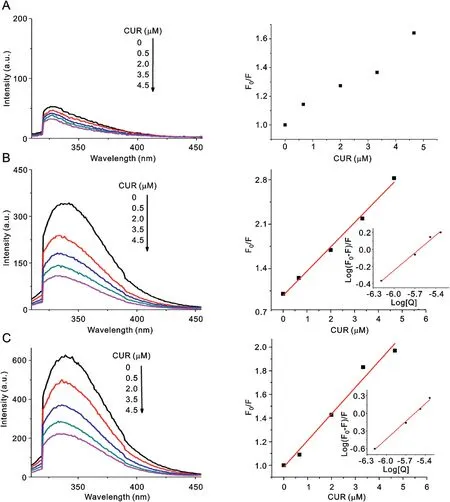
Fig.5. Fluorescence spectra of(A)SNP:BSA(1:1)HC-CUR;(B)SNP:BSA(1:5)HC-CUR and(C)SNP:BSA(1:9)HC-CUR with corresponding Stern-Volmer plot and double logarithmic plot.
where Kd= 1/Kaand Kais the association constant.
CUR emitted a very weak fluorescence at 567 nm when excited at 430 nm (Fig. 6A). However, in the presence of BSA, a significant enhancement in the fluorescence intensity of CUR was obtained.The new emission wavelength was observed at 506 nm, with a significant blue shift of 60 nm. With increased concentrations of CUR, a spectral shift of 4 nm was found towards the red region(Fig. 6B). Blue shift indicated the incorporation of CUR in the hydrophobic core while the slight redshift indicated the hydrophilic interaction with the neighboring protein residue. The association constant between BSA and CUR was found to be 6.52× 10⁵M-1with the binding site of 1.09. The values were in close approximation with the fluorescence quenching experiment.
The trend of initial blue shift followed by a red shift was also obtained for the SC-CUR interaction(Fig.6C,D and E).The initial significant blue shift of more than 5 nm in the SNP:BSA(1:1)SCCUR interaction indicated the large hydrophobicity provided by the nanoparticle. The corresponding binding number (n) and association constant (Ka) are shown in Table 3. The CUR binding towards the SC showed an insignificant change in its binding capacity. The association constant values between CUR and SC did not show a significant difference.
SNP:BSA(1:1)HC did not show CUR fluorescence enhancement with increased CUR concentration, leading to the inference that a limited hydrophobic pocket was available for binding CUR (Fig. 7).Results were similar to the fluorescence quenching experiment of SNP: BSA(1:1) HC - CUR interaction. SNP:BSA (1:5) and (1:9) HC,on the other hand, showed fluorescence enhancement with the increased CUR concentration, indicating the greater adsorption of protein on the nanoparticle surface (HC). An additional peak at 484 nm was observed for HCs. This peak may be attributed to the SNP emission peak. Accumulation of HCs to increase the BSA concentration for measurement purposes also increased the SNP concentration, which resulted in the 484 nm peak. Table 3 shows the association constant and the binding number for HC-CUR interaction. Increase in the Kavalue of HC in the order of 1:1 >1:5 >1:9 can be attributed to the hydrophobicity of SNP towards BSA, since previous reports of our laboratory have shown the hydrophobic interaction between the SNP and BSA [21]. This interaction leads to an increase in the surface hydrophobicity and consequently, the association constant between conjugates and CUR increases [39].
In the fluorescence enhancement experiment, the trends of SC and HC interaction with CUR were consistent with the BSA -CUR interaction for binding number and the association constant. The fluorescence enhancement experiment showed similar binding parameters as compared to the fluorescence quenching experiment. During the enhancement experiment of CUR, neither SNPBSA nor CUR was fluorescent at its excitation wavelength(430 nm). Fluorescence enhancement observed was purely from the CUR deposited in the hydrophobic core of BSA. It can be concluded that both the quenching and enhancement experiments showed a binding number of more than 1 and the association constant was in the order of 105.Based on the binding numbers,it can be concluded that approximately 356 molecules of CUR were bonded to each SNP:BSA (1:9) HC.

Fig. 6. Fluorescence enhancement spectra of (A) 20 μM CUR; (B) BSA-CUR; (C) SNP: BSA (1:1) SC-CUR; (D) SNP: BSA (1:5) SC-CUR and (E) SNP: BSA (1:9) SC-CUR conjugates.
3.6. Secondary structure study
3.6.1. FTIR spectroscopy
Any organic or inorganic compound having covalent bonds can absorb at different wavelengths in the infrared region and undergo a vibration or rotation. The vibrational portion of the infrared region ranges from 4000 to 400 cm-1.The absorption of the infrared region is a quantized phenomenon; therefore, a molecule absorbs only selected frequencies of IR radiation and undergoes stretching or bending vibration. Only the bonds with dipole moment are capable of absorbing such vibrational frequencies. Since no two molecules of the different structure have identical IR spectra,the IR spectrum can be used as a fingerprint. The other important use of infrared spectrum is to determine structural information about the molecule [40]. The IR spectra of protein are usually interpreted in terms of the vibrations of structural repeat,which give rise to nine characteristic IR absorptions. Amide I and amide II band are the major bands. Amide I bands are the sensitive vibrational bands of the protein backbone and are related to protein secondary structural components [41].
The characteristic fingerprint region was observed at 1656-1655 cm-1and 1549-1547 cm-1for protein amide I and amide II bands, respectively, where amide I band corresponded to C = O stretching mode and amide II corresponded to C - N stretching coupled with N - H bending modes [42]. The spectral shifting and intensity variations of the bands were observed in the SNP-BSA, BSA-CUR and SNP-BSA (1:1, 1:5 and 1:9) SC- CUR interactions. The peak shift and intensity variation indicated the interaction between the compounds.
Protein(BSA)amide I band and amide II band were observed at 1654 and 1549 cm-1, respectively. In Fig. 8 (first row- from left to right), there is a slight peak shift and reduction in the peak intensity. Thus, the effect of SNP on the secondary structure of BSA was minute. Table S1 shows the protein secondary structure quantification for SNP-BSA and SNP:BSA (SC) - CUR interactions.The interaction of CUR with BSA and SNP:BSA SC(1:1,1:5,1:9)was characterized for peak shift and the change in peak intensity. The peak shift was detectable at 2.5 μM CUR,which further shifted to a higher frequency with increased CUR concentration (Fig. 8). A significant reduction in the intensity of the protein amide I band at 5 μM CUR was observed;however,the intensity reduction of amide II band was inconsequential.
The spectral shifting of amide I and amide II bands indicated the binding of CUR to the protein C = O bond through hydrophilic contacts.Since the amide I band is related to the helicity of protein,any change in the intensity of amide I band gives an idea about the change in the helical component of the protein[41,42].From Fig.8(FTIR spectra), the decrease in the intensity of amide I band is evident in the case of CUR interaction with BSA as well as with SC.
Helical content of BSA decreased gradually with increased CUR concentration. As the CUR concentration increased from 0 μM to 20 μM, the alpha helicity of BSA reduced from 58.45% to 53.51%. However, BSA in the presence of SNP showed a slight reduction in the helix. Therefore, it indicates that 34 nm sized SNP did not significantly alter the BSA conformation. Previous reports have shown the effect of nanoparticle size on the secondary structure conformation of the protein. The smaller the size of nanoparticle, the lesser is the reduction in the helical content of protein [43].
3.6.2. CD studies
CD spectroscopy was employed to understand any structural changes that occurred in the case of HC.The alpha-helical contents were calculated using Equation (3) for HC. α helical content for native BSA was found to be 59.65%, which is comparable to the previously reported value[44].In the case of 1:1 HC,no detectable BSA peak was observed. Like SC, the alpha-helical content did not show any significant change upon SNP interaction.In the presence of CUR, the alpha-helical content reduced, as shown in Table S2.
Both FTIR and CD spectroscopy showed a consistent result for secondary structure perturbation.At higher CUR concentration,the helical content of protein reduced significantly. Upon interaction of BSAwithSNP(34 nm),therewas minimaleffecton the helical content of BSA.
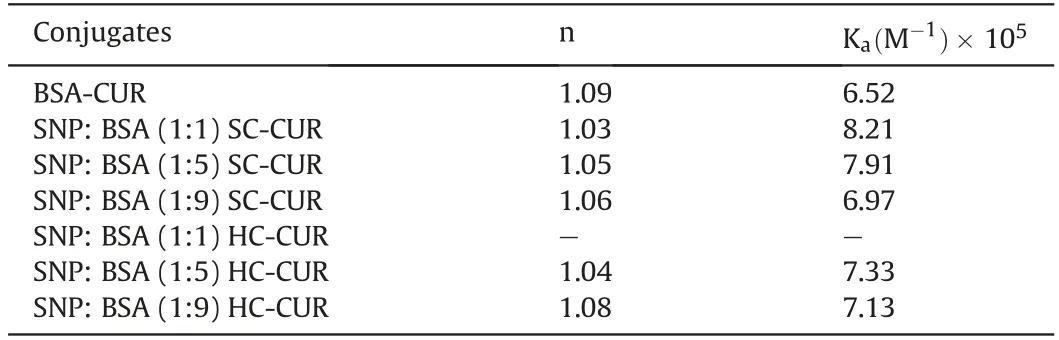
Table 3Binding number(n)and the association constant(Ka)determined using fluorescent enhancement studies.

Fig.7. Fluorescence enhancement spectra of(A)SNP:BSA(1:1)HC-CUR;(B)SNP:BSA(1:5) HC-CUR and (C) SNP: BSA (1:9) HC-CUR conjugates.
3.7. Energy transfer between the conjugates and CUR
F¨orster resonance energy transfer(FRET)occurs due to the longrange dipole-dipole interactions between donor and acceptor.FRET takes place when the emission spectrum of the donor molecule overlaps with the absorption spectrum of the acceptor.
The most important factor that determines the rate of energy transfer is the extent of overlap between donor emission and acceptor absorption spectra. Also, the quantum yield of the donor,the relative orientation of the donor and the acceptor transition dipoles and the distance between the donor and acceptor molecules affect the rate of transfer [45]. The efficiency of energy transfer is given by Equation (9).

Fig. 8. (A) FTIR spectra of BSA-CUR and SC-CUR conjugates, (B and C) CD spectra of 1:5 and 1:9 HC-CUR conjugates.
where F0and F are the fluorescence intensities in the absence and presence of an equal amount of acceptor,r is the distance between the bound ligand and the tryptophan residue. Since BSA contains two tryptophan residues(Trp-135 and Trp-214),r gives the average value of the distance between the ligand and the two tryptophan residues. R0is the F¨orster critical transfer distance between the donor and the acceptor, which signifies that the electronically excited donor molecule relaxes by fluorescence and by transferring energy to the acceptor with equal probability. R0(in cm) can be calculated using Equation (10).

QDis the quantum yield of the donor in the absence of acceptor(1.50 for BSA),n is the refractive index of the solvent,which is equal to 1.36,K2is the constant that reflects the relative orientation of the electronic dipoles and has a value of 2/3 considering random orientation in the fluid, andJis the integral overlap, which is a measure of spectral overlap of the fluorescence spectrum of donor and the absorption spectrum of the acceptor.Jvalue reflects the resonance that is required for efficient energy transfer between the donor emission and acceptor absorption.J(M-1cm3) is given by Equation (11).

where F(λ)is the fluorescence intensity of the donor at wavelength λ, and ε(λ) is the molar extinction coefficient of the acceptor at wavelength λ.
Fig. 9 shows the considerable spectral overlap between the fluorescence emission of free protein and absorption spectrum of CUR. Table 4 shows the energy transfer measurements for equimolar donor and acceptor molecule.E and r values for the BSA-CUR conjugates and SC-CUR did not change significantly, which confirmed that the binding site of CUR on the BSA did not change.Energy transfer efficiency and the distances measured were found to be close to the previous results [37]. In the case of HC, the distance between the ligand and the tryptophan residue increased slightly with a subsequent decrease in energy transfer efficiency,indicating a slight modification in the BSA present in HC.However,in SC and HC,the r value less than 7 nm indicated the non-radiative energy transfer mechanism for quenching [46]. The relatively smaller value of r and the large value of E together suggested the binding interaction between CUR and the conjugates.This indicates the closer proximity of the tryptophan residues to CUR. According to docking studies, the primary binding site for CUR is located in subdomain IB of BSA,closer to Trp 134[47].Therefore,the observed result showed a strong association constant between CUR and conjugates.
3.8. CUR degradation study
3.8.1. Degradation of CUR
CUR is highly susceptible to light,due to which the investigation was performed under dark conditions. In each conjugate, the CUR concentration was quantified with time, as shown in the timedependent plot (Fig. S3). The CUR degradation was measured for the equimolar concentration of CUR and BSA in the conjugates.
UV visible spectra of CUR at physiological pH are shown in Fig. S3A. Peak was observed at 259 nm, which indicated the formation of degraded product of CUR.Even at 0 h,the peak at 259 nm was evident. At longer time interval, a constant increase in the concentration of the degraded product was observed with a simultaneous decrease in the CUR peak (424 nm). In addition,another shoulder peak at 362 nm appeared with time [48]. After 6 h, the concentration of CUR present was 18.01%.
When CUR was conjugated with BSA its degradation was drastically reduced. Therefore, no significant peak was observed at 259 nm; however, a sight shoulder was detected at 362 nm at a longer time interval.No significant peak shift at 278 nm suggested higher stability of CUR due to the hydrophobic core of BSA. After 6 h, the concentration of CUR in the reaction mixture was 71.68%.
CUR degradation was investigated in the presence of SNP.Upon incubation with SNP(0.16 nM),nearly 80%degradation of CUR was observed within 30 min(Fig.S3F).In SNP:BSA(1:1)SC,a significant decrease in the CUR peak was observed during the first hour. This may be due to the degradation of CUR due to uncovered nanoparticle surface. The blue shift from 278 nm with time suggested the formation of a large amount of degraded product (inset of Fig. S3C). SNP: BSA (1:5) and (1:9) SC showed lesser CUR degradation.The peak at 278 nm peak inset of Figs.S3D and E showed no change.This could be attributed to the partially and fully saturated nanoparticle surfaces, respectively. The amount of CUR present in 1:1, 1:5 and 1:9 SNP: BSA SC after 6 h was 47.73%, 56.12% and 68.22%, respectively.
In the case of HC,CUR fluorescence intensity peaks were used to determine the rate of CUR degradation and half-life. After 6 h of observation, the CUR concentration was 32.54% in SNP: BSA (1:5)HC and 41.36% in SNP: BSA(1:9) HC (Fig. S4).
CUR degradation with time provides a variety of productsviz.,bicyclopentadione, vanillin, ferulic acid, feruloyl methane, etc.Vanillin,ferulic acid and feruloyl methane were found to be minor products, as reported by Wang and co-workers [49]. Vanillin has been widely reported to have various pharmacological activities such as antioxidant, antimutagenic, anticarcinogenic and antiangiogenic activities [50]. However, other stable products of CUR like bicyclopentadione do not have anticancer effects [51,52].Therefore, CUR protection from degradation is of prime importance.SNP-BSA(1:9)HC conjugates protected approximately 50%of the CUR even after 6 h.

Table 4F¨orster critical distance (R0), the binding distance from tryptophan residue (r),overlap integral (J) and energy transfer efficiency (E) for interaction of CUR with different conjugates.

Fig.9. UV-Vis absorption(dash lines)and fluorescence emission(solid lines)of conjugates containing CUR as ligand and BSA as protein in different conjugates.λex=295 nm.For SCs, [BSA] = [CUR] = 15 μM. For 1:5 and 1:9 HC, [CUR] is 0.4 μM and 0.6 μM respectively.
3.8.2. Rate constant and half-life
Alkaline degradation of CUR follows a pseudo first order kinetic[53].The rate constant(k)and half-life(t1/2)of CUR were estimated for an equimolar concentration of CUR and BSA present in each conjugate.The plot of ln[Ao/A]versus time yields a rate constant k,where Aois initial CUR concentration and A is CUR concentration at time t (Fig. S5). The half-life of CUR was calculated using equation t1/2= ln2/k.
Table S3 shows rate constants(k)and half-life(t1/2)of CUR for all conjugates at pH 7.4. The rate of CUR degradation was high in phosphate buffer of pH 7.4 with a half-life of 1.8 h. The half-life of CUR in the presence of SNP(0.16 nM)was lowest,but in the presence of BSA it was found to be the highest. As the concentration of BSA adsorption on SNP increased from 1:1 to 1:9 SNP:BSA conjugates,the rate of CUR degradation reduced sharply. As a result,both SNP:BSA(1:5) and (1:9) conjugates showed significant improvement in the half-life of CUR as compared to SNP:BSA(1:1)conjugates.
HC exhibited a higher rate of CUR degradation (0.2077 h-1for 1:5 and 0.1766 h-1for 1:9) as compared to the SC (0.0850 h-1for 1:5 and 0.0563 h-1for 1:9)(Table S3).This could be due to the loss of extra protection that was provided by the unbound protein of SC.However, half-life of CUR in SNP: BSA (1:5) and SNP:BSA (1:9) HC were found to be better than CUR alone.
The kinetic studies of CUR are significantly important because CUR loaded onto nano-based carriers has to traverse at physiological pH through the extracellular environment of the cancer cell and finally enter its intracellular environment. Most cancers,regardless of their tissue origin, have a higher intracellular pH(pHi = 7.4) and lower extracellular pH (pHe of 6.7-7.1) [54,55].Conjugates have to spend most of their time in the environment with pH 7.4. SNP:BSA (1:9) HC conjugates decompose to half of their initial value in approximately 4 h.HC was also analyzed at pH 6 (data not shown) and was found to degrade with lower rates;thus, it may prove to be more effective. Previous data have also reported a similar conclusion about the degradation of CUR at lower pH [11].
3.9. Stability of SC and HC loaded with CUR
In a biological medium, nanoparticles adsorb protein and undergo aggregation due to which their stability is compromised.This may further lead to cluster formation in blood vessels and occlude blood flow, resulting in micro-infarction [56]. Therefore, the stability of the drug conjugates must be investigated before their administration into the system.Stability of the prepared conjugates was studied and found to be high(Fig.10).
Certain properties of metallic (silver, gold, iron oxide) nanoparticles such as surface plasmon resonance, controlled size,monodispersity, and stability. are well known. Other classes of nanoparticles(liposomes,dendrimers,micelles,etc.)do not possess such properties. To improve the stability, such nanoparticles are often coated with various polymers. Mendes et al. [57] have modified the surface of liposomes with 0.1% and 0.5% polyethyleneimine (PEIPOS); however, the zeta potential value of 0.1%PEIPOS (+1.9 mV) and 0.5% PEIPOS (+13.7 mV) showed low and moderate stability, respectively. In another report, Hyun et al.[58]reported surface modified the polymer nanoparticle with albumin for enhancing drug delivery to solid tumors, but these conjugates,too,reflected moderate stability with a zeta potential value of-12 mV.Apart from stability,many nanoparticle drug delivery systems are sized >100 nm,making them fall in the sub-micrometre range[58,59]. The present investigation reports conjugates prepared to possess high stability and true nanometer size.
Metallic nanoparticles are advantageous because of their biocompatibility and versatility when it comes to surface functionalization.There is also a need of nanomedicines that are simple and do not require the use of toxic solvents. Such nano-medicines offer a clear advantage over conventional and complex drugs. The present SNP:BSA conjugates are simple in their manufacturing process and have been thoroughly studied for their interaction with CUR. Glycoprotein like gp60 and SPARC (Secreted Protein, Acidic and Rich in Cysteine) are the albumin receptors overexpressed in cancer cells. Therefore, SNP-BSA based nano-carrier is definitely advantageous. Albumin binding to the gp60 undergoes caveolinmediated transcytosis [20]. Recently, Kumari et al. [60] have reported the interaction of SNP:BSA conjugates with glycans present in the gp60 glycoprotein, which strongly supports the importance of the present investigation.
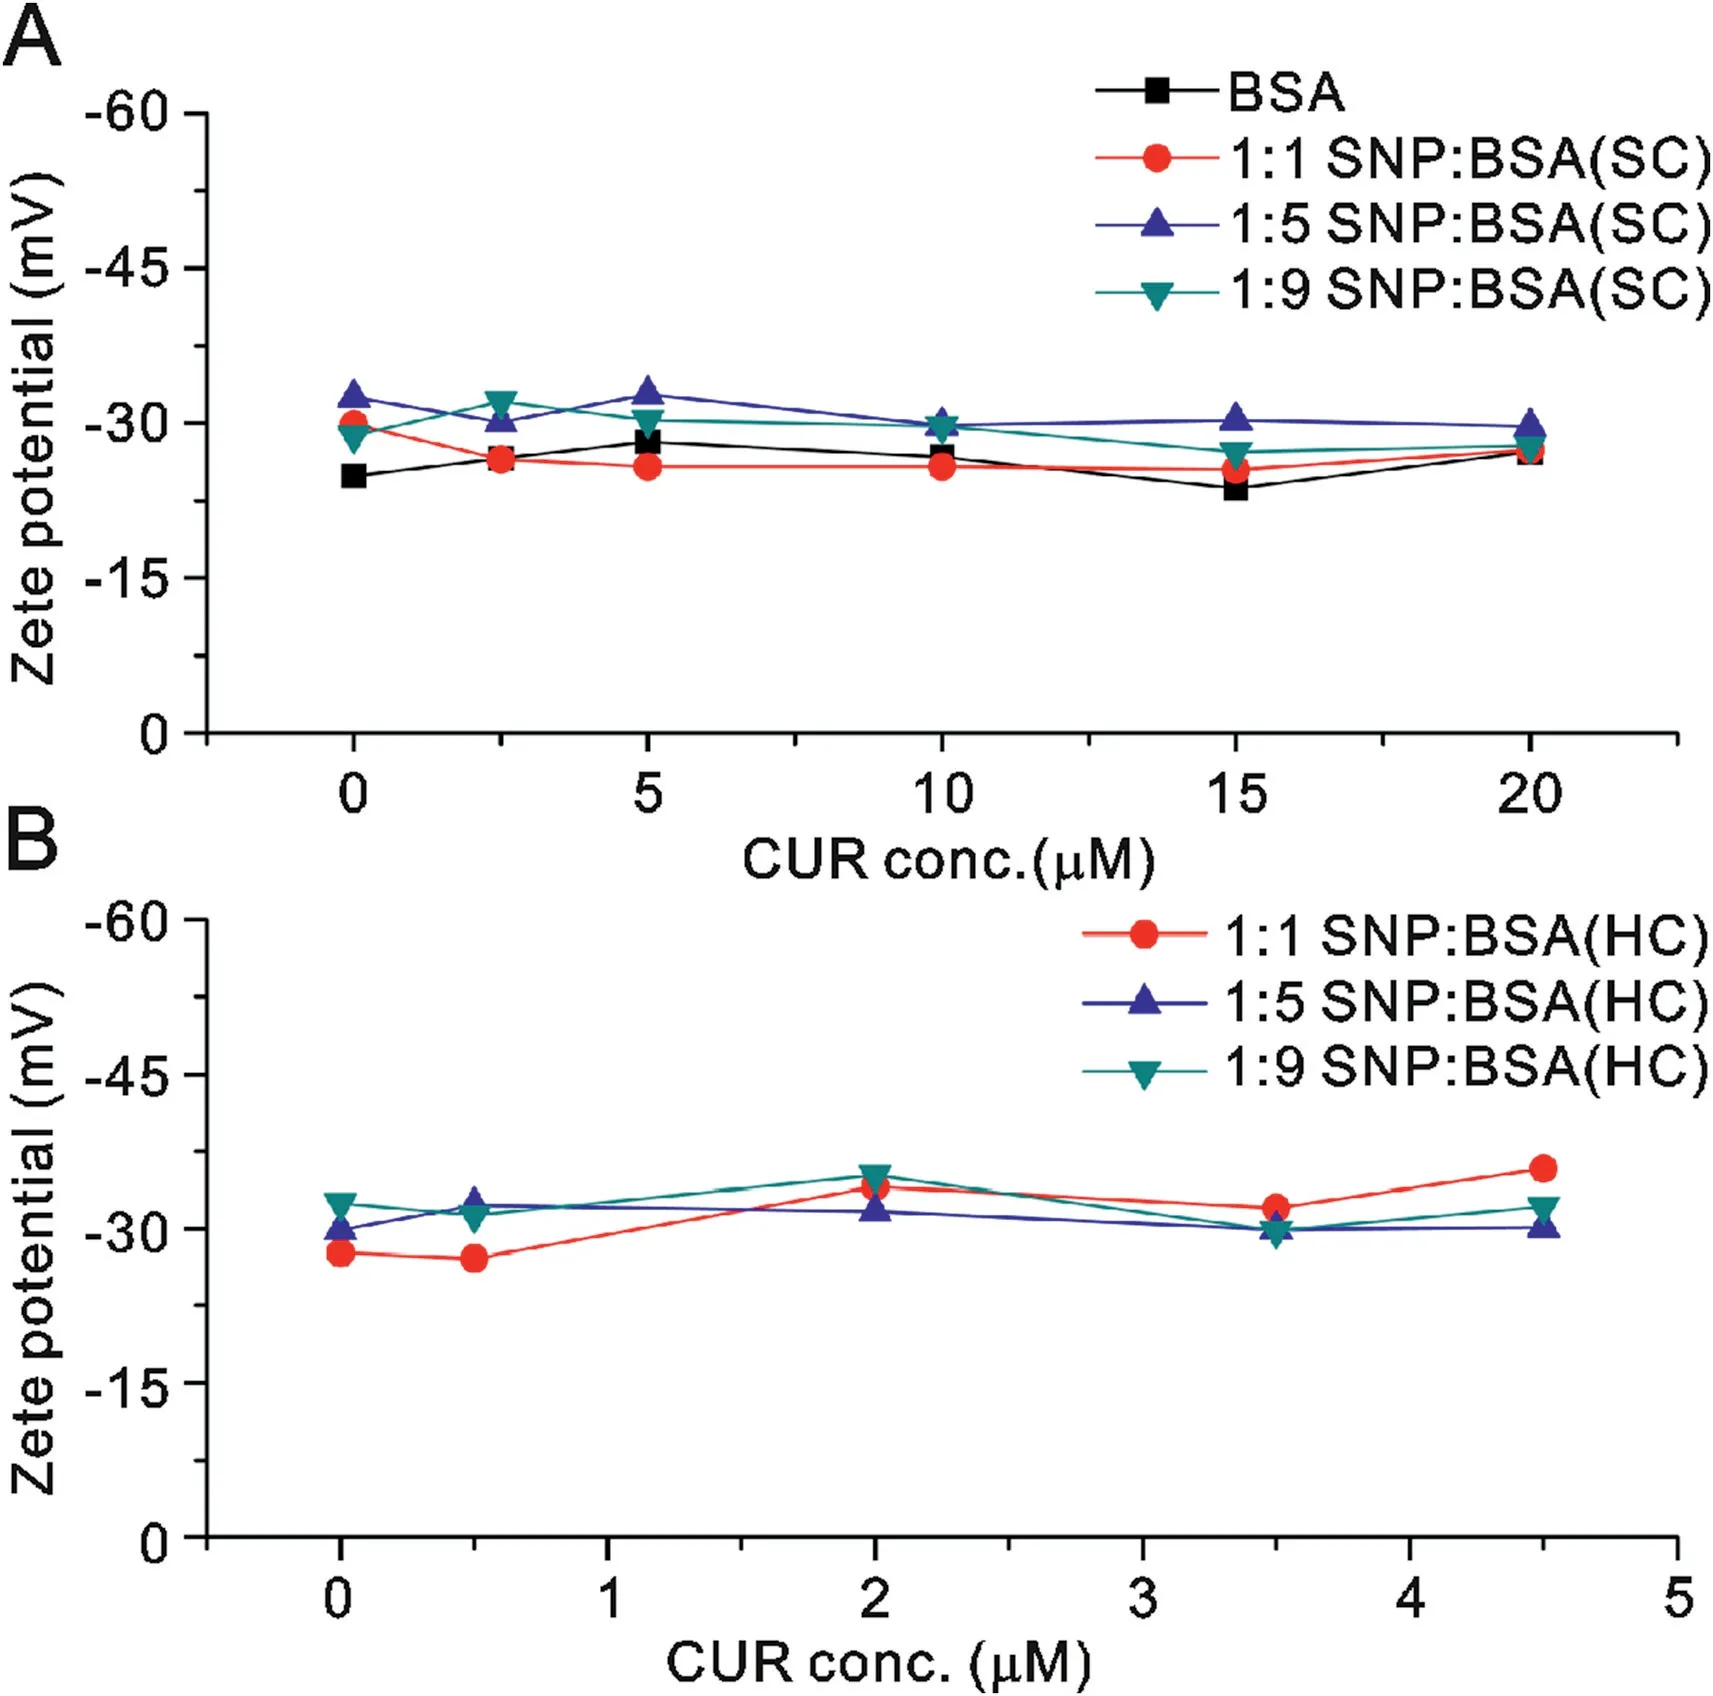
Fig.10. Zeta potential analysis of the SC and HC with curcumin.
4. Conclusions
The study provided a comprehensive report of the interaction between CUR and SNP:BSA conjugates. The fluorescence experiments indicated that the key forces responsible for this interaction are hydrophobic and hydrophilic in nature.FTIR studies confirmed the hydrophilic interaction between CUR and neighboring residues.Fluorescence enhancement studies showed a slight difference in the association constant between SCs and HCs. The distance between the ligand and tryptophan was determined. HC showed an increase in the distance between CUR and tryptophan residue.FTIR and CD spectroscopy revealed a decrease in the helical content of adsorbed BSA with increased CUR concentration. Degradation studies indicated an increase in the half-life of CUR when it was in contact with the hydrophobic pockets of adsorbed BSA.The half-life of CUR in HC significantly improved as compared to CUR alone.SNP:BSA(1:9)HC was better than all the tested HCs for its protein adsorption capacity, improved binding number and association constant for CUR. Therefore, based on the results of adsorption capacity and binding number,approximately 356 molecules of CUR can be bonded onto the SNP: BSA (1:9) HC. SNP:BSA (1:9) HC showed better protection and improved half-life of the CUR molecules.
Conflicts of interest
The authors declare that there are no conflicts of interest.
Acknowledgments
This work was supported by the DST PURSE, government of India, 2016.
Appendix A. Supplementary data
Supplementary data to this article can be found online at https://doi.org/10.1016/j.jpha.2020.02.004.
 Journal of Pharmaceutical Analysis2020年2期
- Journal of Pharmaceutical Analysis的其它文章
- Recent advances and perspectives of nucleic acid detection for coronavirus
- Molecular immune pathogenesis and diagnosis of COVID-19
- Hollow fiber-based liquid phase microextraction followed by analytical instrumental techniques for quantitative analysis of heavy metal ions and pharmaceuticals
- Quantitative computed tomography analysis for stratifying the severity of Coronavirus Disease 2019
- Erucic acid from Isatis indigotica Fort. suppresses influenza A virus replication and inflammation in vitro and in vivo through modulation of NF-κB and p38 MAPK pathway
- Metabolic profiling of four synthetic stimulants, including the novel indanyl-cathinone 5-PPDi, after human hepatocyte incubation