
Phylogeny and Biogeography of Common Toad (Bufo bufo) in Xinjiang,China
2021-06-30 14:03SiqiWANGChunxiaXUJiaqiZHANGSupenWANGXuanLIUXuejiaoYANGandYimingLI
Asian Herpetological Research 2021年2期
Siqi WANG,Chunxia XU,Jiaqi ZHANG,Supen WANG,Xuan LIU,Xuejiao YANG and Yiming LI*
1 Key Laboratory of Animal Ecology and Conservation Biology,Institute of Zoology,Chinese Academy of Sciences,Beijing 100101,China
2 University of Chinese Academy of Sciences,Beijing 100049,China
Abstract The common toad,Bufo bufo (Linnaeus,1758),is widely distributed in Europe and parts of Africa.Previous studies of the genetic relationships among B.bufo populations have not included Asian populations.Here,we investigated the phylogenetic relationships of B.bufo,including a population from Xinjiang,China,using 722 bp of the mitochondrial cytochrome b sequence and identified six subclades and 85 haplotypes in populations from 22 countries.Phylogenetic analyses and pedigree differentiation revealed that the subclade containing the Xinjiang population has undergone a relatively recent expansion.Combining our results with those of previous studies,we found that the common toad population of Xinjiang,China,belongs to the European-Caucasian lineage and that its closest relatives based on phylogenetic relationships were eastern European populations.Our research contributes to expanding knowledge of the geographic distribution of B.bufo and illuminates the lineage and genetic relationships of the B.bufo population in Xinjiang,China.Future research should continue to update the geographic distribution of B.bufo and complete a genetic investigation of the full range of this species.
Keywords distribution,genetic distance,genetic structure,haplotype,mitochondrial DNA,phylogenetic tree
1.Introduction
The common toad,Bufo bufo
(Linnaeus,1758),is widespread in Europe,except Ireland,Iceland and some Mediterranean islands,and is also distributed in the western parts of North Asia and a small part of Northwest Africa (Lüscheret al.
,2001;Silleroet al.
,2014).The evolutionary history of this species has been controversial,and its species delimitation and phylogeography has recently been revealed at the continental,national and regional scales (Arntzenet al.
,2013;Cossuet al.
,2018;Garcia-Portaet al.
,2012;Özdemiret al.
,2020;Recueroet al.
,2012;Tuncayet al.
,2018).Garcia-Portaet al
.(2012) studied 304 samples from 164 populations covering most of the distribution range of theB.bufo
species complex in the Western Palearctic.Studies show that theB.bufo
species complex encompasses three main lineages:the Caspian lineage,the Iberian-African lineage,and the European-Caucasian lineage.AlthoughB.bufo
has been studied in areas where it is widely distributed,phylogeographic analyses of this species from some geographical areas,including Asia and specifically China,have never been included.B.bufo
was discovered in Habahe County,Altay Prefecture,Xinjiang Uygur Autonomous Region,China,in late summer 2005 (Shiet al.
,2005),and thus far,it is the only place in China where the common toad has been reported.However,there is limited information or historical data available to reveal the lineage and genetic relationships of the common toad in Xinjiang,China.B.bufo
is a widespread and adaptable species present in coniferous,mixed and deciduous forests,groves,bushlands,meadows,arid areas,parks and gardens.It usually inhabits damp areas with dense vegetation,and large open areas are generally avoided.The species spawns and larval development takes place in still waters and slow-moving parts of rivers and streams.It is present in many modified habitats (IUCN,2020).In the Xinjiang region of China,basins are surrounded by high mountains,oasis and desert are intertwined,and the geographical environment of forests,grasslands and lakes (Wanget al.
,2006) is suitable for the survival and reproduction of a common toad population.Habahe County,Altay,is at the northwesternmost edge of Xinjiang,bordering Russia in the north.It is located at the same latitude as France,Romania and other European countries,and the similar latitudes may cause these areas to enjoy similar climatic characteristics.This similar climate and suitable habitat are likely to have allowed the common toad to migrate from Europe to East Asia in the distant past.To investigate the phylogenetic information of the common toad found in Xinjiang,our laboratory working group conducted two scientific investigations in Altay Prefecture,Xinjiang,China,in 2014 and 2018,and successfully collected adult toad specimens.Previous researches has shown that genetic divergence can be used to determine whether individuals and populations belong to the same or separate evolutionary lineages (Ferguson,2002) and can indicate the level of connectivity among populations (Blairet al.
,2013;Dubeyet al.
,2011).Therefore,the informative mitochondrial cytochrome b (cytb) gene was selected to perform phylogenetic analysis and genetic structure analysis using new and previously published data.2.Materials and Methods
2.1.Sampling
Surveys were carried out in Xinjiang Uygur Autonomous Region in late summer of 2014 and 2018.Fifty-eight samples across three localities were used for the phylogenetic analysis.The third toe of the right hind foot from each postmetamorphosis common toad was clipped if they were available,and the tissue samples were preserved separately in 95% ethanol and stored at -20°C in the laboratory.In this study,our laboratory extracted 58 common toad sequences from Xinjiang,China,and obtained all published sequences ofB.bufo
among a total of 262 cytb sequences from NCBI,along with three outgroup sequences.Three sequences in the gene library had inconsistent lengths and were not included in the analysis.The locality and voucher data for sequences used in our analysis are given in Table S1.The outgroups consisted ofBufo gargarizans gargarizans
,Bufo bankorensis
,andBufo japonicus formosus
,based on Recueroet al
.(2012).2.2.DNA extraction and amplification
In the laboratory,genomic DNA was extracted using the Universal Genomic DNA Kit (catalogue no.CW2298M;Beijing,CoWinBiotech Co.,Ltd,Beijing,China) and following the manufacturer’s instructions.To infer the putative geographic origin of the sampled individuals,we amplified one diagnostic mitochondrial marker,corresponding to a portion (722 bp) of the proteinencoding cytb region,using published primer pairs (Palumbiet al.
,1991;Recueroet al.
,2012).The amplification conditions were 5 min at 94°C;35 cycles of 30 s at 94°C,30 s annealing at 48°C,and 30 s at 72°C;and a final 10 min at 72°C.The PCR products were then separated by electrophoresis on 2% agarose gels.The resulting PCR products were directly sequenced by Tsingke Company (Beijing,China) using the same primers used for amplification.The obtained sequences were compared with the available homologous sequences from GenBank (https://www.ncbi.nlm.nih.gov/) using the Basic Local Alignment Search Tool (BLAST,http://blast.ncbi.nlm.nih.gov/Blast.cgi) with the default parameters.Sequencing data are available at NCBI under accession numbers from MT499388 to MT499445 (Table S1).2.3.Data analysis
The mitochondrial cytb gene sequences were aligned with reference sequences from Recuero and Arntzen using the ClustalW (Thompsonet al.
,1994) Multiple alignment program,which automatically applies gaps and sliding alignments,in BioEdit 7.2.5 (Hall,1999).The haplotype distribution,number of all sequences,number of sequence sites in a sample (S),number of haplotypes (NOH),haplotype diversity (Hd) (Nei,1987),sequence diversity (K) and nucleotide diversity (π) (Nei and Tajima,1981) of each population were estimated using DnaSP ver.6.13.03 (Rozaset al.
,2017).In addition,to study the degree of differentiation between populations and the amount of gene flow,DnaSP ver.6.13.03 was also used to calculate the differentiation parameter Fst between populations (Weir and Cockerham,1984).Uncorrected pairwise sequence divergences (p-distances) between paired populations were calculated in MEGA v7 (Kumaret al.
,2016).Arlequin 3.11 software was used to calculate the Tajima’s D (Tajima,1989) and Fu’s Fs (Fu and Li,1993) of each population and perform a molecular variation analysis (AMOVA) among populations and clades to calculate the genetic structure and population genetic variation distribution (Excoffier and Lischer,2010).Arlequin was also used to calculate the raggedness index,R(Ramos-Onsins and Rozas,2002),Fu’s Fs value,Tajima’s D and sum of squared occurrences (SSD) value of each progressive branch to detect population expansion (Harpending,1994).Based on the observed mismatch distribution and the expected value under rapid expansion,the SSD value showed a significant indication of population stability without expansion.
Mismatch distribution analysis and estimation of parameters were performed using Arlequin 3.11 software (Excoffier and Lischer,2010).The mismatch distribution graphs were drawn with DnaSP ver.6.13.03 (Rozaset al.
,2017).Selftesting of the saliency hypothesis was repeated 1000 times to infer dynamic changes in the historical population number.By examining whether the mismatch distribution curve of the population was a single or multipeak type and whether it deviated from the neutral test,we could speculate whether the population had expanded in the past.If the general population has undergone expansion or sustained growth in the past,its mismatch distribution curve presents a single-peak Poisson distribution,and the Tajima’s D neutral test shows a significant deviation from neutral mutation (Slatkin and Hudson,1991).However,when the population size has been stable,the mismatch distribution curve shows a multipeak distribution,and the Tajima’s D value is not significant (Schneider and Excoffier,1999).Low Tajima’s D values and a neutral distribution of pairing differences indicate an ancient population expansion.The haplotypes of the cytb sequences were subjected to three types of phylogenetic analysis using MEGA v7 software (Kumaret al.
,2016) and the Kimura-2-Parameter distance measurement (estimated gamma,α=0.32):the distance-based neighbor-joining (NJ) (Saitou and Nei,1987),maximum likelihood (ML) (Kimura,1980),and minimum evolution (ME) (Rzhetsky and Nei,1992) methods.The robustness of each phylogeny was assessed by the percentage of 1000 bootstrap (BS) resamplings (Felsenstein,1985).Phylogenetic analyses of the haplotypes were also conducted using Bayesian inference (BI).BI analyses were performed in MrBayes 3.2.7 (Ronquist and Huelsenbeck,2003).Each analysis used four heated Markov chains (using the default heating values) that were run for 1 million generations.Trees were sampled every 1000 generations,and a consensus tree was calculated after omitting the first 1000 trees as burn-in.Relationships among the haplotypes were visualized by reconstructing a median-joining network by Network 5.0.1.1 (Bandeltet al.
,1999).3.Results
3.1.Haplotype diversity and genetic diversity
Overall,a total of 320 sequences with a length of 722 bp were used (including three outgroup sequences) (Table S1 and Figure 1).For 317 sequences ofB.bufo
,among the 722 loci,625 were conserved and 97 were variant sites (including 58 simple information sites and 39 single base variant sites).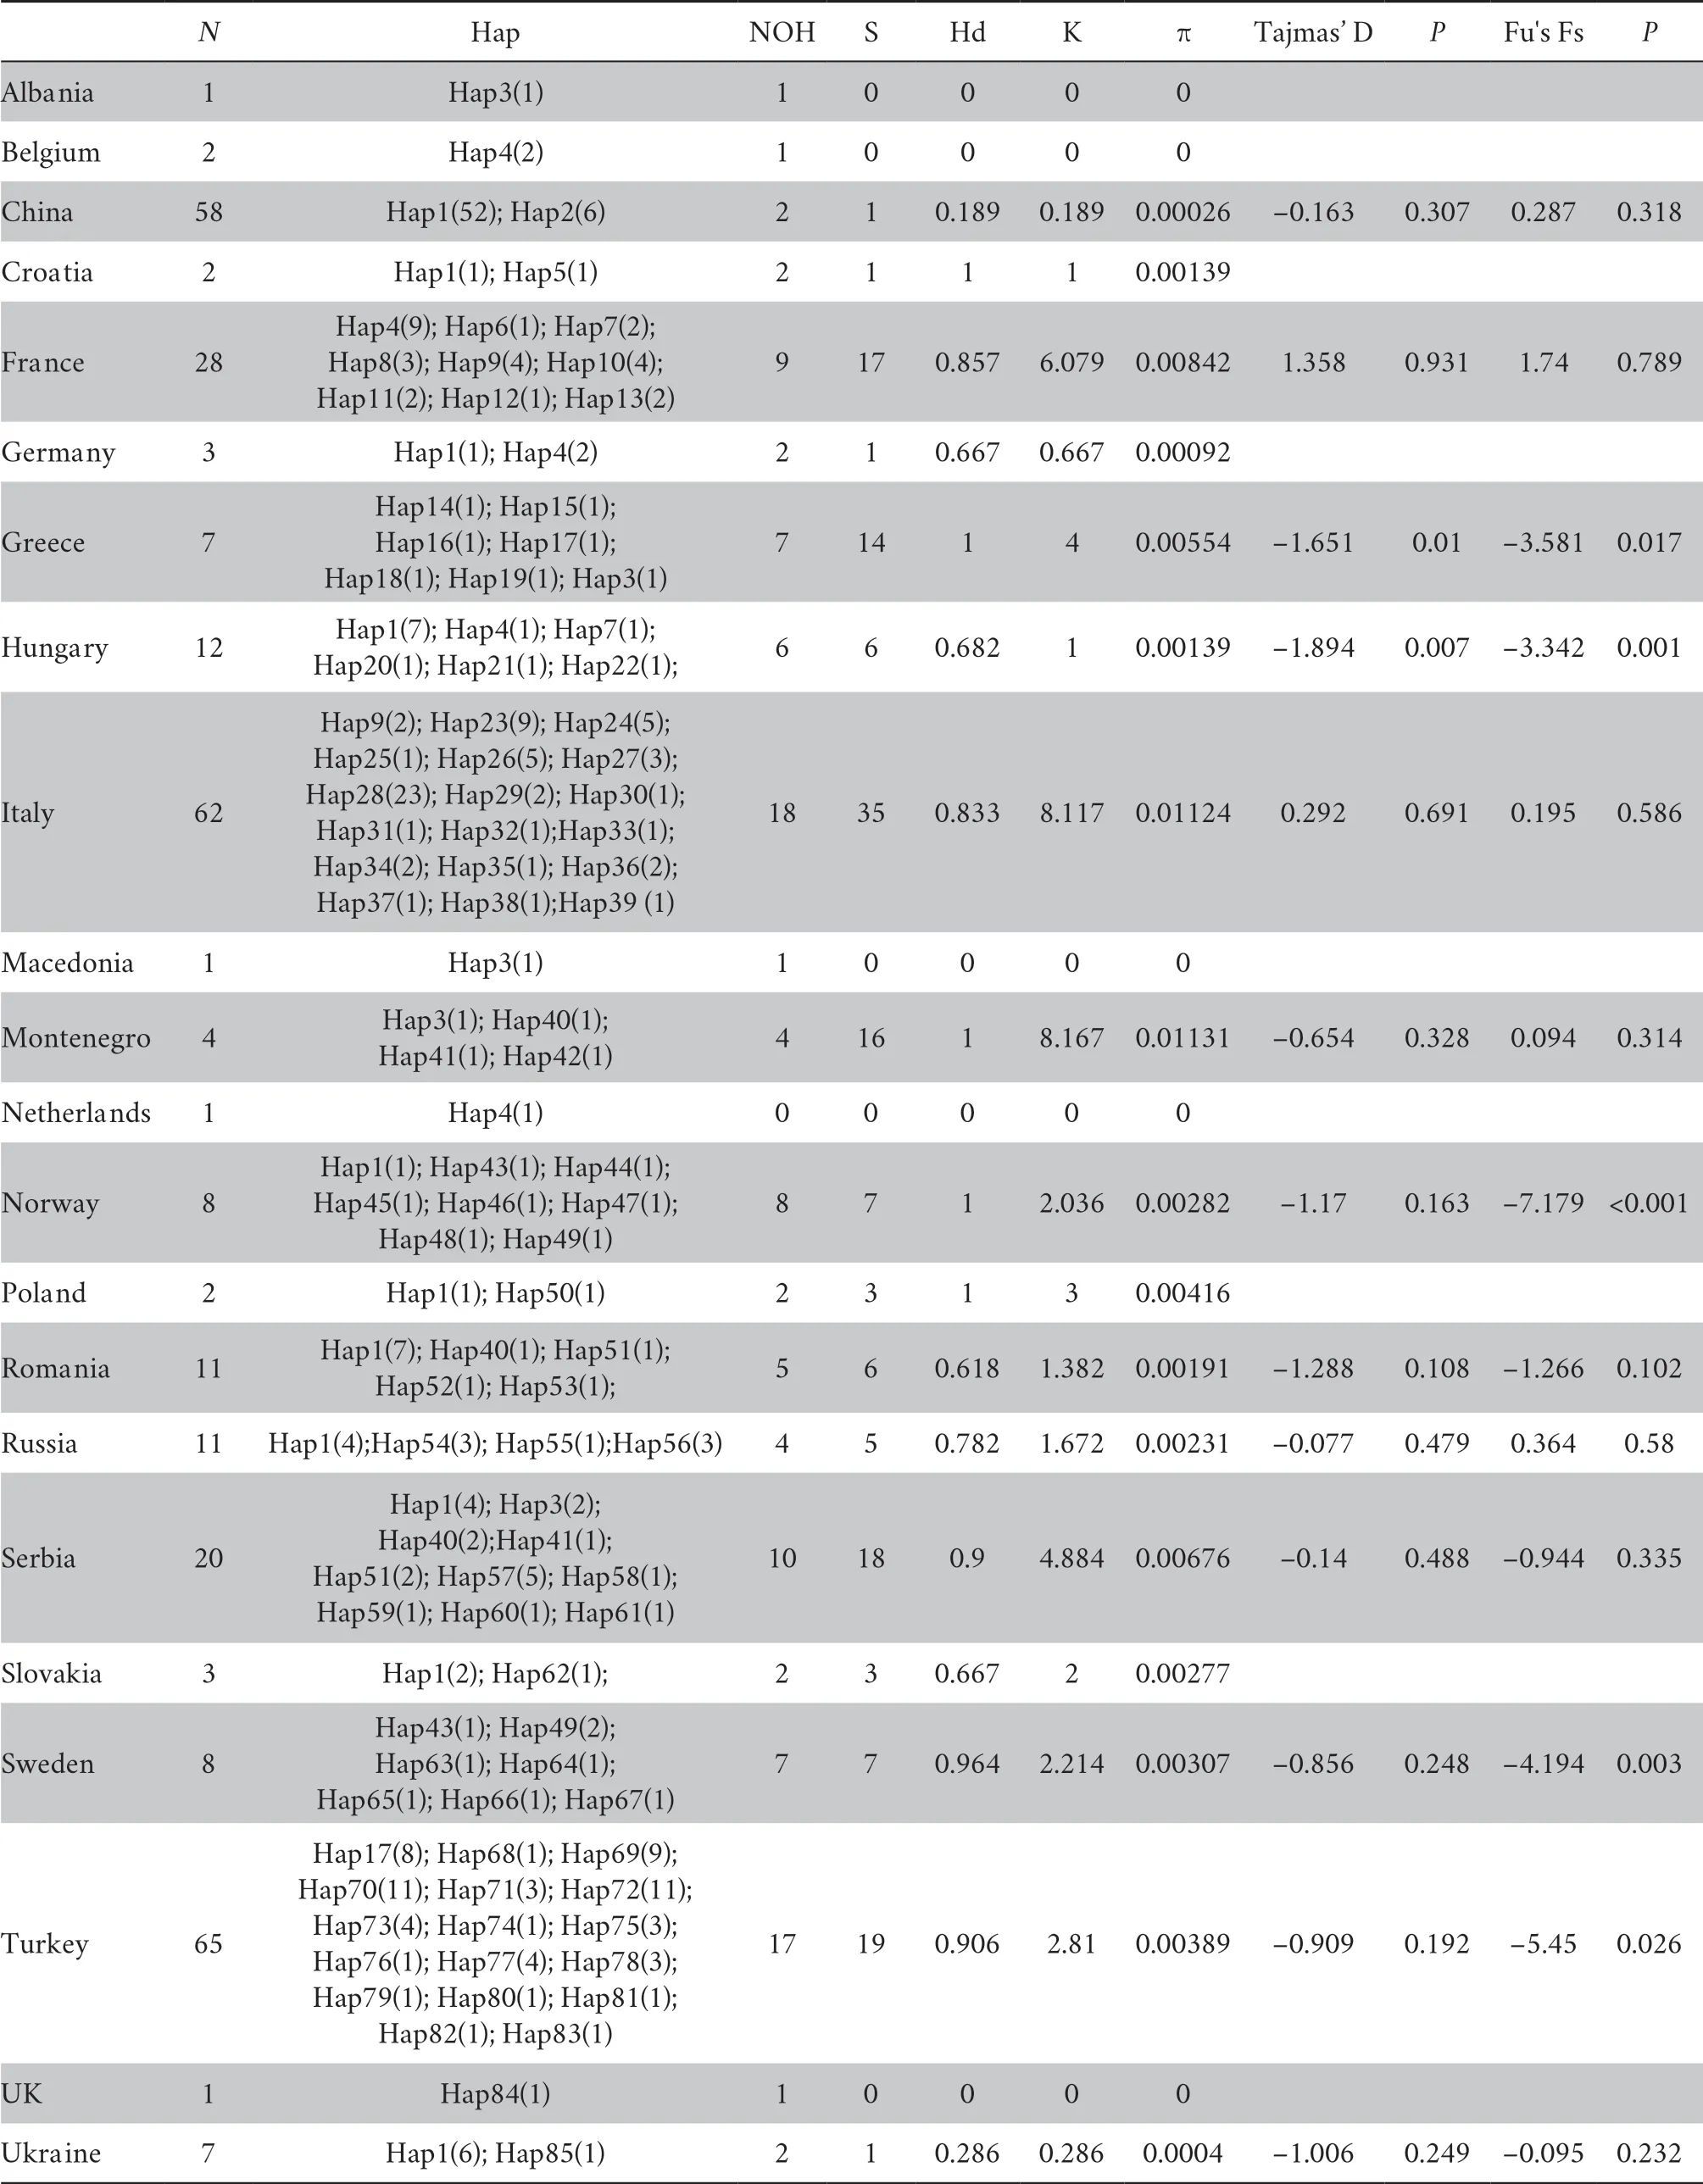
Table 1 Diversity indices and population expansion statistics of B.bufo.
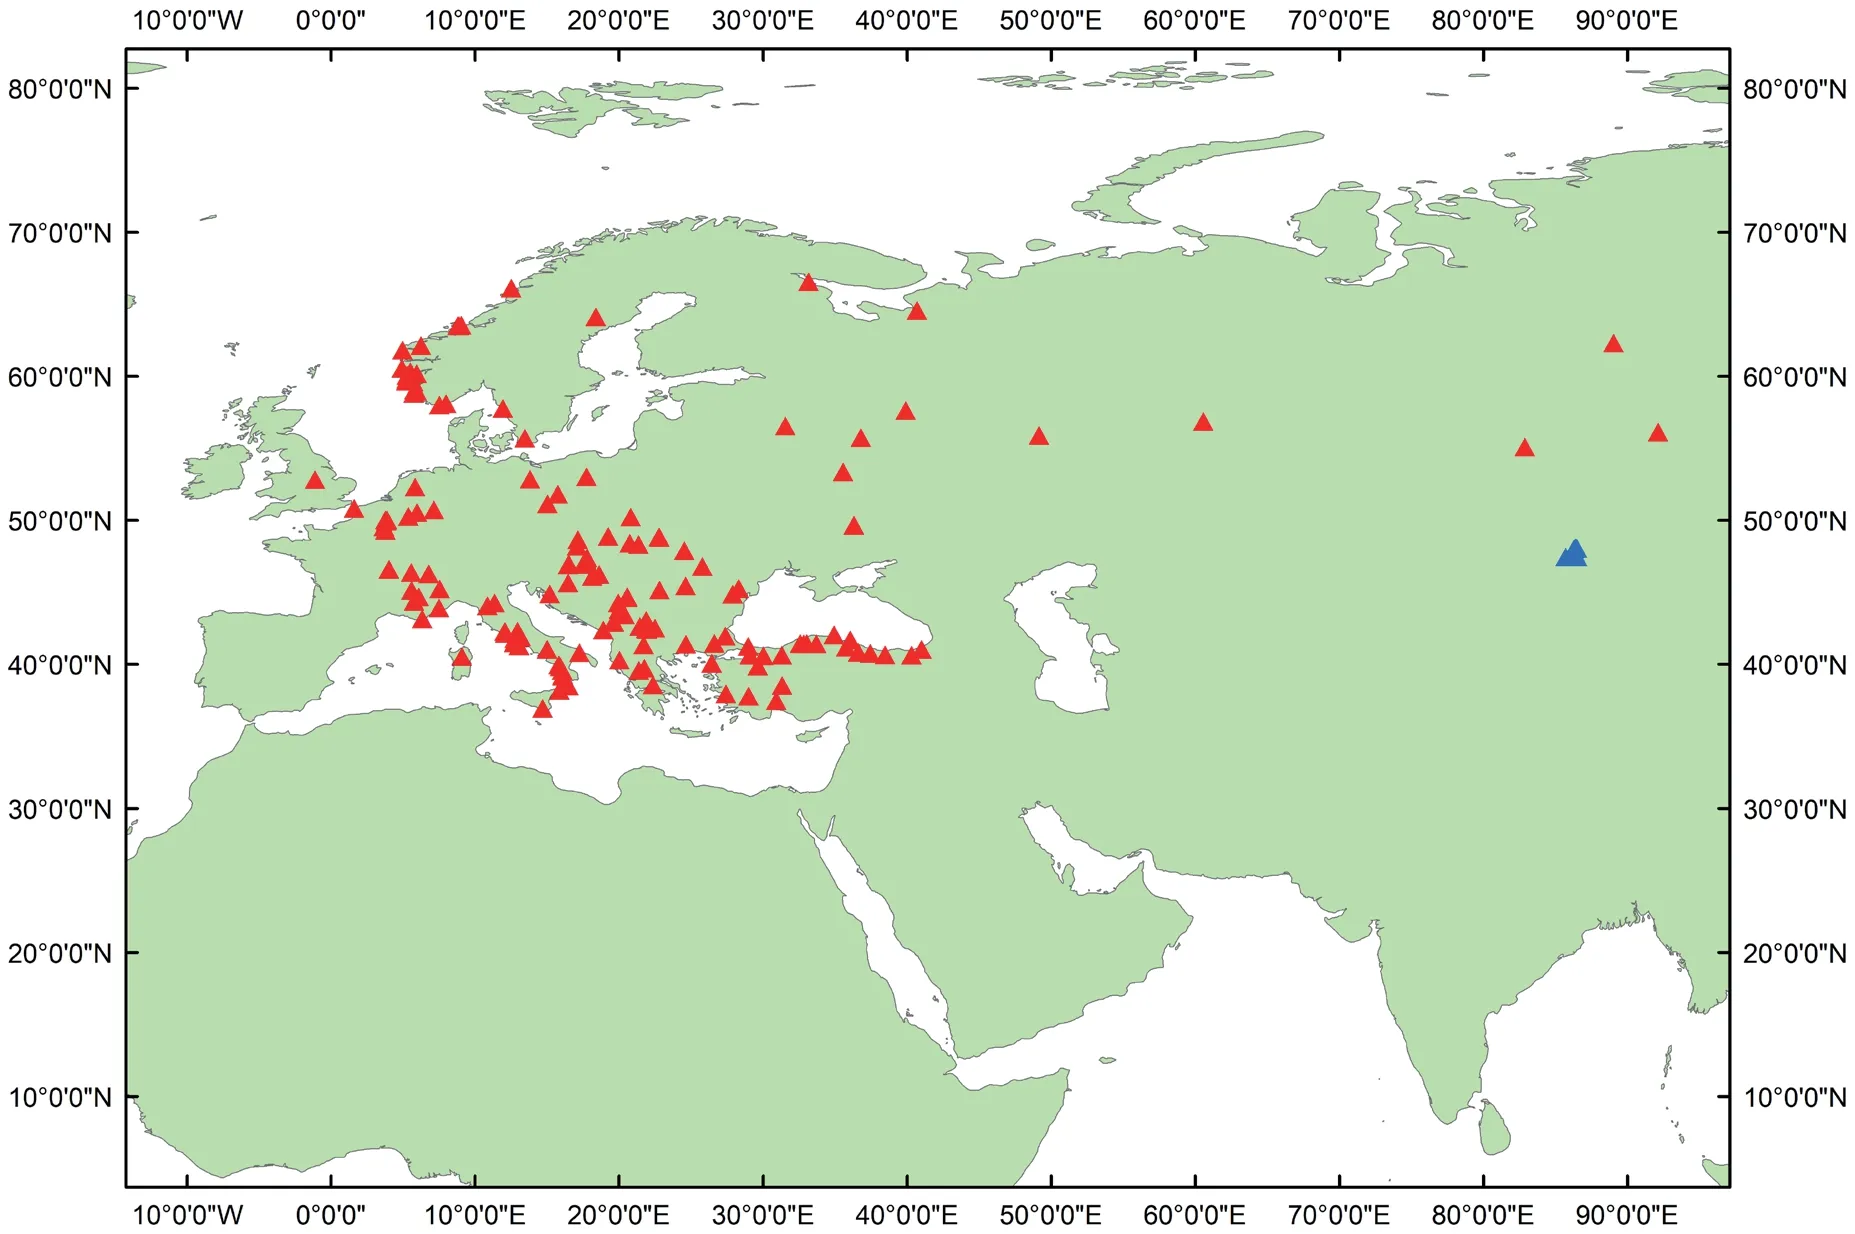
Figure 1 B.bufo sampling localities included in the present study.Red triangles indicate the sampling localities in NCBI and other studies;blue triangles show the new found localities in China.
The haplotype diversity (Hd),nucleotide diversity (π),and sequence diversity (K) of 22 different geographic populations are presented in Table 1 (outgroups excluded).Haplotype partitioning was performed for 317 cytb gene sequences,and a total of 85 haplotype sequences were obtained,among which 74 (87.06%) were unique and most appeared in only a single geographical population.A total of 12.94% of the haplotypes were shared and had a higher frequency.Of the 22 populations,17 contained haplotype polymorphisms.The Italian population contained 18 haplotypes followed by Turkey,while the Xinjiang population in China contained only two haplotypes,of which haplotype 2 was the unique haplotype,and haplotype 1 contained the largest number of samples.
Among all the populations,the sequence and nucleotide diversities were higher for the French population,Montenegro population,and Italian population than the other in situ populations,respectively.For China’s Xinjiang population,these two indicators were far lower than the other geographic populations at 0.189 and 0.00026.
3.2.Genetic differentiation and genetic structure analyses
Table 2 shows the statistical results of the differentiation index,Fst between 18 common toad populations;the four remaining populations provided no statistical results due to the small number of individuals.Overall,for the populations,the mean pairwise Fst varied from -0.139 to 0.914,and the analyses revealed significant genetic differentiation between most populations ofB.bufo
.The differentiation indices of Greece,Turkey and Italy compared to China were 0.804,0.794,and 0.713,respectively.These high Fst values indicated a long-term restriction of gene flow between these populations.China’s Xinjiang population showed the lowest differentiation index when compared with the population from Poland,and the indices for the populations from Croatia,Hungary,Slovakia,and Ukraine were also low.AMOVA was performed on all the clades and populations of the common toad (Tables 3A-B).It can be seen from the results that the molecular variation was mainly between clades,which accounted for 82.37% of the total variation.The molecular variation within clades accounted for only 17.63% of the total variation.The differentiation index across all the clades was 0.82375.After the permutation test,theP
value was significant at < 0.01.A molecular variation analysis of the populations showed that the molecular variation was mainly between the populations,which accounted for 57.917% of the total variation.The molecular variation within the populations accounted for 42.093% of the total variation.The differentiation index across the entire population was 0.57909.After the permutation test,theP
value was significant at < 0.01.3.3.Phylogenetic analyses
Analysis of the results of the four phylogenetic trees constructed with the toad haplotypes showed that the topological structures of the four phylogenetic trees and the bootstrap values of the clades were basically equivalent (Figure 2 and Figures S1A-C).A median-joining network diagram of the toad haplotypes was constructed using network software with 11 intermediate vectors (Figure 3).The topology showed phylogenetic relationships that were basically consistent with those of the haplotype tree,with 85 haplotypes.According to the degree of clade support and the distribution of haplotypes,the common toad haplotype phylogenetic tree was from one same main clade divided into six subclades,Clade1 to Clade6.These clades had obvious regional characteristics related to their distribution areas.
Clade1 was composed of 16 populations distributed in China and eastern Europe,and the Xinjiang population harbored a unique haplotype,Hap2.The 17 haplotypes in Clade2 were all distributed in Turkey,and one individual in Hap17 was from Greece.Clade3 consisted of French and Italian populations,and their shared haplotype was Hap9.Clade5 mainly included the geographical population of Greece and its surrounding four countries.Clade4 and Clade6 both contained Italian populations.
3.4.Pedigree Geography and Differentiation
The results of the mismatch distribution analysis for each clade are shown in Figures 4A-F.Clade1,Clade2,Clade5and Clade6 each showed a single peak in the mismatch distribution curve,indicating that the populations in these areas have experienced expansion and rapid growth.The other branches showed bimodal or even multimodal distributions,indicating that the sizes of the populations distributed in these areas have remained relatively stable.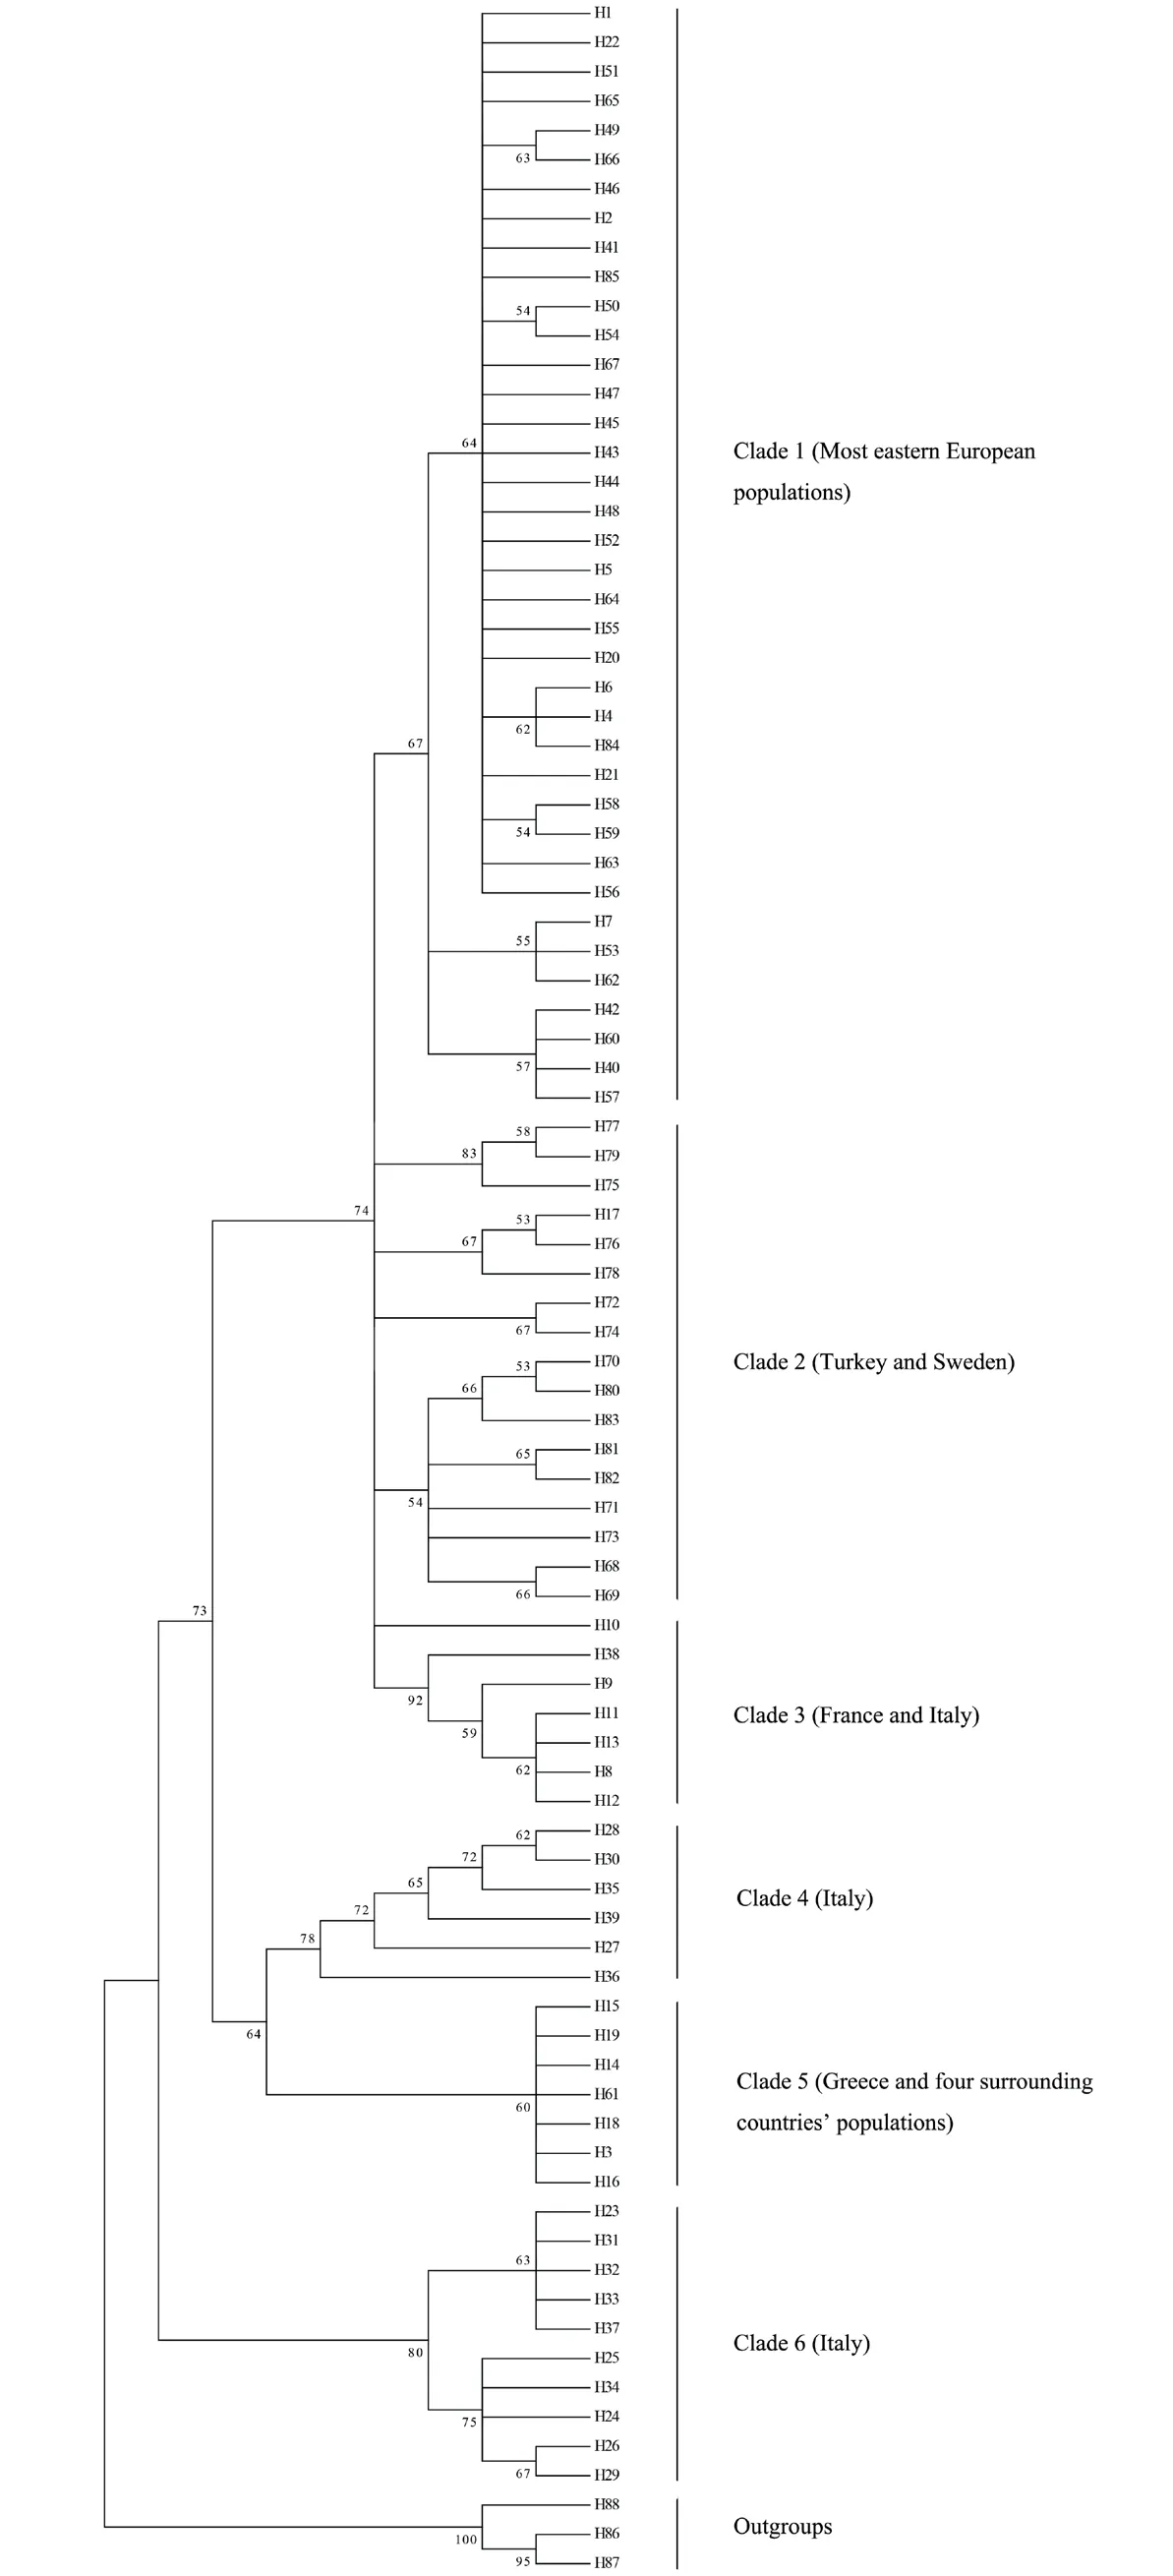
Figure 2 Maximum Likelihood tree,representing relationship among haplotypes of B.bufo.

Figure 3 Median-Joining network of mitochondrial cytochrome b haplotypes of B.bufo.The size of the circles is proportional to haplotype frequency.Each color represents locality country.
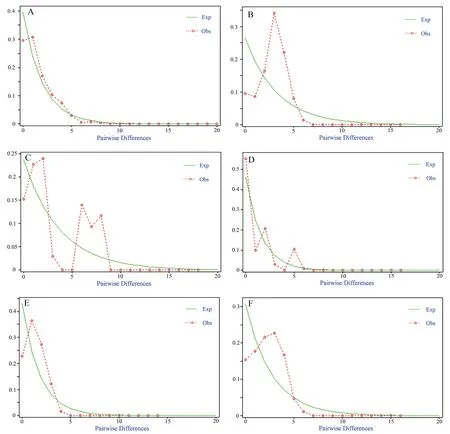
Figure 4 Mismatch distributions within Clade1-Clade6 (A-F) of B.bufo.Dotted lines show the observed distribution of mismatches,and solid lines show the expected distribution under an expansion model.
The statistical results describing the differentiation and expansion of each clade of common toad are shown in Table 4.The table shows that the SSD and Rtests did not reach significance in most clades (P
> 0.05) except Clade2.These results are not completely consistent with the mismatch distribution map,which can only be explained if Clade1,Clade5 and Clade6 have undergone rapid population expansion.Tajima’s D and Fu’s Fs based on the neutrality tests showed negative values for most clades at the clade level,and neither statistic reached significance (P
> 0.05);these results could not confirm that the clade had undergone rapid expansion.In Clade1 and Clade5,the value of Fu's Fs reached significance (P
< 0.05),as did the value of Tajima's D (P
< 0.05),indicating that the Clade1 and Clade5 populations expanded rapidly during their history which is consistent with the mismatch map.Tajima’s D and Fu’s Fs based on the neutrality tests were performed for each population,excluding the populations with fewer than five samples.The results showed that in most populations,these two indicators were negative but not significant (P
> 0.05) (Table 1).In the Xinjiang population in China,neither Tajima’s D value nor Fu’s Fs indicated significance (P
> 0.05);thus,this population may not have undergone rapid expansion.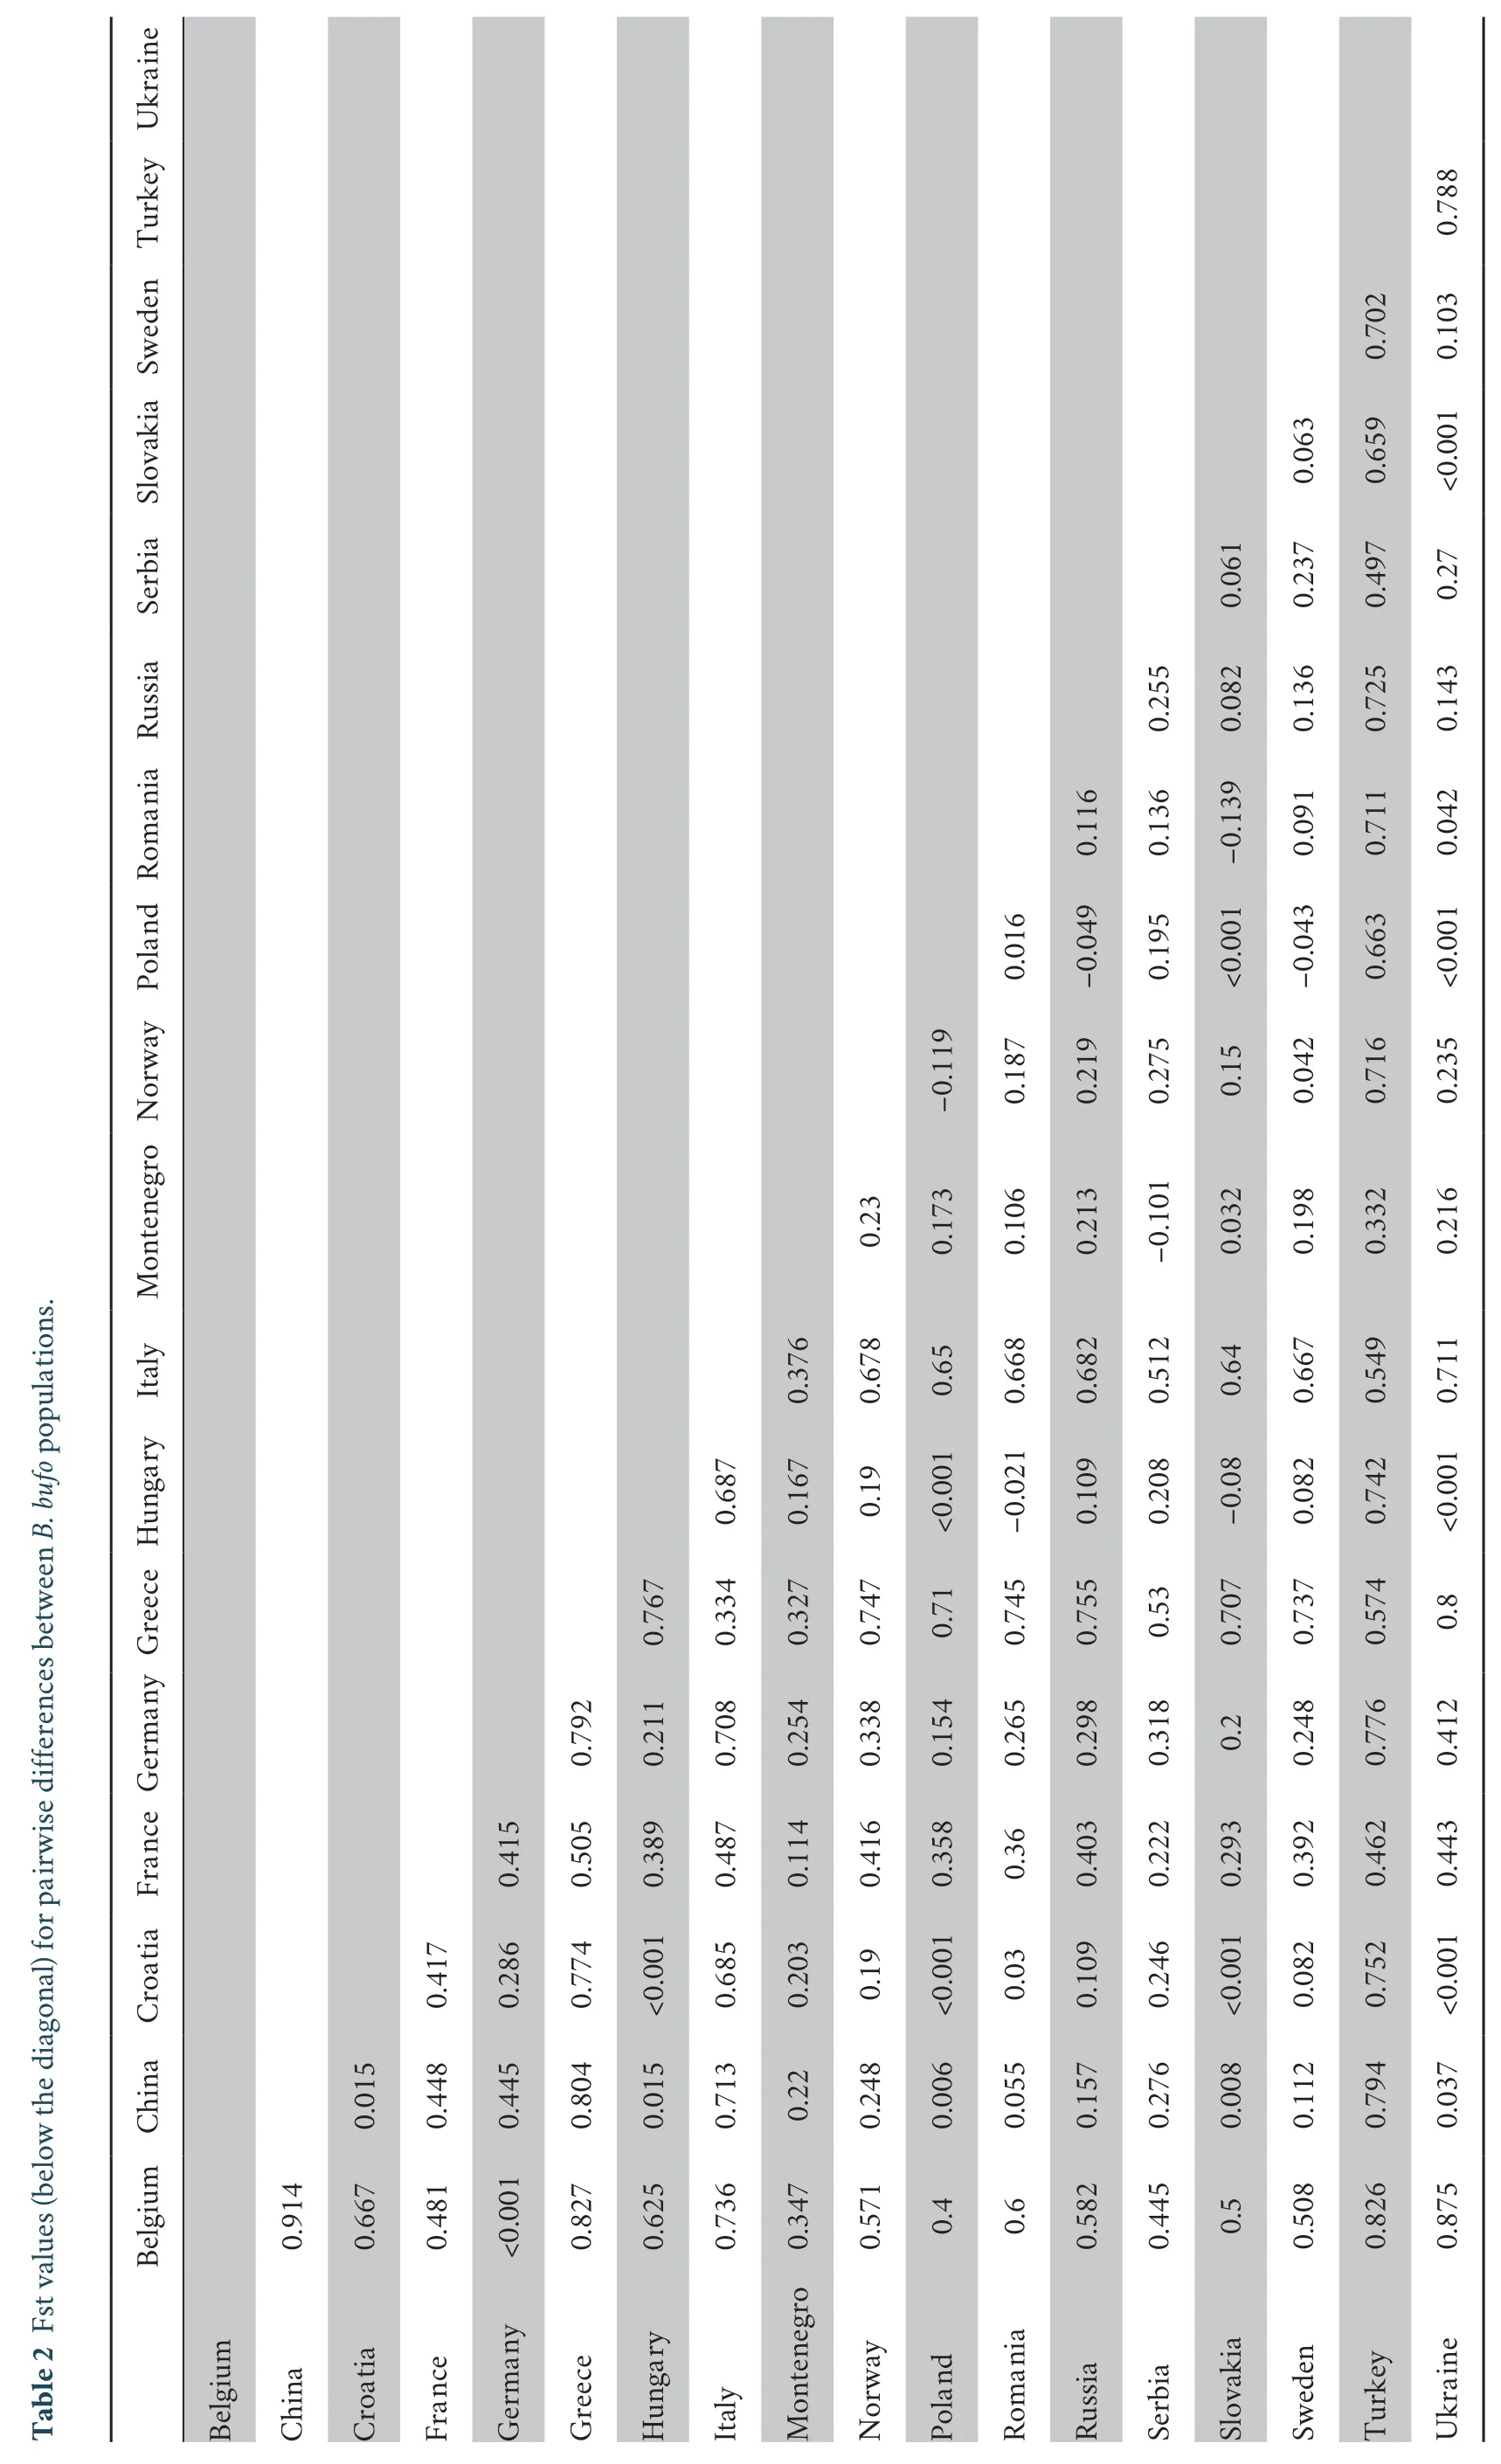
Belgium China Croatia France Germany Greece Hungary Italy Montenegro Norway Poland Romania Russia Serbia Slovakia Sweden Turkey Ukraine Belgium China 0.914 Croatia 0.667 0.015 France 0.481 0.448 0.417 Germany<0.001 0.445 0.286 0.415 Greece 0.827 0.804 0.774 0.505 0.792 Hungary 0.625 0.015 <0.001 0.389 0.211 0.767 Italy 0.736 0.713 0.685 0.487 0.708 0.334 0.687 Montenegro 0.347 0.22 0.203 0.114 0.254 0.327 0.167 0.376 Norway 0.571 0.248 0.19 0.416 0.338 0.747 0.19 0.678 0.23 Poland 0.4 0.006 <0.001 0.358 0.154 0.71<0.001 0.65 0.173-0.119 Romania 0.6 0.055 0.03 0.36 0.265 0.745 -0.021 0.668 0.106 0.187 0.016 Russia 0.582 0.157 0.109 0.403 0.298 0.755 0.109 0.682 0.213 0.219-0.049 0.116 Serbia 0.445 0.276 0.246 0.222 0.318 0.53 0.208 0.512-0.101 0.275 0.195 0.136 0.255 Slovakia 0.5 0.008 <0.001 0.293 0.2 0.707-0.08 0.64 0.032 0.15<0.001 -0.139 0.082 0.061 Sweden 0.508 0.112 0.082 0.392 0.248 0.737 0.082 0.667 0.198 0.042-0.043 0.091 0.136 0.237 0.063 Turkey 0.826 0.794 0.752 0.462 0.776 0.574 0.742 0.549 0.332 0.716 0.663 0.711 0.725 0.497 0.659 0.702 Ukraine 0.875 0.037 <0.001 0.443 0.412 0.8<0.001 0.711 0.216 0.235<0.001 0.042 0.143 0.27<0.001 0.103 0.788 Table 2 Fst values (below the diagonal) for pairwise differences between B.bufo populations.
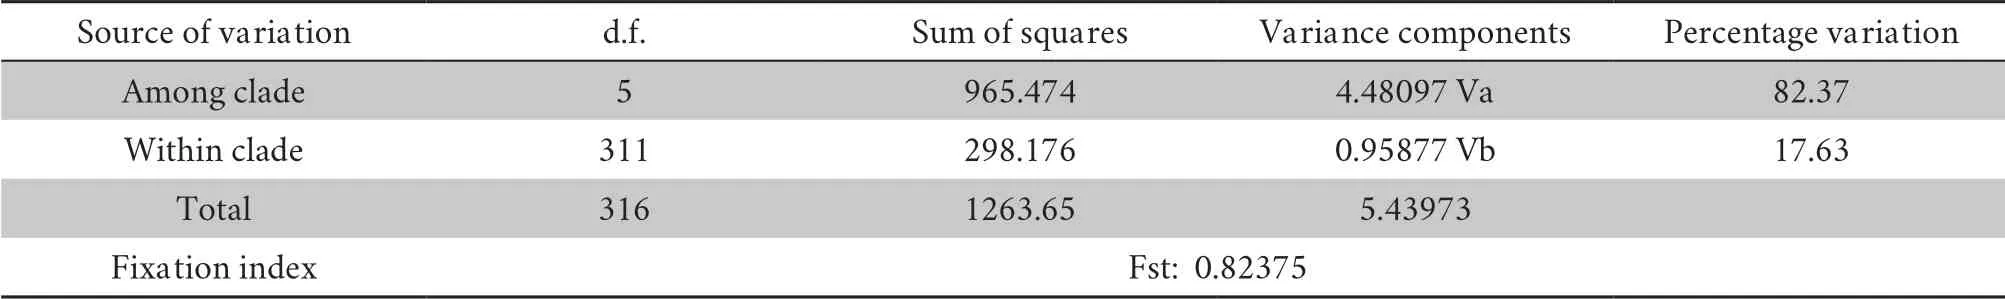
Table 3A Results of analysis of molecular variance (AMOVA) between clades of B.bufo.
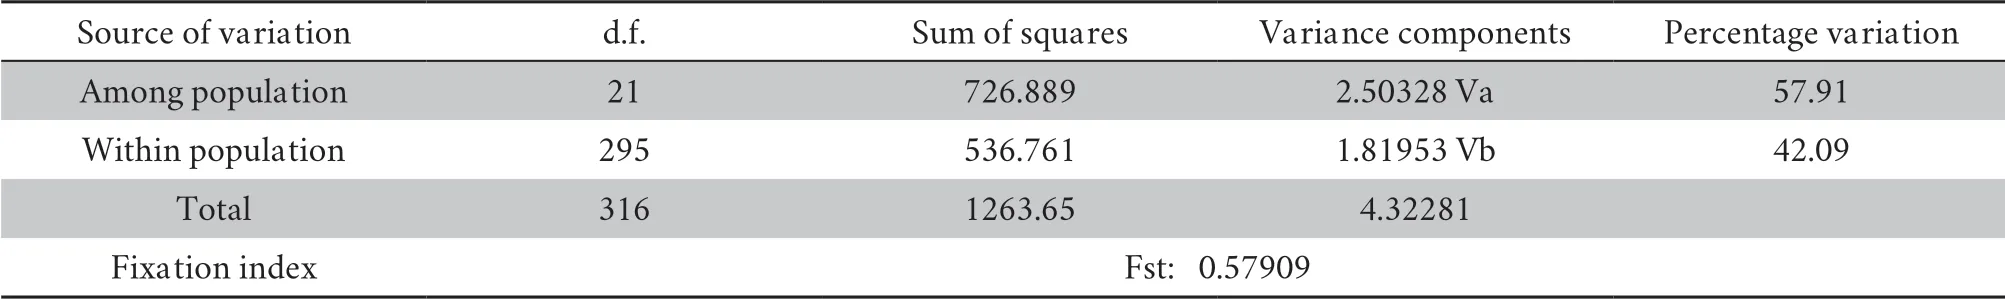
Table 3B Results of analysis of molecular variance (AMOVA) between populations of B.bufo.
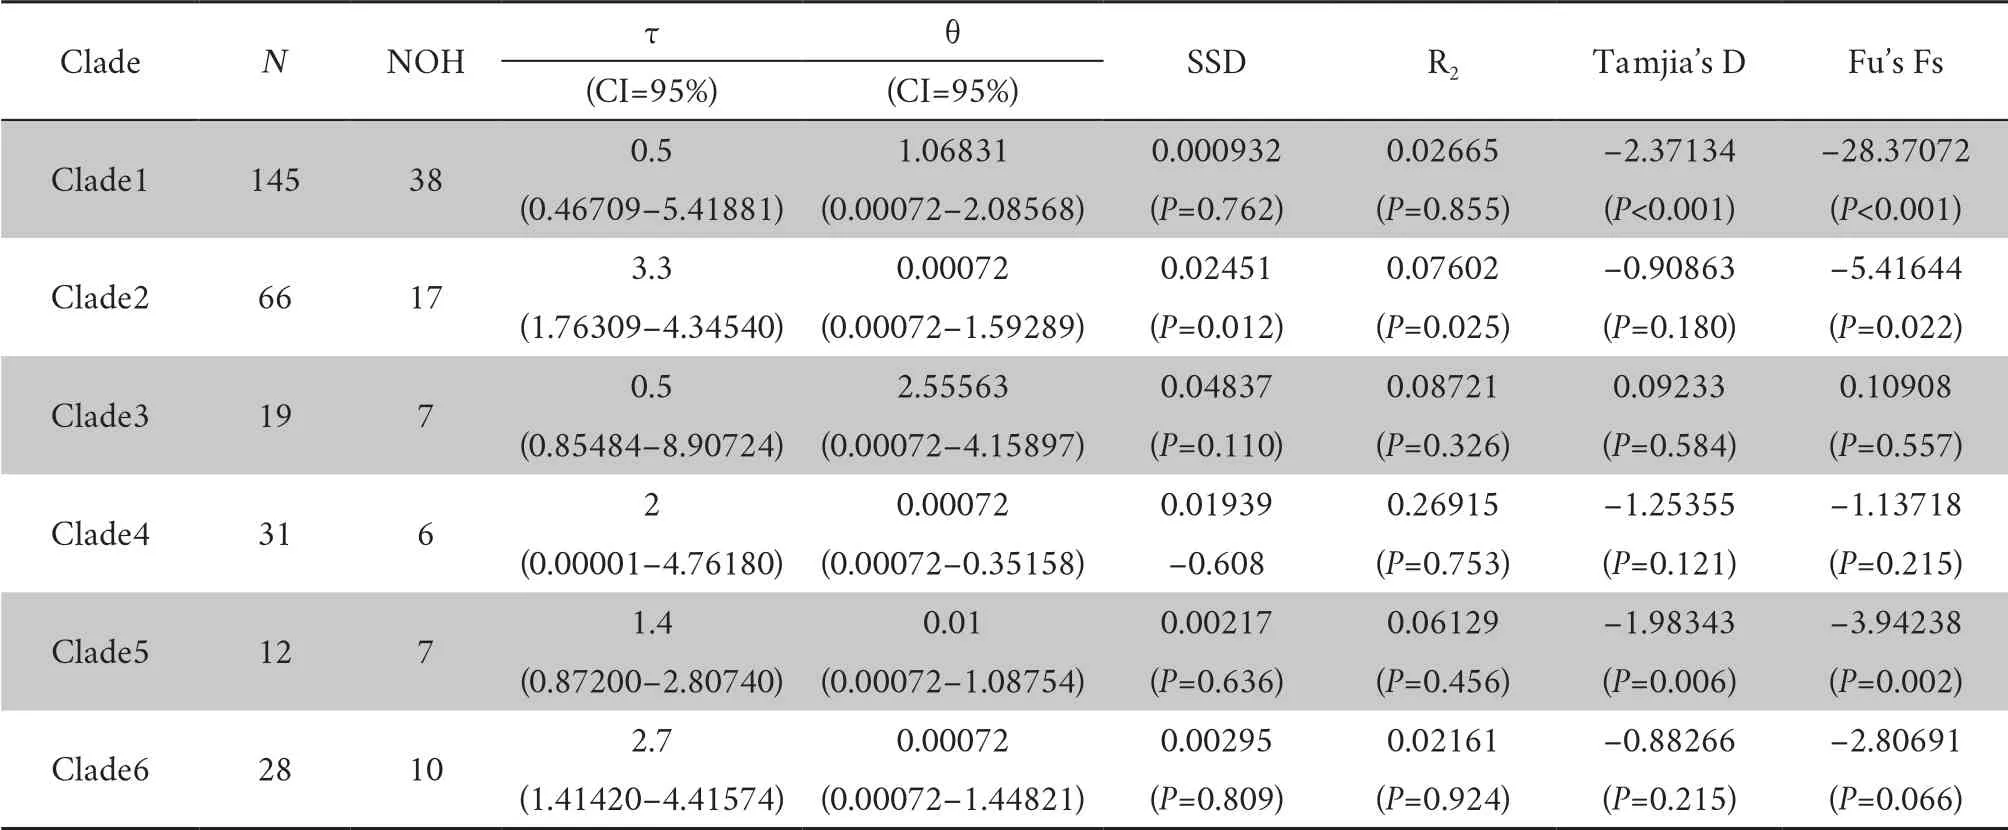
Table 4 Results of the statistical tests of neutrality and mismatch distribution of subclades of B.bufo.
4.Discussion
Our study reports the first use of mitochondrial cytb data to explore the lineage and genetic structure ofB.bufo
from Xinjiang,China,in comparison with other samples from 21 different geographical areas.Based on the haplotype network and haplotype evolution tree,the common toad populations from the 22 different regions belong to the same lineage,consistent with the results of Garcia-Portaet al
.(2012).China’s Xinjiang population,located in Clade1,emerged late in the differentiation process and belongs to the European-Caucasian lineage (Garcia-Portaet al
.,2012).Based on the six subclades,the Xinjiang population of China has a close phylogenetic relationship with some Eastern European populations.The level of genetic diversity is the product of long-term evolution and an important parameter to evaluate the present situation of biological resources.The higher the genetic diversity,that is,the richer the genetic variation,the stronger is the adaptability to the environment and survival competitiveness.The nucleotide diversity index and haplotype diversity index are important indexes to measure the genetic diversity of a species population.Grant and Bowen proposed that when a population has a high h and a low π (for example,h > 0.5,π < 0.005 or 0.5%),it can be speculated that the population may have been subjected to a bottleneck effect followed by rapid population growth in the past.Haplotype diversity and nucleotide diversity analysis (Grant and Bowen,1998) showed that the populations of Hungary,Romania,Russia and other eastern European regions may have experienced bottlenecks followed by historical events of rapid population growth.The AMOVA and statistical results for the mismatch distribution of all the subclades ofB.bufo
also support the inference that the populations in Clade1 underwent expansion and rapid growth in the past.Clade1 included populations distributed in most countries in eastern Europe,a small part of the Russian population and the entire Chinese Xinjiang population.The Fst results revealed the existing genetic differentiation of this species.A lack of gene flow was observed between the common toad population of Xinjiang and the populations from Italy,Turkey,and Greece.In contrast,the genetic differentiation difference was smaller between the Xinjiang population and eastern Europe population.Based on the above data,it is speculated that the populations from Eastern European countries likely rapidly expanded rapidly in historical time.General speaking,the high level of genetic differentiation between populations was due to a lack or low level of gene flow,especially between populations located far away in space or separated by natural barriers (Weerachaiet al.
,2019).For example,due to the barrier of the Alps,the Italian population in this study demonstrated a very weak degree of gene communication with the external population,thus forming a significant evolutionary branch in the phylogenetic relationship and demonstrating great genetic differentiation from the other populations.The geographical area in which the population from the Eastern European countries is located belongs to the plain area of Eastern Europe,which has a relatively low average elevation and no high mountains and rivers,features that are conducive to the spread of amphibian species.In addition,climatic fluctuations and periodic glacial action in the Pleistocene contributed to the current patterns of genetic variation in biological species in Europe and North America (Hewittet al.
,1996;Hewittet al.
,2000).During the glacial period,especially during the last ice age (LGM),the climate was dry,the temperature was low,and large-scale glaciers were present globally (Gasseet al.
,2000;Clarket al.
,2009).Quaternary glaciers have a significant impact on the vast areas of Europe,and the southern edge of the European ice cap can reach 50° N.Many species experience severe habitat shrinkage and continue to survive only in restricted geographical shelters.During warm interglacial periods,shrinking ice caps create new suitable habitats,and species begin to expand from shelters.It can be inferred that a common toad population or a few individuals probably experienced bottleneck effects due to extreme climatic conditions.Subsequently,the population underwent a rapid expansion process,spreading eastward from Eastern Europe,and finally entering Xinjiang from the northern border.However,further research is needed to support this inference.
However,according to the national amphibian survey,the common toad is not distributed in any part of China outside Xinjiang Uygur Autonomous Region (Feiet al.
,2012;Shiet al.
,2005).Neutrality tests based on population Tajima’s D and Fu’s Fs showed that these two indicators were not significant (P
> 0.05) in the Xinjiang population,indicating that this population may not have undergone a rapid expansion.This lack of expansion may have been caused by the unique diversity and particular traits of the complex Xinjiang ecosystem;the presence of the Gobi desert and other arid regions could have prevented the common toad population from spreading further (Wanget al.
,2006).The haplotype network graph shows that the Xinjiang sample in China has a unique haplotype (Hap2),indicating that this population has survived and evolved for a long time in Xinjiang,China,and is isolated from its original parent population,resulting in mutation and genetic drift.To understand the origin and future diffusion patterns of a species,it is very important to investigate and study the distribution regions and phylogenetic relationships within the species.Although the mitochondrial partial sequence data used in this study may not be sufficient to accurately reflect the whole evolutionary history ofB.bufo
,it can at least reveal the general framework of the evolutionary history of this species.Therefore,in the future,we will exam the complete mitochondrial genome sequence to more reveal the evolutionary history of species.Further studies of geography,genetics and molecular biology should also be conducted to provide effective conservation for more species.Acknowledgements
This work was supported by grants from National Natural Science Foundation of China (31872249 and 31530088 ). Asian Herpetological Research2021年2期
- Asian Herpetological Research的其它文章
- A New Leaf Litter Toad of Leptobrachella Smith,1925 (Anura,Megophryidae) from Sichuan Province,China with Supplementary Description of L.oshanensis
- A New Species of Trimeresurus Lacépède,1804 (Squamata:Viperidae) from Southwestern China,Vietnam,Thailand and Myanmar
- A New Species of the Genus Achalinus from Huangshan,Anhui,China (Squamata:Xenodermidae)
- Phylogeography and Cryptic Species Diversity of Paramesotriton caudopunctatus Species Group (Salamandridae:Paramesotriton) in Guizhou,China
- Evolution of Phenotype and Mitochondrial Genome Reveals Limbless and Body-elongated Squamates may Change Their Energy Basis for Locomotion
- Male Advertisement Call of the Endangered Leptobrachella tengchongensis (Anura:Megophryidae) from Mount Gaoligongshan,Yunnan Province,China