
Channel Characteristics Based on Ray Tracing Methods in Indoor Corridor at 300 GHz
2021-09-07 02:52ZHAIKaiZHAIMenglin翟梦琳ZHANGLeiLIDemin李德敏
关键词:李德
ZHAI Kai(翟 凯) , ZHAI Menglin(翟梦琳) *, ZHANG Lei(张 磊), LI Demin(李德敏)
1 College of Information Science and Technology, Donghua University, Shanghai 201620, China
2 Engineering Research Center of Digitized Textile and Apparel Technology, Ministry of Education, Donghua University, Shanghai 201620, China
Abstract: With the rapid development of communication technology, people’s demand for ultra-high-speed wireless links becomes higher, among which terahertz spectra are considered as one of the most promising spectra. In this paper, we analyze the channel characteristics at 300 GHz in indoor corridor based on ray tracing methods, including the large-scale and small-scale fading parameters. Simulation results show that it is suitable for short distance transmission due to its large path loss (PL). Firstly, compared with line-of-sight (LoS), the correlation of frequency components in non-line-of-sight (NLoS) is much better, but LoS has more abundant circle angular spread (CAS). Then, a stochastic model is well derived to describe the distance-dependent behaviour of root-mean-square delay spread (RMS-DS) as well as root-mean-square CAS (RMS-CAS). Besides, we find that the channel capacity can effectively increase by increasing the transmitted power in both LoS and NLoS. Finally, it can be seen that the RMS-DS can be significantly reduced in LoS and the channel capacity can increase by changing the position of the transceivers. The simulation results will provide references for future indoor communication.
Key words: terahertz; channel characteristic; ray tracing; indoor corridor
Introduction
With the rapid development of science and technology in recent years, people’s demand for high-speed data stream become more and more higher. At the same time, high-speed data flow is growing rapidly[1]. More importantly, in order to support the rate requirements of future high-speed wireless communication, new physical layer solutions are urgently needed, among which terahertz (0.06-10.00 THz) is considered to be one of the most promising bands[2]. Compared with millimeter wave band, the terahertz spectrum provides great potential for future fast communication due to its big bandwidth and rapid data transmission rate.
The terahertz band has attracted wide attention due to recent researches. Developing new communication systems at such frequencies has become promising[3-5]. Up to now, many researches have focused on terahertz channel characteristics and indoor communication plays an important role in wireless communication[6]. Only reflection should be considered indoors due to the effect of reflection factor is greater than diffraction factor. Molecular absorption and channel capacity were investigated in Ref. [7]. In Ref. [8], a simulation model for the terahertz band was developed to analyze the channel capacity, delay spread and coherent bandwidth based on ray tracing technology. Then, the model was improved to represent three-dimensional (3D) space in Ref. [9]. Future wireless communication is the most likely to be operated at 300 GHz, compared with the traditional indoor communication frequency band, the channel characteristics behave differently. The authors used ray tracing to conduct a comprehensive analysis of indoor offices at 300 GHz in Ref. [10] and showed that roughness had a considerable influence on both the spatial and temporal channel characteristics.
Meanwhile, in order to ensure the fluency of communication, the channel characteristics of transition scenes such as corridors also need to be studied. And corridors play an important role for future channel communication[11]. Hence, the characteristics of indoor corridors had become a research hotspot and had been analyzed in some articles. In Ref. [12], a ray tracing method was used to compare the measurement results in a long corridor at 2.45 GHz. Meanwhile, the paper emphasized the effects of the electromagnetic characteristics of the floor and the ceiling to the indoor environment. In Ref. [13], the path gain, delay spread, angular spread and signal-to-noise ratio (SNR) were considered at 28 GHz in a Z-type corridor both in line-of-sight (LoS) and non-line-of-sight (NLoS). On these bases, the angle gain coverage of corridor was considered and analyzed in[14]. At 60 GHz, the L-type and T-type corridors were simulated by shooting and bouncing ray (SBR) image method[15]. In Ref. [16], through the analysis of the current physical layer and the simulation of an E-type indoor corridor, authors effectively solved the problem of transmission distance limitation in the terahertz band from four aspects.
To the best of our knowledge, the channel characteristics of indoor corridor need to be explored especially in high frequency. With the increase of the frequency band, the channel characteristics will be quite different from that of millimeter wave band. Meanwhile, the indoor corridor is important to channel communication and represents the transition scene connecting indoor and outdoor. Hence it is necessary to study characteristics of the corridor for further use.
In this paper, we firstly analyze the 3D space wireless channel characteristics of E-type indoor corridor at 300 GHz for base station communication. Simulation results give the large-scale and small-scale fading parameters. Meanwhile, a stochastic model is used to approximate and reproduce the root-mean-square delay spread (RMS-DS) and root-mean-square circle angular spread (RMS-CAS) in the corridor. In addition, the channel capacity is also analyzed. Finally, different antenna arrangements are proposed to obtain better channel characteristics. These results will provide references to the future channel parameter extraction in the terahertz band.
The chapters of the paper are arranged as follows. Firstly, the simulation environment and the channel modeling are given in section 1. Furthermore, simulation results and data analysis are described in section 2. In addition, we analyze the influence of changing the transceiver’s position on the channel. Finally, the paper is summarized in section 3.
1 Experiments
1.1 Simulation environment
The E-shaped indoor corridor scene in our simulation is shown in Fig. 1. It resembles the layout of the Van Leer building at Georgia Tech[16].

Fig. 1 Layout of the simulation environment
The length, width and height of the room are 100, 30 and 3 m, respectively. The scene is made up of three vertical corridors and one horizontal corridor. We assume that the permittivity of concrete, floor board and ceiling board are based on[17]and given in Table 1. Meanwhile, considering that most concrete surfaces are rough compared with the wavelength at 300 GHz, we use the Rayleigh roughness factor[18]to modify the reflection coefficient and choose 0.05 as the standard deviation of the surface roughness.
1.2 Ray tracing methods
In this paper, a ray tracing algorithm is employed to capture indoor channel parameters[19]. Considering that the frequency is high in the room, thus the diffraction and transmission effect are ignored. The number of rays arriving in the NLoS region is small, even there is no secondary-order reflection. Thus, to obtain more accurate channel parameters, we use forth-order reflection in the NLoS region. While in LoS, third-order reflection is enough.
Meanwhile, we use the omni-directional antenna with a gain of 0 dBi and the center frequency is 300 GHz. The red point in Fig.1 represents transmitter (Tx) and the black one is receiver (Rx) with the height of 2.5 m and 2 m, respectively. The power of Tx is 0 dBm. The range of the distance between Tx and Rx varies from 5 m to 80 m, and a total of 40 points are simulated. The detailed parameters of the simulation are shown in Table 2.
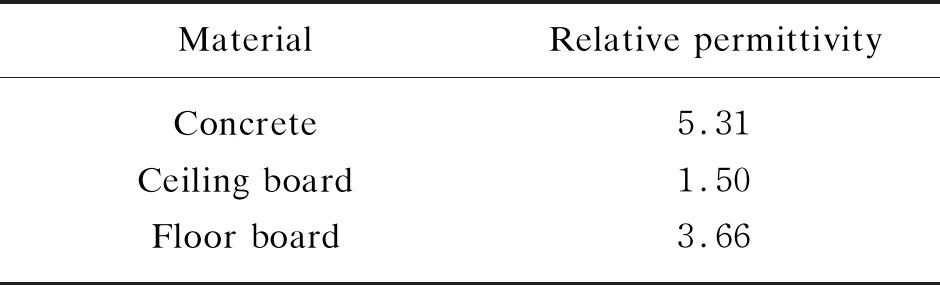
Table 1 Material properties

Table 2 Simulation system parameters
2 Results and Discussion
2.1 Power delay profile (PDP)
Channel impulse response (CIR) can be calculated as
(1)
wherekandKrepresent the multipath numbers;h(t,τ),ak(t),τk(t) andφk(t) are CIR amplitude, attenuation coefficient, excess delay, and phase ofkth, respectively.
Then, we can get PDP as
,
(2)
whereP(t) is PDP.
In this section, the Tx location is fixed at [10, 25, 2.5] and Rx1 [32, 27, 2] (LoS), Rx2 [90, 15, 2] (NLoS), respectively. Figure 2 shows that the delay spectrum begins when the first multipath component arrives at the receiving point and the received power will decrease with the increase of delay, which agree with the actual situation as the increase of distance will lead to the increase of free space loss. It can be seen from Fig. 2 that there is a strong LoS power close to -105 dBm while the minimum multipath power is close to -180 dBm. The reason for this gap can be explained by the long length of the corridor, so that the propagation distance from the left to the right walls is longer. In NLoS, the strongest power is close to -130 dBm and the weakest power is close to-158 dBm. This is because there are fewer paths reaching the NLoS area and the width of the room is only about 1/3 of the length. Besides, compared with the LoS area, the NLoS region receives less multipath signals and the delay distribution is relatively uniform.

Fig. 2 Simulated results of PDP at (a) Rx1 and (b) Rx2
2.2 Path loss (PL)
In order to obtain better simulation results, we choose a total of 22 LoS and 23 NLoS Rx points uniformly. Meanwhile, we use the close free space model[20]to fit the simulation data. The large scale PL parameter can be obtained as
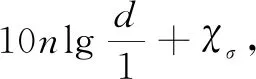
(3)
wherenis the PL exponent (PLE),drepresents the 3D distance between Tx and Rx,fis the frequency,χσrepresents the Gaussian distribution random variable with the mean value of 0 and standard deviationσ, andLPLis the PL andLLSPL(f, 1) is theLPLin free space when the reference distance is 1 m which is described by
(4)
wherecis the speed of light (3×10⁸m/s).
Figure 3 (a) shows the simulated results for LoS and NLoS, with the free space (PLE=2) results given for comparison. We can find that the PL varies from 102 dBm to 122 dBm in LoS while varies from 122 dBm to 148 dBm in NLoS. Compared with LoS, the PL and the variation range are larger in NLoS. The difference of power is about 20 dBm. The reason is that the wall blocks the LoS propagation path and the most multipaths can only rely on reflections. Meanwhile, we can know that the PL is very large at 300 GHz, so it is suitable for short distance communication in both LoS and NLoS.
We can know that the PLE of LoS is 1.936, which is slightly smaller than that of free space. This agrees with the real situation, as in this case there are almost no obstacles between Tx and Rx. However, due to the limitation of walls or barrier, the PLE of NLoS is 2.878, which is larger than that of free space. This shows that the PL varies greatly with the distance in NLoS. Meanwhile, we find that the shadow fading factor presents a normal distribution with a standard deviation of 2.39 dB and 5.78 dB, respectively.
To validate our simulation results, we set the positions as those in Ref. [16],i.e.The Tx located at [5.00, 25.00, 2.95] and the Rx uniformed distributed every ten meters in LoS. Then, the simulated SNR are shown in Fig. 3 (b). It can be seen that the trend of simulated results is basically consistent with Ref. [16].

Fig. 3 Simulated results of (a) PL in LoS and NLoS;(b) SNR in LoS at 300 GHz
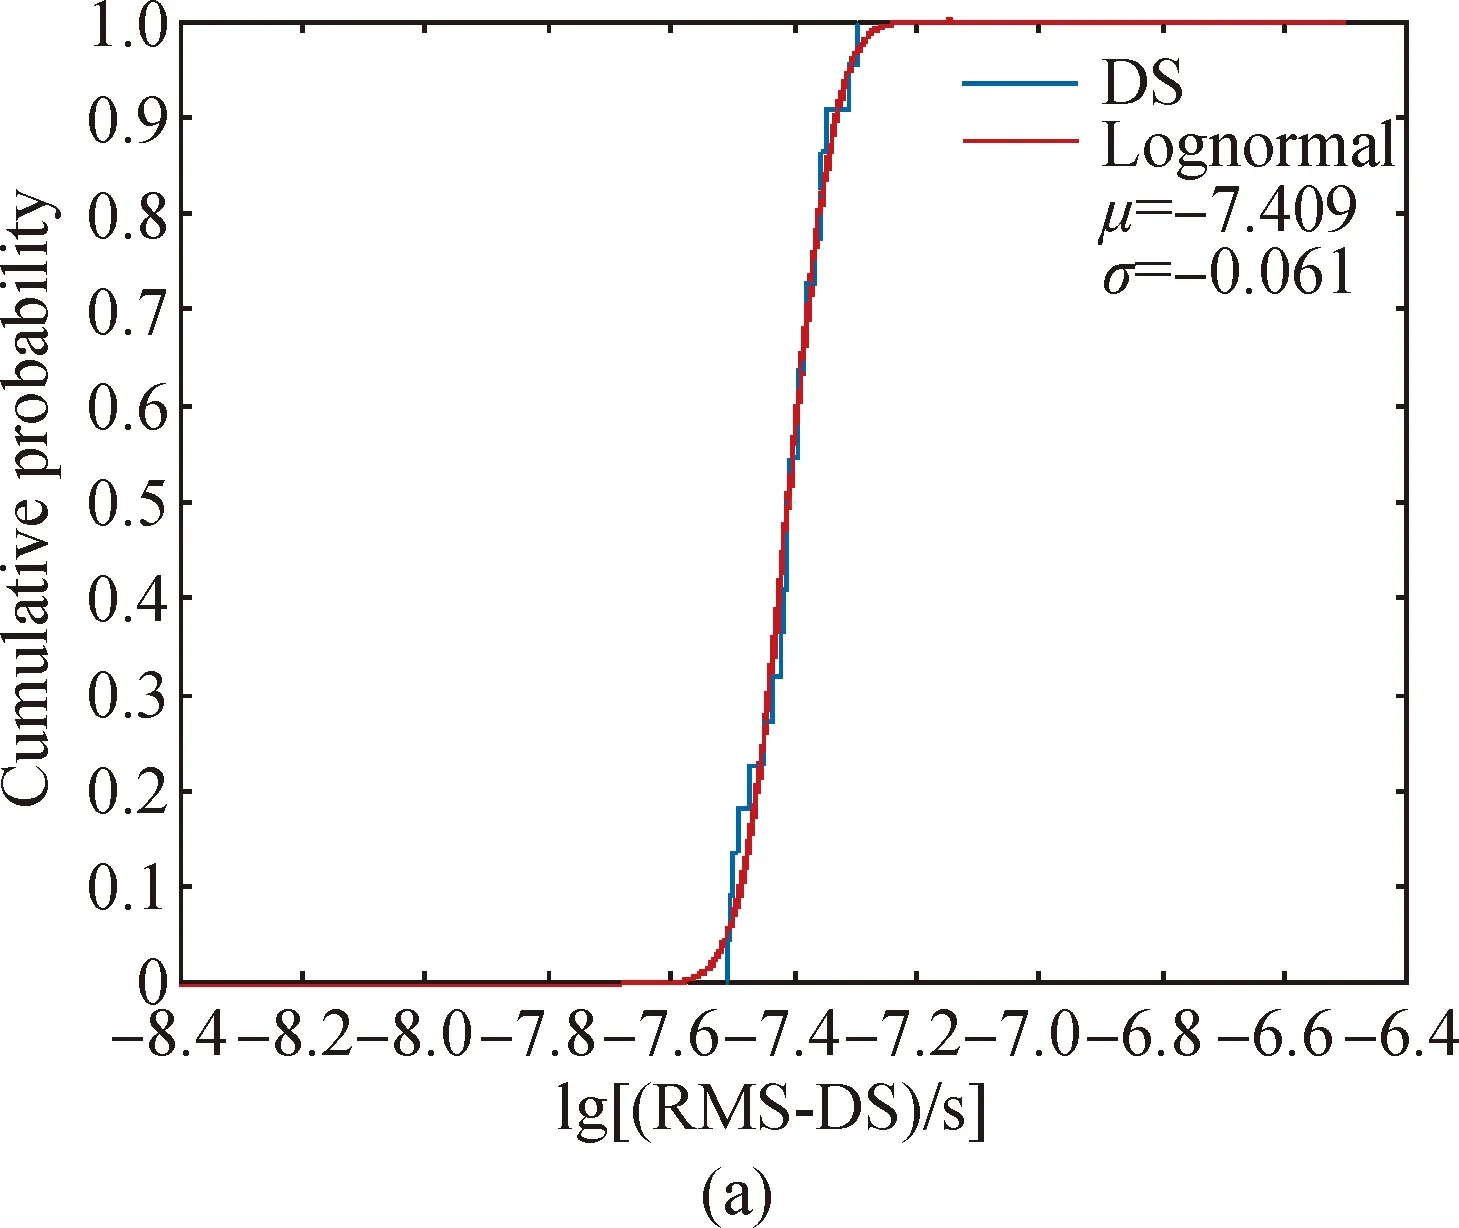
Fig. 4 Simulated cumulative distribution function (CDF) of (a) LoS lg(RMS-DS); (b) NLoS lg(RMS-DS); (c) RMS-DS of both LoS and NLoS
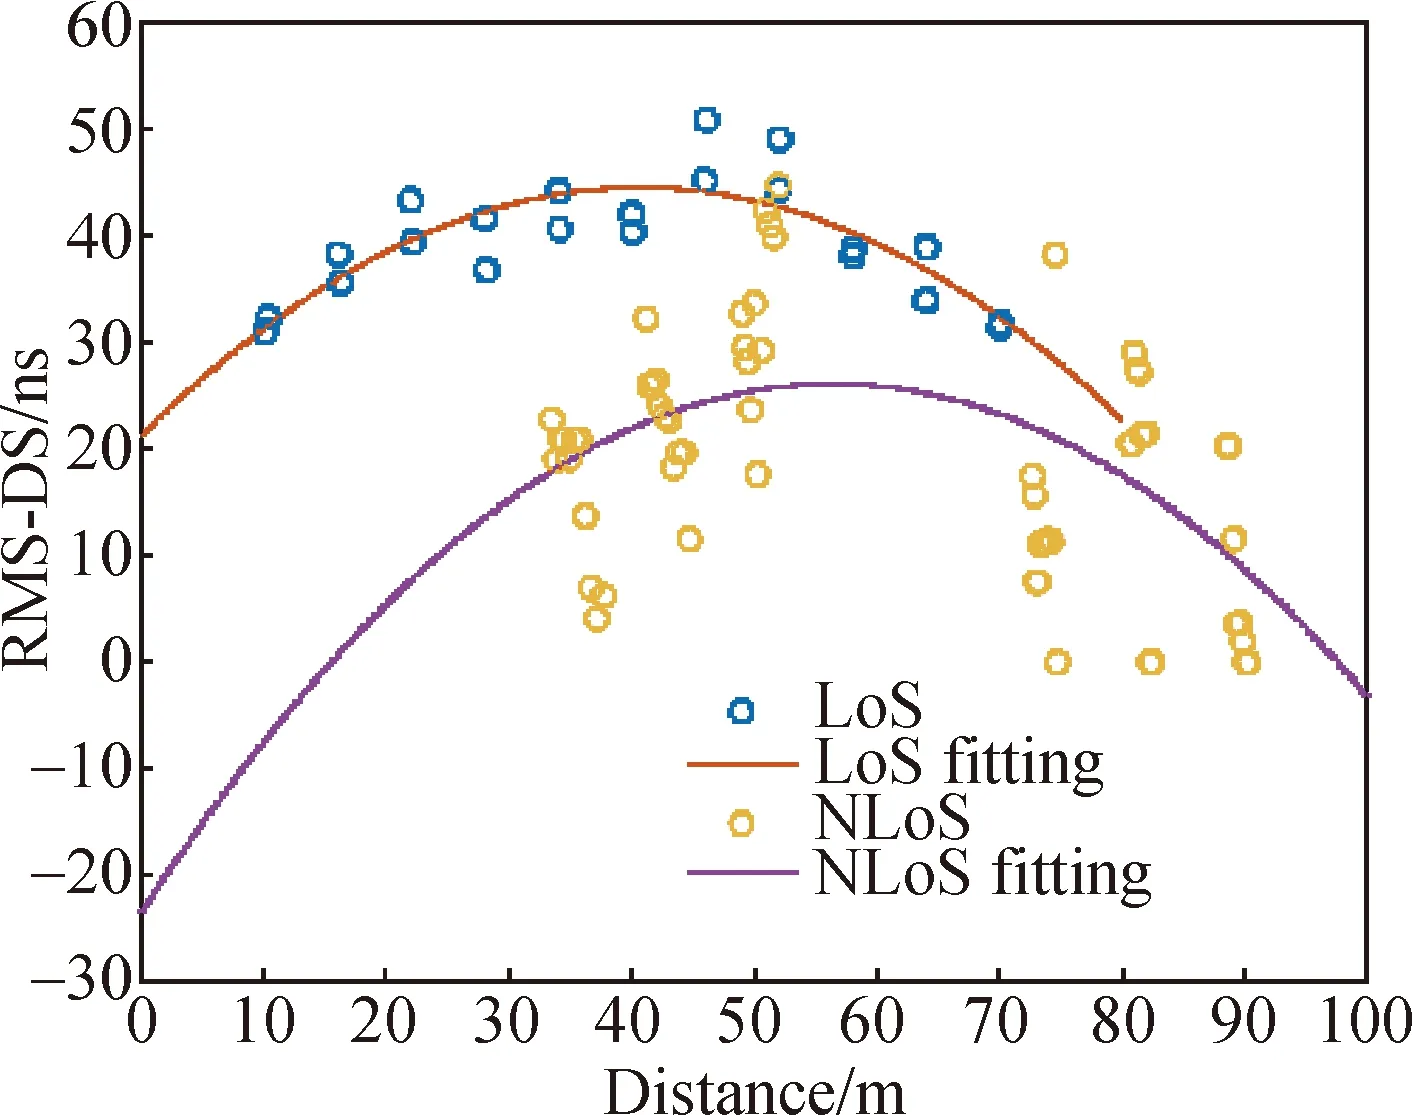
Fig. 5 Simulated RMS-DS of LoS and NLoS
2.3 RMS-DS
We usually use the RMS-DS to describe the degree of delay dispersion in multipath channel[21], which is defined as
(5)
where

In addition, we also consider a special case that when the scene is full of people or furniture, lighting or air supply fixtures, the reflections from the ceiling and the floor will be blocked. In this case, the simulated mean of the RMS-DS is about 36.3 ns in LoS and 25.1 ns in NLoS, respectively. Compared with the empty situation, RMS-DS reduces about 3.5 ns in LoS while increases about 4.2 ns in NLoS. This implies that if the reflections from the ceiling and the floor are blocked, the received power in NLoS will be delayed. Therefore, the reasonable layout of furniture location or lighting device has a certain impact on the propagation in NLoS.
Figure 5 shows the relationship between RMS-DS and the distance at 300 GHz. We use a second-order polynomial to describe the trend of RMS-DS which can be written as
y=ad2+bd+c+χσ,
(6)
whereyrepresents RMS-DS;a,bandcare independent variable coefficients anddrepresents the distance between transmitting and receiving points. It can be seen that the RMS-DS can be well matched with the second-order polynomial in both LoS and NLoS. A summary of the detailed parameters is given in Table 3. It can be seen that the RMS-DS increases between a distance of 40-60 m from Tx and begins to decline after 60 m. This is because with the increase of the distance, reflection paths are dominant in the range of 40 m to 60 m. However, the differences between LoS and multipath gradually decrease and the multipath effect weakens. Similar results are found in the NLoS region. Meanwhile, NLoS has a largerσ, which implies that the influence of the environment has a significant impact on the RMS-DS.
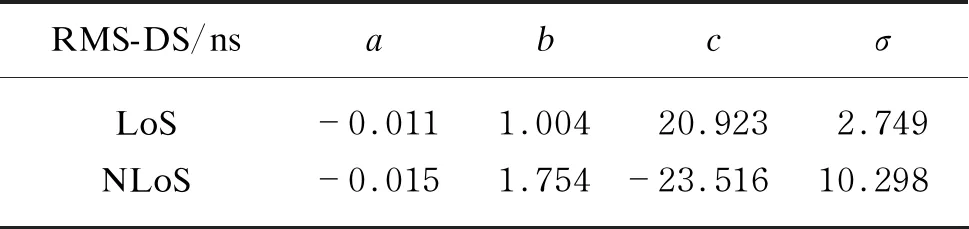
Table 3 Parameters for the second-order polynomial fitting of RMS-DS

Table 4 Parameters for the second-order polynomial fitting of CAS
Considering the similarities with the indoor model, then we change the frequency to 3 GHz and compare the results with those of WINNER II. We can know that the RMS-DS in our simulations and WINNER II can both be fitted well by lognormal distribution.
2.4 Circle angular spread (CAS)
Another important parameter used to describe the characteristics of multipath channel is angular spread (AS). Here, to avoid angle ambiguity, we use CAS.
(7)
whereθk(Δ)=θk+Δrepresents the shifted angle with an angular ofΔ;μ(Δ) are defined as
(8)
It should be noted that bothθk(Δ) in Eq. (8) andθk(Δ)-μ(Δ) in Eq. (7) are normalized to the range of [-π, π].
The simulation results of azimuth angle of arrival (AAOA), elevation angle of arrival (EAOA) and received power are shown in Fig. 6. The AAOA ranges from -180° to 180° in LoS and 0° to 180° in NLoS. The EAOA ranges from -30°- 20° in LoS and ranges from -5°- 5° in NLoS. Compared with NLoS, LoS has more abundant multipath components. The variation of AAOA is larger than that of EAOA,because AAOA is more related to the relative position of Rx and Tx while EAOA is related to the height difference between Rx and Tx, which agrees with facts. In the indoor environment, due to the limitation of the ceiling and the floor, the variation range of elevation angle is much smaller.

Fig. 6 Delay and angle power spectra in (a) Rx1 and (b) Rx2
In addition, the CDF of azimuth departure angular spread (ASD), elevation departure angular spread (ESD), azimuth arrive angular spread (ASA) and elevation departure angular spread (ESA) in the layout simulation are given in Fig.7. It can be seen that the fitting results of the LoS region is better than that of the NLoS region. The mean values of lg ASA for LoS and NLoS are 1.398 and 1.675, respectively. The mean values of lg ASD for LoS and NLoS are 1.583 and 1.175, respectively. The values ofμlg ESA in LoS and NLoS are 0.509 and 0.213 and the values ofμlg ESD are 0.527 and 0.214 in LoS and NLoS, respectively. Owing to the limitation of the floor and the ceiling, ESA and ESD are smaller than ASA and ASD both in LoS and NLoS.
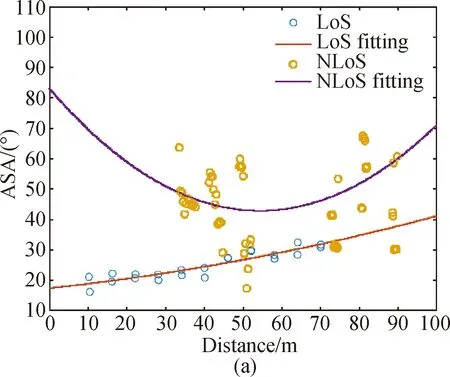
Fig. 8 Simulated results of (a) ASA in LoS and NLoS; (b) ESA in LoS and NLoS
In order to predict indoor angular spread more conveniently, it is necessary to establish an analytical model. We use a quadratic polynomial analytical model to describe the RMS-CAS, which can be well established as
y=ad2+bd+c+χσ,
(9)
whereycan represent ASA and ESA;a,bandcare independent variable coefficients anddrepresents the distance between transmitting and receiving points.
Here, we mainly study the characteristics of the received signal. Therefore, ASA and ESA are selected as objects in Figs. 8(a)-(b).
With the approximation of such a polynomial function, we can see that the RMS-CAS can be well matched with the fitting results in both LoS and NLoS. It can be seen that ASA seems to increase with the increase of distances in LoS. However, it seems to decrease toward the center of the room and an increase toward the walls in NLoS. For LoS, when the Rx reaches the middle of the room, part of the wall reflection will decrease so that the differences between the reflection paths and LoS distance will be reduced. Thus, ASA will gradually decrease. However, when the receiver is closer to the end of the corridor, the fading and ASA will increase due to more reflections. Compared with LoS, NLoS has a larger standard deviation. This can be explained that the receiving points are closer to the wall in NLoS, so the received power suffer from more additional reflection attenuation.
In addition, the maximum value of ESA is about 20-40 m away from Tx in LoS, because the angle of the path away from Tx is large in this case and the multipath effect will increase due to the reflection of the front and rear walls. As the paths are blocked, the number of rays far away from Tx is less, so that ESA gradually presents a download trend. Due to limitations of the height differences between the ceiling and the floor, ESA has smaller standard deviation compared with ASA.
2.5 Channel capacity
Usually, to get the channel capacity, we need to calculate the SNR which can be expressed in dB as
PSNR=Pr-Pn=Pt-LPL(f,d)-Pn,
(10)
wherePSNR,PrandPnrepresent SNR, received power and noise power in dB respectively. Theoretically,Pnis related to the bandwidth and the noise power spectrum. We use the concept of Shannon formula to calculate the channel capacity by
C=Δflog2(1+10PSNR/10),
(11)
whereΔfrepresents the bandwidth, andCis the channel capacity.
In this paper, we choose 160 dBm/Hz as the noise power spectral density. Figure 9 show the histograms of channel capacity of all receiver points in LoS and NLoS. It can be seen from Fig. 9 that the channel capacity in LoS is much larger than that in NLoS. This is because there is a strong LoS transmission and then the received power will be greater. The SNR will be larger. Besides, the channel capacity will increase by about three times in both LoS and NLoS when we increase the transmitted power in both simulations. Therefore, by increasing the transmitted power or beam-forming gain, the channel capacity can be improved.

Fig. 9 Histograms of channel capacity in (a) LoS and (b) NLoS
2.6 Simulation results for different transmitting positions
In addition, we moved the transmitter to the center of the corridor to explore the influence of changing the positions of the transceivers on the channel parameter characteristics.
2.6.1RMS-DSofchangedposition
Figure 10 shows the RMS-DS in this case. It can be seen from Fig. 10 (b) that RMS-DS ranges from 10.5 ns to 41.9 ns in LoS while 5.0 ns to 47.1 ns in NLoS, respectively. Meanwhile, the mean value of RMS-DS in LoS is lower than in NLoS. Compared with the above simulation, the RMS-DS in LoS reduced 10 ns-20 ns while it has no obvious differences in NLoS. It can be known that although in the same environment, RMS-DS will be changed with the relative positions of transceivers. Moreover, the delay can be significantly reduced by placing Tx at the middle of the corridor.

Fig. 10 Simulated results of (a) the layout of the simulation environment; (b) CDF of RMS-DS in LoS and NLoS
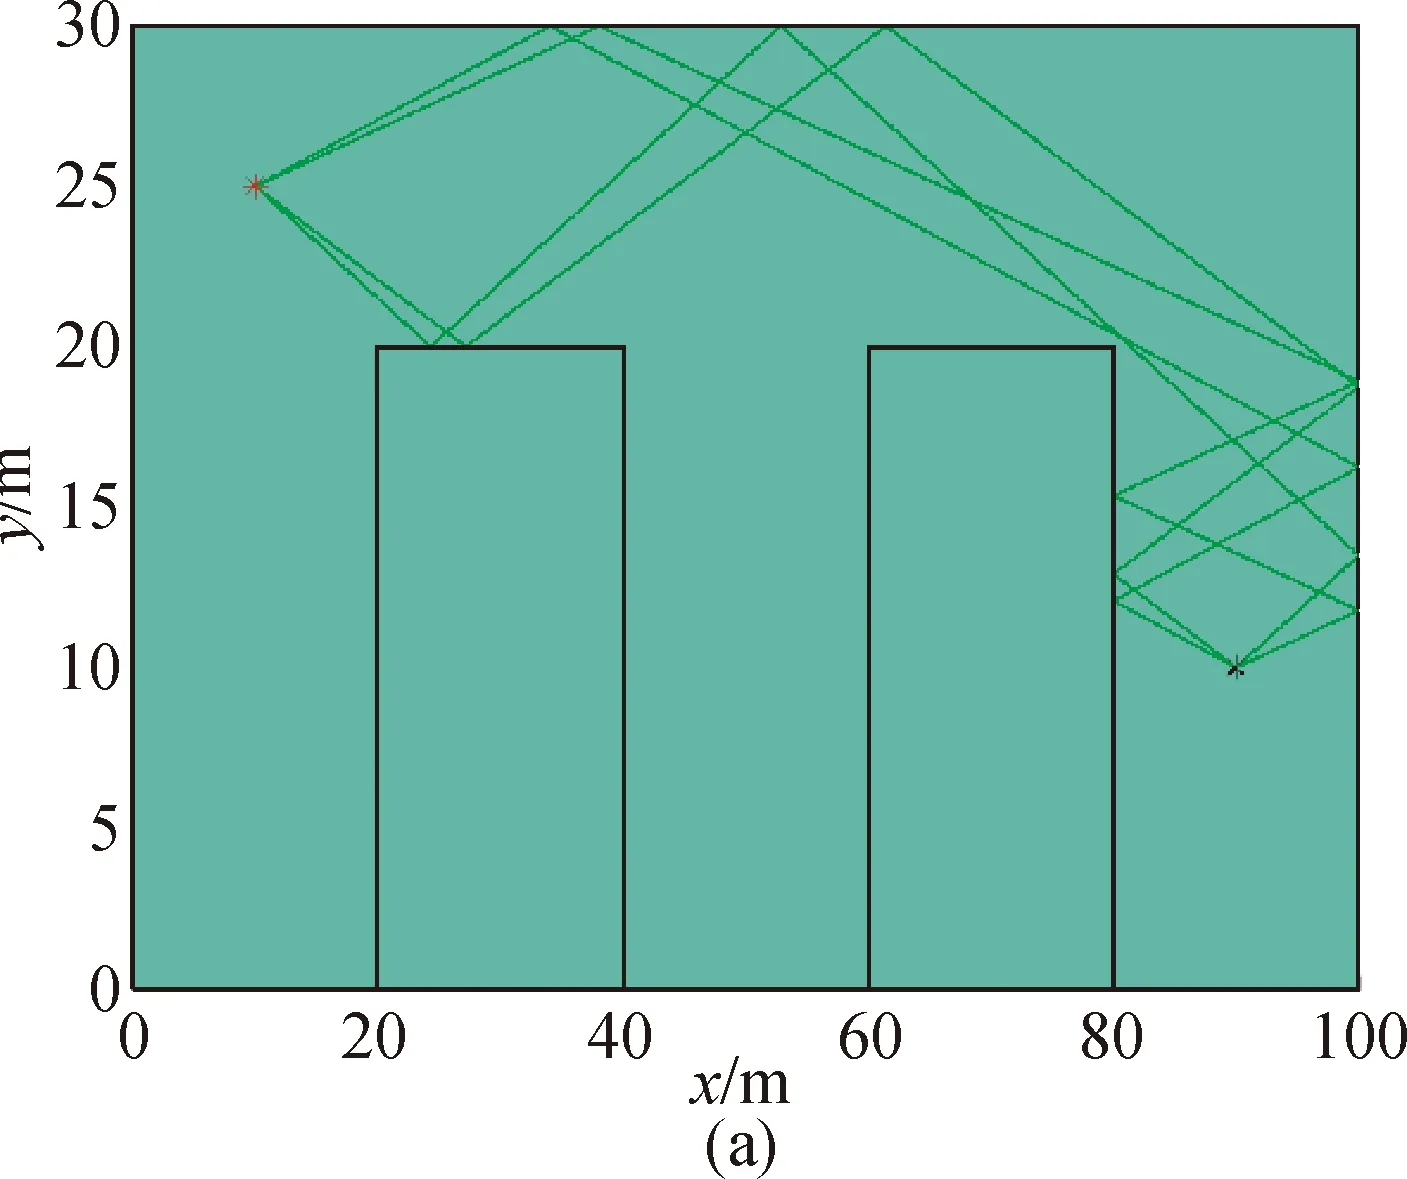
Fig. 11 Simulated results of (a) propagation paths in NLoS; (b) propagation paths of changing the transmitters in NLoS
Figure 11 shows the propagation paths in Rx3 [90, 10, 2] (NLoS) in the two different scenarios. It can be seen that there are more multipath components reaching the NLoS region when changing the position of transceivers. Besides, there are even some paths that only rely on two reflections, which make the intensity of the received power improved. This can provide a theoretical reference for the design of indoor corridor in the future.
2.6.2RMS-CASofchangedposition
Figure 12 (a) shows the results of Rx2 with the transmitter set in the middle. Compared with Fig. 8 (b), we find that this kind of layout can increase the multipath signal and balance the angle distribution in NLoS region. This is beneficial to signal propagation in NLoS.

Fig. 12 Delay and angle power spectrum in NLoS
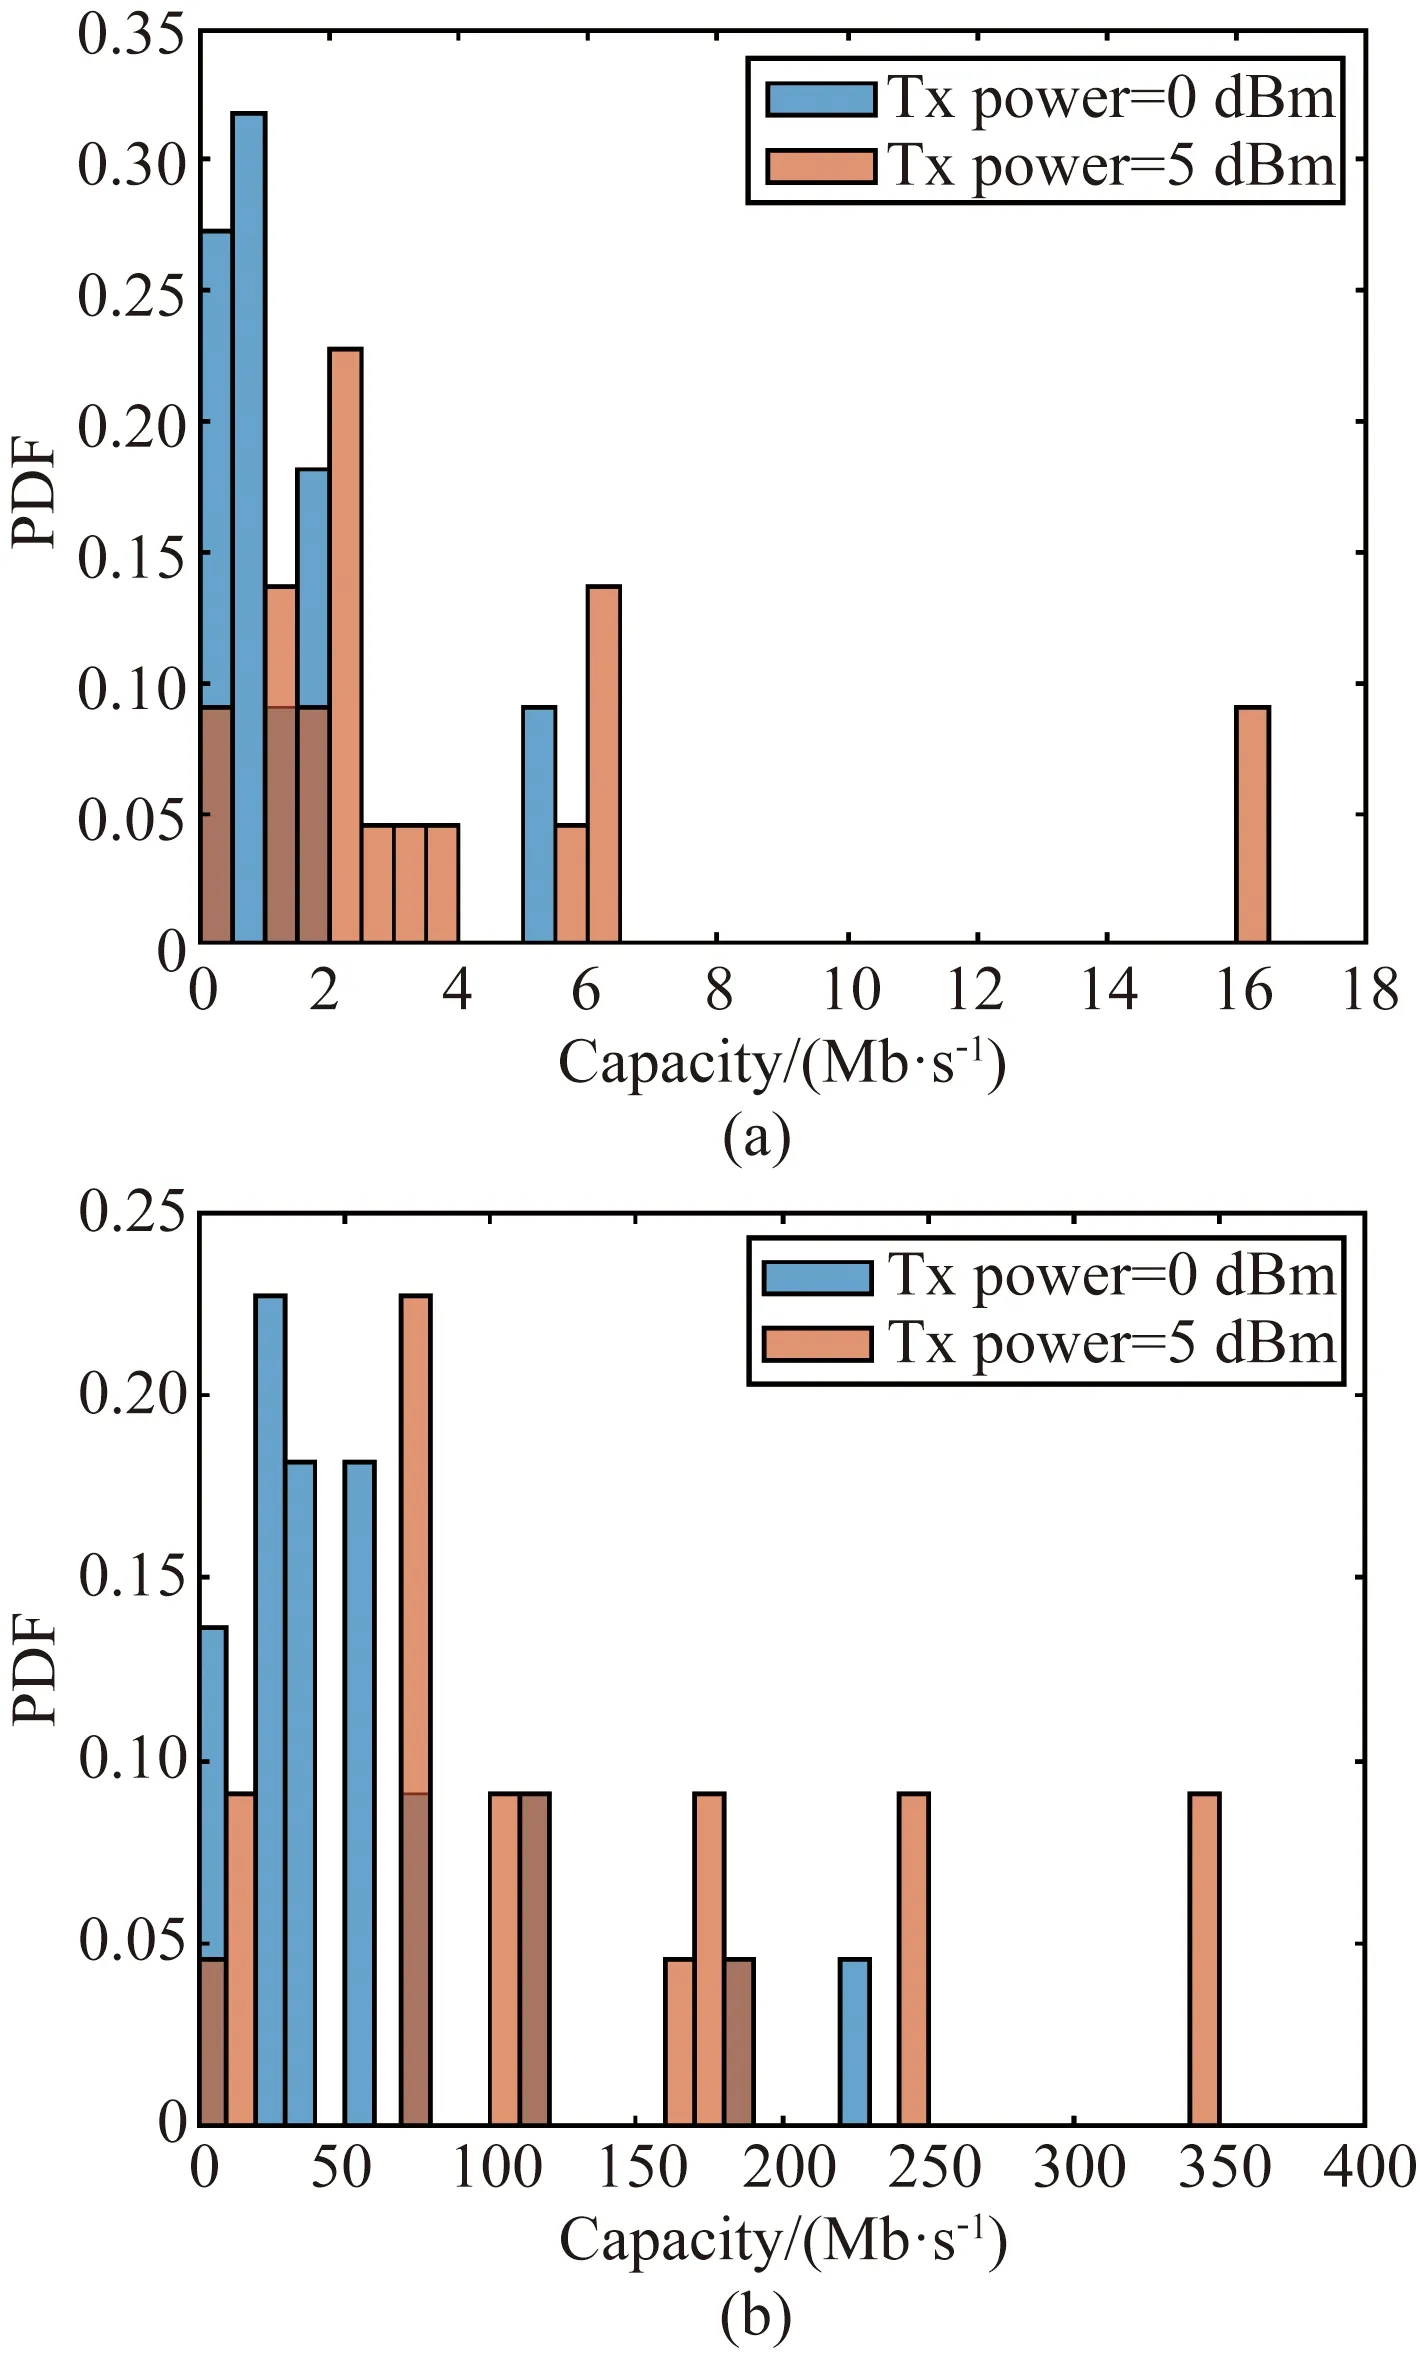
Fig. 13 Histograms of channel capacity in (a) LoS and (b) NLoS
2.6.3Channelcapacityofchangedposition
Figure 13 gives the histograms of channel capacity. We can find that it has higher channel capacity when changing the positions of transceivers in LoS. For NLoS, although the overall capacity does not change too much, the probability of capacity more than 10 Kb/s is increased. This makes it easier to achieve higher capacity in NLoS.
Therefore, we get better characteristics by changing the antenna layout. Including the RMS-DS in LoS is reduced and the received power in NLoS is increased. Meanwhile, the channel capacity is improved. This will become a reference for layout of the antenna in the future.
3 Conclusions
This paper uses the ray tracing algorithm to simulate the indoor corridor channel parameters at 300 GHz. In the simulations, we analyze the large-scale and small-scale parameters, including PL, RMS-DS, and RMS-CAS. We can know that it is suitable for short distance communication due to large PL at 300 GHz. Meanwhile, the correlation of frequency components in NLoS is better due to bigger coherent bandwidth than in LoS. Besides, the distance-dependent behavior of RMS-DS and RMS-CAS is obtained and can be modeled well by a stochastic model. The simulation results show the probability distribution of capacity under different transmitted power. It can be concluded that, increasing the transmitter power or antenna gain effectively is a key method to improve the channel capacity. Finally, the RMS-DS is significantly reduced and the capacity is enhanced in both LoS and NLoS by changing the position of the transceivers. This work can be useful for the design and application of the terahertz band in indoor wireless communication in the future.
猜你喜欢
情感读本·道德篇(2022年2期)2022-04-12
红蜻蜓(2022年3期)2022-03-19
红蜻蜓(2022年2期)2022-03-19
妇女生活(2021年10期)2021-10-27
红蜻蜓(2021年8期)2021-08-23
早期教育(家庭教育)(2020年1期)2020-05-28
作文·小学中高年级(2020年2期)2020-04-08
速读·上旬(2019年4期)2019-09-10
阅读(低年级)(2018年6期)2018-05-14
读写算·小学低年级(2017年4期)2017-04-15
 Journal of Donghua University(English Edition)2021年3期
- Journal of Donghua University(English Edition)的其它文章
- Surface Modification of Electrospun Poly(L-lactide)/Poly(ɛ-caprolactone) Fibrous Membranes by Plasma Treatment and Gelatin Immobilization
- Probabilistic Load Flow Algorithm with the Power Performance of Double-Fed Induction Generators
- Outage Probability Based on Relay Selection Method for Multi-Hop Device-to-Device Communication
- Electromagnetism-Like Mechanism Algorithm with New Charge Formula for Optimization
- Prediction of Online Judge Practice Passing Rate Based on Knowledge Tracing
- Raoultella terrigena RtZG1 Electrical Performance Appraisal and System Optimization