
Study on Distribution of Electrocatalytic Reaction Efficiency in a Three-Dimensional Electrocatalytic Reactor
2021-10-09 08:51LuKaitianZhangYonggang
中国炼油与石油化工 2021年3期
Lu Kaitian; Zhang Yonggang
(School of Environmental Science and Engineering, Tiangong University, 300387)
Abstract: In order to explore the effect of particle position on the electrocatalytic reaction rate at different positions in three‐dimensional electrocatalytic reactor, using methylene blue as the simulated organic wastewater, and spherical graphite particles as the particle electrode, the potential distribution in three‐dimensional electrocatalytic reactor was simulated by using COMSOL Multiphysics software.A multivariate logarithmic regression model of reaction kinetic constant and position was established by mathematical statistics.The electrocatalytic reaction rates were predicted at different locations in the reactor.The results show that the degradation ability of particle electrode to pollutants is uneven in the electrocatalytic reactor.The increase of electric field intensity and particle size will improve the difference of reaction rate.The closer the particle electrode is to the anode, the stronger the pollutant degradation ability would be.The reaction rate of the same particle electrode at different locations varies greatly, which can be roughly divided into three regions according to the degree of difference, among which the central region of the particle has the highest electrocatalytic reaction efficiency.
Key words: particle electrode; COMSOL multiphysics; electrocatalytic efficiency; logarithmic regression model
1 Introduction
In recent years, three‐dimensional electrocatalytic oxidation technology has been considered as an effective method to treat industrial wastewater.Compared with the traditional two‐dimensional electrode method, the three‐dimensional electrode method can effectively improve the specific surface area and mass transfer efficiency of the reaction electrode, and the particle electrode itself also has good wastewater treatment performance[1‐2].However,a large number of reports mainly focus on the materials and working conditions of particle electrodes[3‐6], while ignoring the influence of particle size and position of particle electrodes.In the study on the third electrode,Qi, et al.[7]found that increasing the length of bipolar electrode (BPE) can increase the potential difference at the electrode ends, and the position of maximum electrocatalytic reaction rate is located at both ends of the third electrode plate.Robles, et al.[8]using activated carbon (AC) as particle electrode, investigated the influence of particle size distribution on the performance of electrocatalytic reactor, the results show that a larger AC particle distribution range can improve the electrical contact between particles and promote electrochemical reaction.Luo, et al.[9]found in the experiment of simulating particle electrodes using open circuit electrode plates that when the distance between the two ends of the particle electrodes increases, the reaction current generated inside also increases.As it can be seen from that above‐mentioned report, the electrocatalytic reaction of particle electrode is affected by the size of particle size, the distance between two ends and the position,when the particle size of the particle electrode changes,the polarization degree and reaction speed of the particle electrode at different positions are also different.In order to study the distribution of electrocatalytic reaction rate,it is necessary to accurately measure the electrocatalytic reaction rate at each point in the reactor.However, only the average reaction rate can be obtained in the reactor by the traditional experimental methods.
With the popularization and development of computer technology, numerical simulation software can provide many possibilities for the study of three‐dimensional electrocatalytic reaction.Computational fluid dynamics(CFD) technology can be used to optimize the structure of electrode assembly and reactor[10‐11], but the study only considered the mass transfer process of electrocatalytic reaction without considering the influence of electrode polarization.The “secondary current distribution” module in the finite meta‐software COMSOL Multiphysics can solve the problem of particle electrode polarization, and has been applied in magnesium electrolysis cells and lithium battery electrolysis and other fields[13‐14].Due to a lack of micro-level mechanism research of threedimensional electrocatalytic reaction[15], it is difficult to achieve the results consistent with the actual situation that can be only realized by using COMSOL software to solve the rate distribution of a three‐dimensional electrocatalytic reaction.Some studies have used the Box‐Behnken response surface methodology to establish a regression model to link the degradation effect of pollutants in the three‐dimensional electrocatalytic reactor with relevant variables to determine the best process conditions[12].Inspired by this idea, this paper first uses the “secondary current distribution” module in COMSOL software to calculate the potential at different positions in the reactor.Then, with particle size, potential and position serving as the independent variables and the kinetic constant of degradation of methylene blue at a certain concentration acting as the dependent variable,a logarithmic regression model was established, and the distribution of electrocatalytic reaction efficiency was predicted by combining the relationship between the reactor variables and the pollutant degradation effect.The potential distribution and logarithmic regression model are verified by experiments to determine the feasibility of the model.
2 Experimental
The wastewater treatment was carried out in a rectangular three‐dimensional electrocatalytic reactor with a reactor size of 90 mm×60 mm×110 mm, and an electrode plate size of 18 mm×1 mm×64 mm.The wastewater is a 15 mg/L methylene blue aqueous solution with addition of 4 g/L of NaCl as the supporting electrolyte.The graphite particles, after adsorbing methylene blue solution until being fully saturated with methylene blue, were placed in a porous insulating plastic mesh.Firstly, it is required to change the particle sizeX(3 mm‒12 mm), location L(13‒20 mm) and potentialU(4‒7 V) of graphite particles,as shown in Figure 1.An UV spectrophotometer was used to measure the degradation concentration of methylene blue solution in 15 minutes under different conditions.The experimental results show that the electrocatalytic oxidation process conformed to the first-order reaction kinetics, and 256 groups of first‐order reaction kinetic constants under different conditions were recorded.The calculation formula is shown in (1):

Figure 1 Schematic diagram of electrocatalytic reaction structure simulating single particle electrode
First‐order reaction kinetics[16]:

whereKiis the kinetic constant of the first‐order reaction(mg/L·s);C0is the initial concentration of methylene blue(mg/L);Cis the residual concentration of methylene blue(mg/L) after degradation, andtis the time (s).
3 Model Description
3.1 Logarithmic regression model
In order to reduce the collinearity between independent variables and ensure that the linear relationship between independent variables and dependent variables is satisfied,the experimental data are logarithmically processed[17], as shown in equation(2):

whereuiis the unobservable interference term;Uiis the applied potential difference;Liis the position (distancefrom anode to cathode);Xiis the particle size, andβiis the variable coefficient.
White test[18]and variance inflation factor (VIF)[19]analysis were used to evaluate whether the model has heteroscedasticity and collinearity.
3.2 The model of simulation
The “secondary current distribution” and “current distribution, shell distribution” modules are selected in COMSOL software to simulate the potential distribution in the three‐dimensional electrocatalytic oxidation reactor[20].The “porous electrode” window in the “secondary current distribution” module is used to simulate the particle electrode, and the total current density in the “current distribution, shell distribution”module is coupled with the “secondary current distribution” electrode potential distribution.In order to avoid the problem of potential network anisotropy in the interface layer between the particle electrode and the electrolyte, a free tetrahedral mesh is selected in the particle electrode region and a triangular mesh is selected in the electrolyte region.Before solving the potential distribution, the “secondary current distribution” module is initialized, and the 4‒7 V potential is parameterized to scan in the “steady‐state solver” window.The relevant parameters of boundary conditions are shown in Table 1.

Table 1 Relevant parameters of the test
Due to the small electrode spacing of the reactor and the large potential difference of the particle electrodes,the Tafel formula can be used to describe the potential distribution inside each particle electrode[21], as shown in Equation (3).The potential distribution of the particle electrode surface polarization process is shown in Equation (4).Assuming that the conductivity of the electrolyte is a constant, the mass transfer can be ignored,and only the electrode reaction process and polarization of the particle electrode are considered[22].The current density on the surface of the particle electrode and the electrolyte region can be obtained through a constant conductivity, as shown in Equations (5) and (6).The equilibrium potential of the particle electrode reaction can be measured by using an electrochemical workstation,and the electrochemical reaction directly involved is shown in Equation (7).
The Tafel formula:

in whichaandbare the Tafel constant,ηis the overpotential (V) , andiis the current density (A/m2).

where ∅sis the electrode potential (V); ∅lis electrolyte potential (V);Eeqis the equilibrium potential of the particle electrode (V).

whereIsis the particle electrode current density vector(A/m2), andσsis the conductivity of the particle electrode(S/m).

whereIlis the electrolyte current density vector(A/m2),σlis the conductivity of the electrolyte (S/m),Tis the temperature (K), andSis the electrolyte film thickness(m).The electrode reaction of the particle electrode is as follows[23]:

In the above equation,Eeqis the equilibrium potential relative to the standard hydrogen electrode (SHE) under standard conditions.
3.3 Calculation of rate distribution of electrocatalytic reactions
Using COMSOL Multiphysics software, the potential at different positions in the reactor can be calculated, and the results can be substituted into the logarithmic regression relationship model.As shown in Figure 2, the sum ofreaction kinetic constantsKi-1between the adjacent pointAi-1and the cathodeBwas obtained in the same manner by assuming that the sum of the reaction kinetic constants between a certain pointAiand a cathodeBin the reactor wasKi.Assuming that the electrocatalytic reaction rate nearAipoint is invariant, the first‐order reaction kinetic constantkiand the degradation rateRatAipoint can be obtained from Equations (10) and (11).The calculation process is as follows:

Figure 2 Schematic diagram of electrocatalytic efficiency at different locations

in whichkiis the kinetic constant of a certain point in the electrocatalytic reactor, andKiis the sum of the kinetic constants of all positions between this point and the cathode.
4 Results and Discussion
4.1 Simulation results of potential distribution in three-dimensional electrocatalytic reactor
The potential distribution in the three‐dimensional electrocatalytic reactor was simulated by COMSOL multiphysics software.Figure 3 shows the potential distribution nephogram of three‐dimensional electrocatalytic reactor under conditions covering an external voltage of 7 V and an electrode spacing of 30 mm.It can be seen that the potential distribution in the reactor is uneven.The electrode potential inside the particle is low, and the electrolyte potential outside the particle is high, which leads to the potential difference between different positions of the particle electrode.According to the Tafel equation, increasing the potential difference will enhance the current density of the particle electrode in the local area.It can be seen from Equation(12) that the increase of current density promotes the increase of reaction kinetic constant, so the filled conductive particles can improve the electrocatalytic efficiency by changing the potential distribution in the reactor.
It can be seen from Figure 4(a) that the increase of particle size can enhance the electrolyte potential outside the particle and decrease the particle electrode potential inside the particle, so that the potential difference of the particle raises with the increase of particle size.When the particle electrode size is 3 mm, the average potential difference of the particle electrode is 0.26 V; when the particle size of the particle electrode is 10 mm, the average potential difference of the particle electrode is 0.89 V.Figure 4(b) compares the electrolyte potential and particle electrode potential of the particle with a diameter of 6 mm at different positions.It can be found that when the particles are close to the electrode plates on both sides,the potential difference between the particle electrode potential and the electrolyte potential is large.The average potential difference between the particles near the anode and the cathode is 1.3 V and 0.6 V, respectively.However,when the particles are in the middle of the reactor, the average potential difference between the particle electrode potential and the electrolyte potential is only 0.2 V.
The relation between the reaction rate constant and current density[24]is:

whereiis the current density (A/m2),nis the number of electrons,Fis the Faraday constant (C/mol).
The surface potentials at different positions at the interface between particle electrode and electrolyte solution were measured by a multimeter.A reactor with an electrode spacing of 60 mm was used for verification,and the simulation results were compared with the experimental results.The results are shown in Figure 5.The COMSOL simulation results are basically consistent with the experimental results, and can simulate the potential at different positions of the reactor.

Figure 3 Numerical simulation of the potential distribution of particle electrode with a different particle size in a reactor with an electrode spacing of 30 mm

Figure 4 The relationship between particle size or position and potential distribution

Figure 5 Diagram for comparing the potential at different locations at the interface between particle electrode and electrolyte
4.2 Logarithmic regression model for reaction rate constant of particle electrode
In the White test of multivariate logarithmic regression model, it is found that the value of disturbance termis less than 0.05, which indicates that the variables of logarithmic regression model have heteroscedasticity.In the VIF analysis, the VIF and Mean VIF of each variable are less than 10, indicating that there is no collinearity between the variables after logarithmic processing.In order to weaken the influence of heteroscedasticity on the regression model, this paper uses OLS+Heteroskedasticity Robust Standard Error Method to correct the coefficient of logarithmic regression model,and the correction results are shown in Table 2.
It can be seen from Table 2 that the P values of each variable are less than 0.01, indicating that particle size,position, and potential have significant effects on the kinetic constants of the first‐order reaction.Judging from the Beta data in Table 2, it can be seen that the electric field intensity is the main factor affecting the electrocatalytic reaction rate, and the particle size is the secondary factor, while the position has the leastinfluence on the electrocatalytic reaction efficiency and has a negative influence.The effect of particle size on electrocatalytic reaction rate is mainly due to the good conductivity of particle electrode itself.Since it is a single particle electrode experiment[25‐26], the interference of low permeability, high resistance and blockage caused by particle electrode accumulation are ignored.When the particle size of the particle electrode increases, the potential difference between the inner and the outer positions of the particle electrode will increase, which can improve the electrocatalytic reaction.On the other hand, if the influence of particle size on electrocatalytic performance is ignored, when the particle electrode is far from the anode, the distance of electron convection and diffusion will increase, and the electrocatalytic reaction rate will decrease.The relationship between the three variables can be analyzed independently through the multivariate logarithmic regression model, and the reaction rate at different positions and potentials can be determined by using the variation coefficients in Table 2.

Table 2 Regression model
In order to verify whether the logarithmic regression model is consistent with the actual situation, this paper controls different external potentialsU, particle sizeX,and positionL(distance from anode to cathode).The simulation results of methylene blue solution with a concentration of 15 mg/L after degradation for 5 minutes are compared with the actual results.As shown in Fig 6, it can be seen that the simulation results are slightly higher than the actual results, but the overall prediction results are relatively close to the actual results, and the fitting degreeRvalue reaches 0.96.
4.3 Distribution of electrocatalytic degradation efficiency of particle electrode at different locations
As shown in Figure 7, the electrocatalytic reaction efficiency of particles at different locations is predicted under the assumption that the reaction rate of each point in the particle is the same.It can be seen from the figure that the degradation ability of the particle electrodes placed at different positions is uneven.Taking the three‐dimensional electrocatalysis reactor with a particle size of 3 mm as an example, as shown in Figure 7 (a), when the electric field strength is 7 V, the degradation rate of methylene blue pollutant by particles near the anode is 68.51%, and the degradation rate of methylene blue pollutant by particles near the cathode is only 0.14%.At the same time, the degradation ability of particles to pollutant increases with the approaching of particles from anode.The degradation ability of particles to pollutant increases as the particles approach the anode.When the particle electrode is located near the anode, the potential difference of the particle electrode is higher, which can promote the electrocatalytic reaction.At the same time,the particles near the anode can also reduce the mass transfer distance of electron convection and pollutant diffusion, and can improve the rate of electrocatalytic reaction.The particles are close to the cathode, due to the close distance between the particles and the cathode,the filling amount between the particles and the cathode decreases, thus the electrocatalytic reaction rate would decrease.

Figure 6 Chart for comparison of regression model prediction results and actual results after degradation of 15mg/L methylene blue solution by particle electrode for 5 minutes under different conditions
It can also be found from Figure 7 that changing the electric field intensity of the external potential not only can improve the overall electrocatalytic efficiency in the reactor, but also can improve the difference of the electrocatalytic reaction intensity of the particle electrodes at different locations.When the electric field intensity is 4 V and the particle size is 6 mm, the degradation rate of particles at different positions ranges from 1.55%‒32.67%;when the electric field intensity is increased to 7 V, the degradation rate of particles at different positions ranges from 6.36%‒79.86%.
Compared with the degradation effect of different particle electrodes, it can be seen that the larger the particle size, the greater the electrocatalytic efficiency.When the particle size is 3.75 mm, the degradation rate of the particles near the anode is 72.53%, and when the particle size is 7.5 mm, the degradation rate of the particle pollutants near the anode is 83.2%.The reason for this phenomenon is that with the increase of particle size,the potential difference between the particle electrode potential and electrolyte potential will increase, which leads to the improvement of the ability of single particle to degrade the pollutants.Upon comparing the total amount of pollutant in the reactor with different particle sizes, it is found that under the same electrode spacing,the particle size has little effect on the total degradation efficiency of pollutant in the electrocatalytic reactor, but the particle size of the particle electrode can change the difference of the efficiency of the electrocatalytic reaction at different positions.
4.4 Electrocatalytic performance of the internal position of the particle electrode
Figure 8 shows the distribution of kinetic constants of electrocatalytic reaction at different positions inside the particle electrodes with different particle sizes.It can be seen that the reaction efficiency of the internal position of the particle electrode is not uniform.As shown in Figure 8(f), when the electric field intensity is 7 V, the reaction kinetic constant of particles near the anode at 20 mm is 0.003 mg/(L·min), the reaction kinetic constant at 25 mm is 0.102 mg/(L·min), and the reaction kinetic constant at 30 mm is 0.013 mg/(L·min).According to the difference in the degradation ability of methylene blue pollutant at different sites, the different positions of a single particle electrode can be divided into three regions, as shown in Figure 9.The position with higher degradation rate isconcentrated in the center of spherical particles, and the distribution of degradation efficiency at this position is quite different.The electrocatalytic efficiency at the two sides of the particle is smaller than that at the center.However, the degradation rate at both sides is evenly distributed, and among them the degradation efficiency of the particles near the anode side is slightly higher than that near the cathode side.
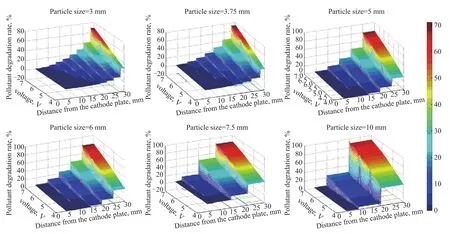
Figure 7 Distribution of electrocatalytic efficiency after degradation of 15 mg/L of methylene blue solution by particle electrode at different positions in the reactor for 5 minutes

Figure 8 Kinetic constants of reaction at different sites in a three dimensional electrocatalytic reactor
The central position of the particle electrode can produce higher electrocatalytic efficiency, which is mainly due to the low central potential of the spherical particle electrode,which can increase the potential difference by interacting with the potential of the external electrolyte, thus improving the electrocatalytic efficiency of the central position of the particle electrode.Upon comparing the electrocatalytic efficiency of particle electrodes with different particle sizes at each point of the reactor, when the particle is close to the anode, the area with higher electrocatalytic efficiency of 3‐mm particles is between 27.9‒29.1 mm, as shown in Figure 8(a).The area with higher electrocatalytic reaction efficiency of 10‐mm particle is between 23 mm and 27 mm, as shown in Figure 8 (f).It can be seen that with the increase of particle size, the central region with high electrocatalytic performance also increases, accounting forabout 40% of the particle size length.

Figure 9 Regional division of electrocatalytic reaction rate at the same particle electrode based on different sites
5 Conclusions
On the basis of experimental verification, the electrocatalytic reaction rate of each point in the electrocatalytic reactor was simulated by numerical simulation.The effects of the position of the particle electrode, the electric field intensity, the particle size of the particle electrode and the internal points of the particle electrode on the electrocatalytic reaction rate were studied.The results suggest that the particle electrode has an intense electrocatalytic reaction near the anode, and the electrocatalytic reaction weakens with the particle electrode being away from the anode.When the electric field intensity is 7 V and the particle size is 3 mm, the degradation rate of the particles near the anode is 68.51%, while the degradation rate of the particles near the cathode is only 0.14%.
With the increase of electric field intensity, the inhomogeneity of reaction efficiency distribution in the electrocatalytic reactor also increases.When the electric field intensity is 4 V, the degradation rate of the particle electrode with a particle size of 6 mm at different positions ranges from 1.55%‒32.67%; when the electric field intensity increases to 7 V, the degradation rate of the particle electrode at different positions ranges from 6.36%‒79.86%.
Increasing the particle size of particle electrode can improve the electrocatalytic reaction of single particle through increasing the potential difference of single particle.When the particle electrode is placed near the anode, the pollutant degradation efficiency of the particle electrode, 7.5 mm in particle size, is by 1.15 times higher than that of the particle electrode, 3.75 mm in particle size.
In the study of the electrocatalytic reaction efficiency generated at various positions inside the particle electrode,it was found that the locations with higher electrocatalytic efficiency were concentrated in the central region of the particle electrode.The area of the central region of the particle electrode increased with the increase of particle size, and the length of the central region was equal to 40% of the particle diameter.When the particle electrode is close to the anode side, the central area of the particle electrode with a particle size of 3 mm is 1.2 mm; when the particle size of the particle electrode increases to 10 mm, the range of the central area increases to 4 mm.

- 中国炼油与石油化工的其它文章
- Controlling the Pore Structure and Photocatalytic Performance of the Flexible FeⅢ Metal-Organic Framework MIL-53(Fe) by Using Surfactants
- Synthesis of Bimodal Mesoporous TiO2 -PTA/BMMS and Its Enhanced Performance in the Photocatalytic Oxidative Desulfurization
- Chemoselective Catalytic Hydrogenation of Nitroarenes Using MOF-Derived Graphitic Carbon Layers Encapsulated Ni Catalysts
- Preparation of Ultra-High Molecular Weight Polypropylene Using Ziegler-Natta Catalyst via Combining Internal Electron Donor and Cocatalyst Loading
- Preparation of Modified Enteromorpha-Immobilized Microbial Agent and Research on Diesel Removal Performance
- Acidity Evaluation of Industrially Dealuminated Y Zeolite via Methylcyclohexane Transformation