
Toroidal component of velocity for geodesic acoustic modes in the edge plasmas of the J-TEXT tokamak
2021-10-31 08:15YaoyuXIE谢耀禹KaijunZHAO赵开君ZhipengCHEN陈志鹏JiaqiDONG董家齐KimitakaITOHZhongyongCHEN陈忠勇YuejiangSHI石跃江YonghuaDING丁永华JunCHENG程钧LongwenYAN严龙文HaiLIU刘海ZhifengCHENG程芝峰ZhoujunYANG杨州军NengchaoWANG王能超LuWANG王璐JianqiangXU许健强Yunfe
Plasma Science and Technology 2021年10期
Yaoyu XIE (谢耀禹), Kaijun ZHAO (赵开君), Zhipeng CHEN (陈志鹏),Jiaqi DONG (董家齐), Kimitaka ITOH, Zhongyong CHEN (陈忠勇),Yuejiang SHI (石跃江), Yonghua DING (丁永华), Jun CHENG (程钧),Longwen YAN (严龙文), Hai LIU (刘海), Zhifeng CHENG (程芝峰) ,Zhoujun YANG (杨州军), Nengchao WANG (王能超), Lu WANG (王璐) ,Jianqiang XU (许健强), Yunfeng LIANG (梁云峰) and J-TEXT Team,9
1 School of Nuclear Science and Engineering, East China University of Technology, Nanchang 330013,People’s Republic of China
2 International Joint Research Laboratory of Magnetic Confinement Fusion and Plasma Physics,State Key Laboratory of Advanced Electromagnetic Engineering and Technology,School of Electrical and Electronic Engineering, Huazhong University of Science and Technology, Wuhan 430074, People’s Republic of China
3 Southwestern Institute of Physics, Chengdu 610041, People’s Republic of China
4 Institute of Science and Technology Research, Chubu University, Aichi 487-8501, Japan
5 Research Center for Plasma Turbulence, Kyushu University, Kasuga 816-8580, Japan
6 National Institute for Fusion Science, Toki 509-5292, Japan
7 ENN Science and Technology Development Co., Ltd, and Hebei Key Laboratory of Compact Fusion Langfang 065001, People’s Republic of China
8 Institute of Fusion Science, School of Physical Science and Technology, Southwest Jiaotong University,Chengdu 610031, People’s Republic of China
Abstract The toroidal component of the velocity for geodesic acoustic modes (GAMs) is first demonstrated.Multiple Langmuir probe arrays set up near the top tokamak of the J-TEXT were utilized for this study.A significant peak at the GAM frequency is observed in Mach number fluctuations.The toroidal velocity for the GAMs is estimated as∼10–100 m s−1 and increases with the poloidal velocity.The ratio of toroidal component to the poloidal one of the velocity is mainly located in the interval between 0.3 and 1.0.With higher safety factors q,the ratio almost does not change with decreasing the safety factor, whereas it goes up sharply at low q.The coherencies between poloidal electric fields and Mach number fluctuations in turbulence frequency bands are also evaluated, and are higher than those between radial electric fields and Mach number fluctuations.
Keywords: zonal flow, geodesic acoustic mode, tokamak, return flow, Mach number
1.Introduction
Zonal flows (ZFs) self-generated by turbulence widely exist in nature and laboratory plasmas.Typical examples include space plasmas and magnetically confined laboratories,as well as atmospheres of stars.This study in the fusion field aims at understanding the nonlinear mechanism responsible for the coherent structure formation and for anomalous cross-field transport induced by turbulent fluctuations.
It has been recognized in the last decade that the E×B sheared flows can reduce or even suppress the microscale turbulence and thus transport due to turbulence.Generally,the sheared flows exist in the forms of the mean flows due to ion pressure gradient and the zonal flows driven by turbulence[1–4].The sheared flow formation due to turbulence nonlinear interaction via Reynolds stress has been well documented[3].This suggests that a feedback loop exists between turbulence and sheared flows.The turbulence-flow system can organize and regulate itself [5, 6].
Two kinds of ZFs have been detected in toroidal plasmas,called the low-frequency zonal flows(LFZFs)[4,7]with zero frequency and the geodesic acoustic modes (GAMs) [8, 9]having finite frequency,whereγiis the adiabatic index,TiandTeare ion and electron temperature, respectively, andMiandRare ion mass and major radius of the torus, respectively.The ratio of the toroidal component to the poloidal one of the velocity is expected to be −2qcosθ for the LFZFs (whereqis the safety factor and θ is the poloidal angle), and that for the GAMs isq−1cosθ [3].
In the last two decades,the LFZFs and GAMs have been studied extensively [10–24].The common features of GAMs and LFZFs have been obtained in a great number of devices.They all show the poloidal and toroidal symmetries, and the finite radial wave vectors [10–15].The density fluctuation of the GAMs in the top plasmas of the tokamak is higher than that in the middle plane [16].The bicoherence analysis suggests that the nonlinear three-wave coupling between the ZF and ambient turbulence(AT)is a possible mechanism for the ZF formation [10, 14].The direct measurements of nonlinear energy transfer among LFZFs, GAMs and turbulence show that the kinetic energy is transferred from turbulence into LFZFs and GAMs [17].The comparison of turbulence stress force and dynamic force of GAMs suggests that GAMs are driven by turbulence stresses dominantly[18].The role of the LFZFs during low to high confinement mode(L–H)transition and transport barrier formation is examined [19–21].Nevertheless, the toroidal components of the velocity for the ZFs have not been studied experimentally.
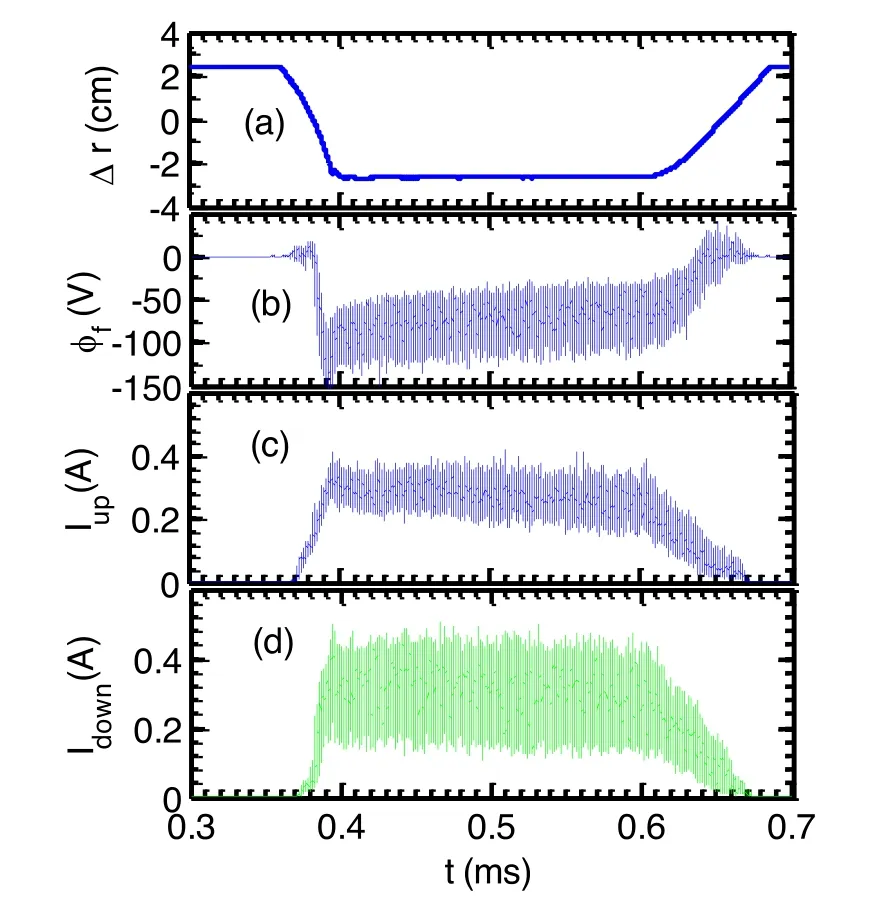
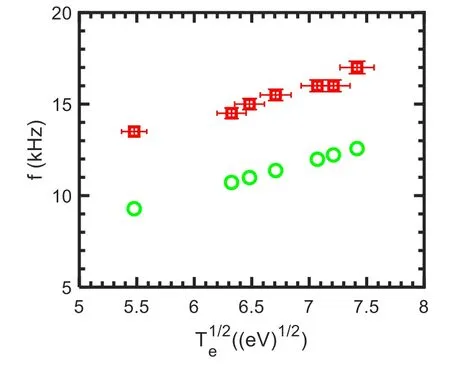
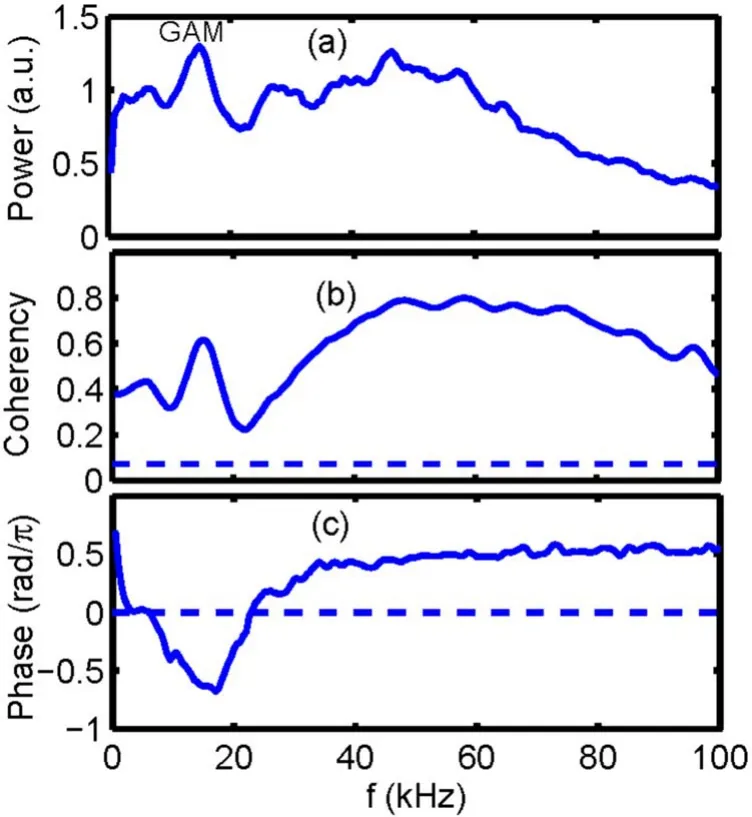
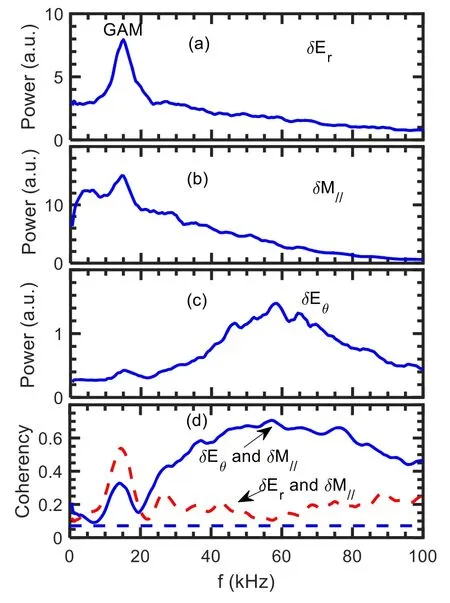
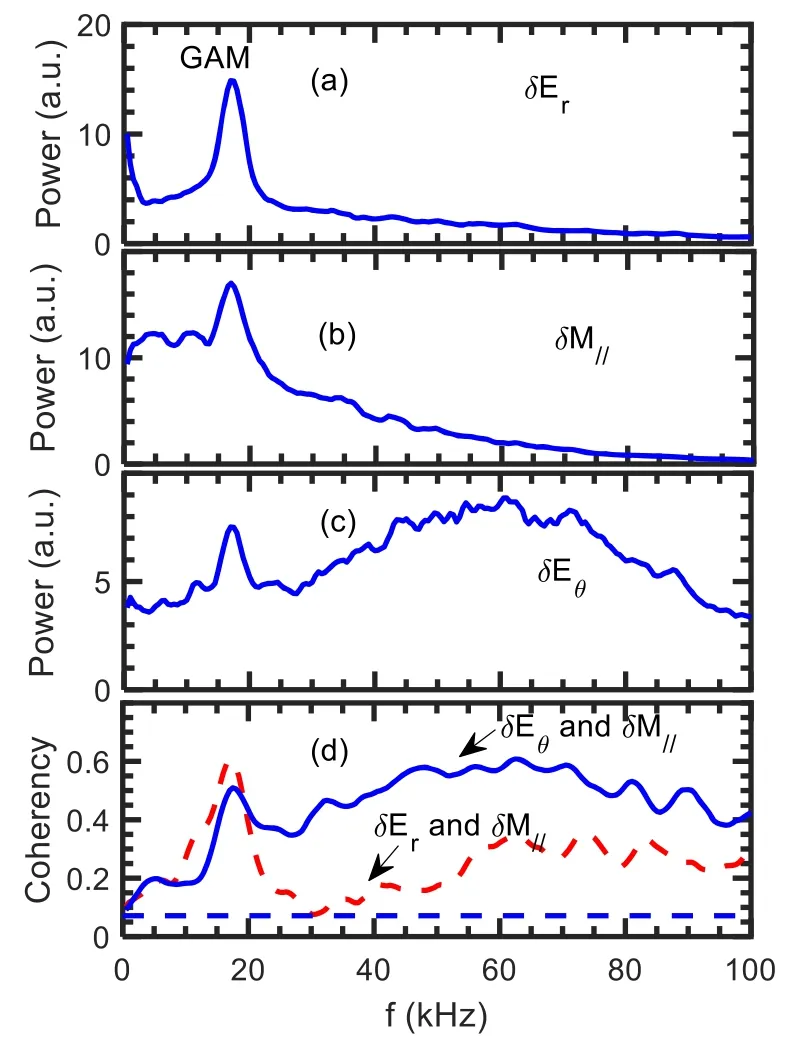
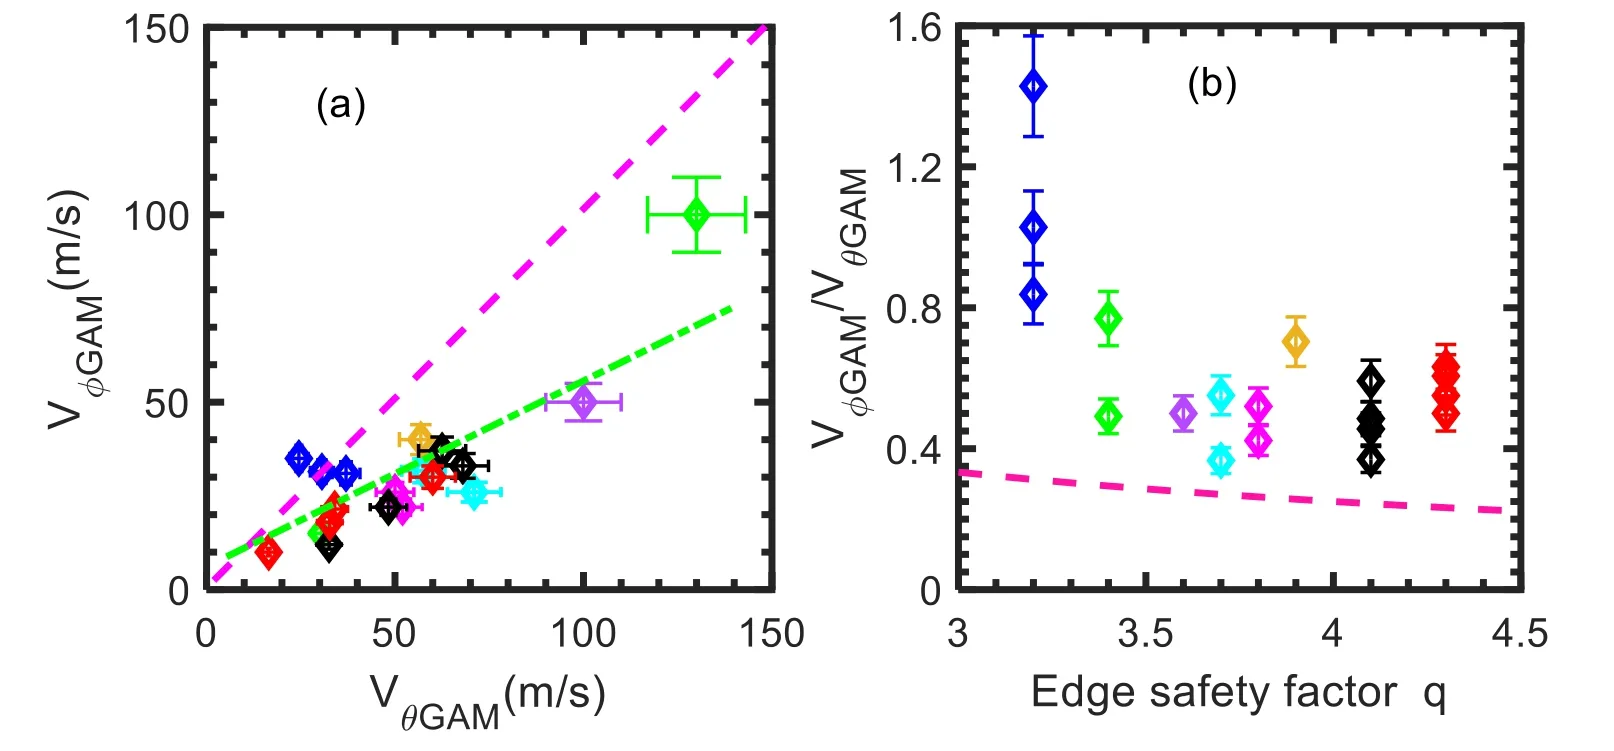
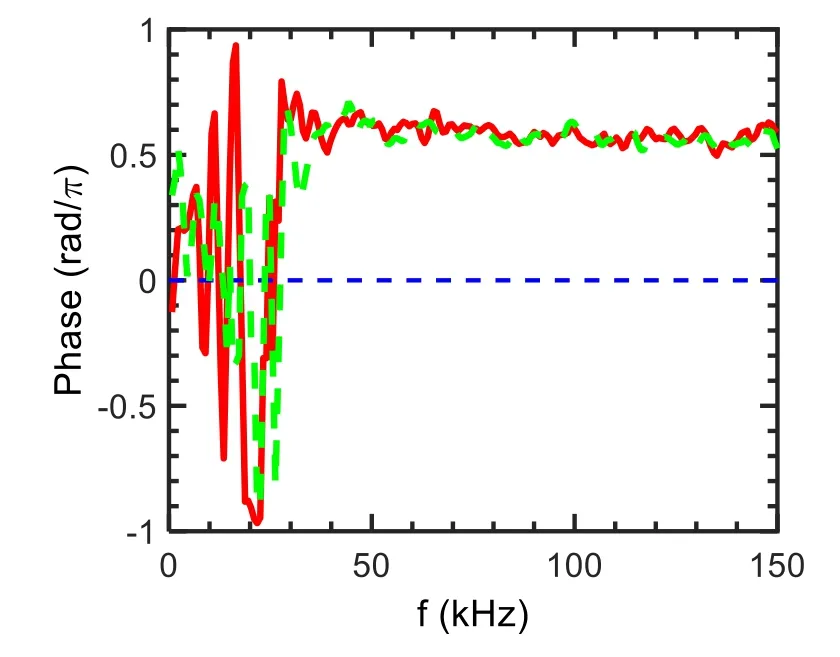
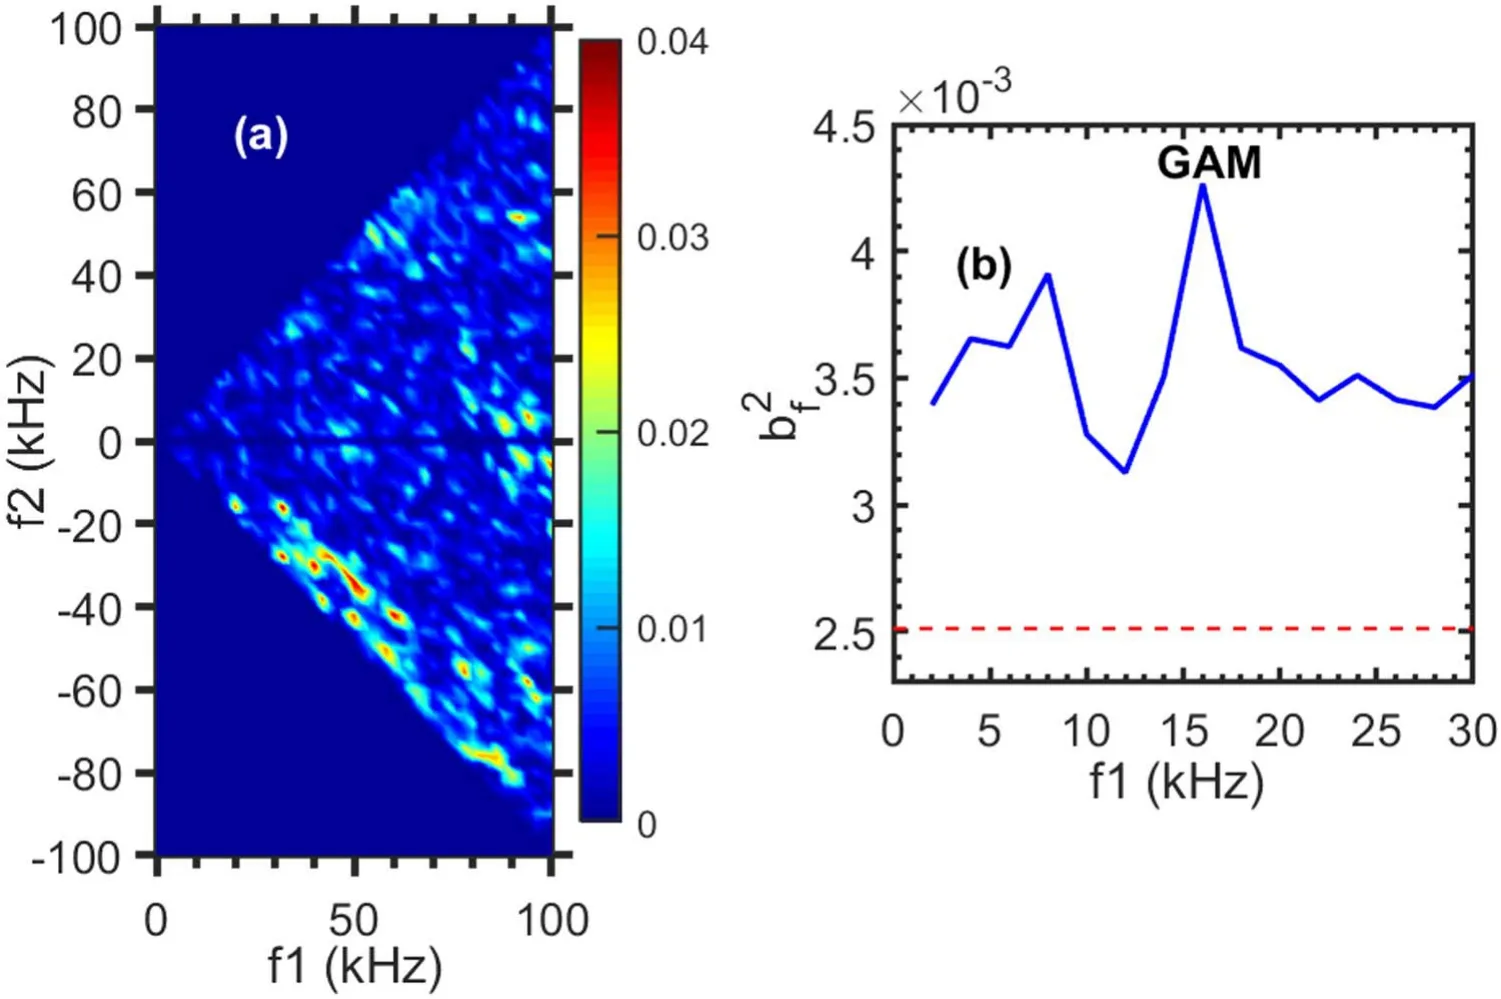
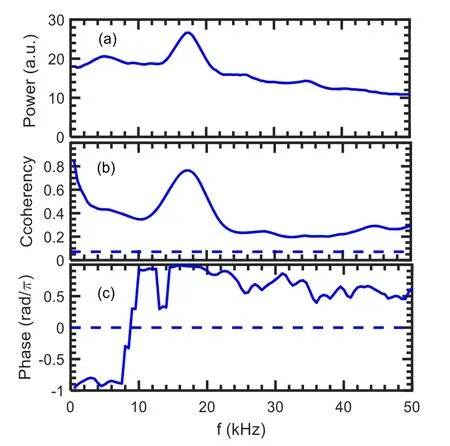
Here, the toroidal component of the velocity for the GAMs is presented.The toroidal velocity is ∼10–100 m s−1and increases with the poloidal velocity.The ratio of the toroidal velocity to the poloidal one is ∼0.3–1.0.In the region of 3.5 The structure of the remaining work is as below.Section 2 gives the experiment arrangement.Section 3 provides the experimental results, involving the properties of GAMs, toroidal component of the velocity for the GAMs,phase shifts between radial electric field and Mach number fluctuations in turbulence frequency band, statistical analysis of the velocities for the GAMs, nonlinear coupling and turbulence modulation etc.Sections 4 and 5 present the discussion and conclusion, respectively. The experiments were performed in Ohmic plasmas with limiter configuration on the J-TEXT tokamaks.The major radius isR=1.05 m and the minor radius isa=0.255 m for the J-TEXT tokamak [22].The toroidal magnetic field isBt=1.5–2.0 T and the plasma current isIp=150–180 kA.The line averaged electron density and the edge safety factor areNe=(1–3)×1019m−3andqa=3.2–4.3, respectively.The charging gas is hydrogen and the plasma shape is circular.In this experiment, a fast reciprocating probe array is used to measure the floating potentials, density, electron temperature and Mach number,etc[23].This probe array has two steps and 12 tips as shown in figure 1.It was set up on the top of the J-TEXT tokamak.Because of Shafranov displacement, the probe array is located at the position with a poloidal angle of θ∼85°.On the other hand,the ratio of the toroidal component to the poloidal one of the velocity is expected as ∼q−1cosθ for the GAM.These made it possible to measure the toroidal flows of the GAMs.To avoid the shadow,pins 2 and 4,and 6 and 8,should not be too close to their connecting lines with respect to magnetic field line;there is a small deviation of the angle.Assuming that they are shadowed, the measured density will be underestimated.For this experiment, the shadow is examined through changing the angle, and it does not occur.The diameter and length of the tips are 2 mm and 3 mm, respectively.The sampling rate for the digitizer is 2 MHz. Figures 2(a)–(d)describe the movement of the Langmuir probe array, floating potentials and ion saturated current measured by the Mach probe at the up and down sides,respectively.The Δrmeans the distance between the last closed flux surface (LCFS) and the measurement point.The negative sign of the Δrindicates inside the LCFS.The data were analyzed when the probes stayed inside the plasmas stably. Figure 1.Langmuir probe array,Vf (1, 3, 5, 7), −V (2, 6), +V (4, 8), Idown (9, 11), Iup (10, 12). Figure 2.(a) Movement of the Langmuir probe arrays, (b) floating potentials, ion saturated currents at (c) up and (d) down sides. Figure 3.(a)The auto-power spectra of the potential fluctuations.(b)Phase shifts between potentials at two tips with poloidal spans of 6 mm(blue solid line)and with radial spans of 3 mm(red dashed line). The auto-power spectrum of the potential fluctuations is described in figure 3(a).The resolution of the frequency is 0.5 kHz for this analysis.A low-frequency fluctuation is located in the frequency band of 0–4 kHz and the GAM is at the frequency off∼15 kHz.The half width of the spectra is∼5–8 kHz and thus the calculated lifetime is∼120–200 μs for the GAMs.The phase shifts between potentials at two positions with spans ofθd=6 mm in the poloidal direction and ofdr=3 mm in the radial direction are given in figure 3(b).At the GAM frequency band,the phase shift is near zero,while at the turbulence frequency band, the linear dispersion relation is clearly demonstrated.The poloidal and radial wave vectors for the GAM are estimated askθ= Δφ1,3/dθ∼0.3±0.1 cm−1andkr= Δφ3,5/dr∼1.4±0.1 cm−1,respectively,where the phase shiftφΔ1,3is estimated fromδVf1andδVf3whileφΔ3,5fromδVf3andδVf5.TheδVfi(i=1, 2, …) refers to the folating potential fluctuations at thei-tip.In this paper,the error-bars are given by evaluating standard deviation.Considering the interference of turbulence,the poloidal wave vector is expected to be small.Although a poloidal component is involved in the measuredkrdue to the probe geometry, the estimatedkris still reliable for the GAMs due to its poloidal symmetry.For the turbulence, an accuratekrvalue can also be obtained with the formula k=kr+kθ, where k is the wave vector measured by the probe.This observation is in agreement with the theory prediction of GAMs,i.e,thekθis∼0 and thekris finite for the GAMs.The peak in the frequency band of∼30–100 kHz is ambient turbulence. The finite frequency is one of the particular features of GAMs.Figure 4 shows the relationship between the GAM frequency and the square root of the electron temperature measured by Langmuir probe array shot by shot.The measured GAM frequencyfGAMis proportional to the square root of the electron temperature.The electron temperature is detected by standard four tips.The GAM frequency is also calculated with the formulaassuming that the electron and ion temperature are identical in the edge plasmas.The scalingfGAM∼1.3fthholds for the results, indicating that the measured frequencies are in good agreement with the prediction of the GAM theory. Figure 4.The measured GAM frequency (red square) and the calculated GAM frequency (green cycle). Figure 5.(a) The auto-power spectra of the density fluctuations,(b) the coherency spectra between the density and floating potential fluctuations, and (c) their phase shifts. The auto-power spectra of the density fluctuations are given in figure 5(a).The small peak is clearly shown at the frequency of ∼15 kHz.The amplitudes of the density fluctuations at the GAM frequency and the average density are δn=5×10¹⁵m−3andn0=1×10¹⁸m−3, respectively.Theδn n0/is∼0.5%.For the GAMs, the formula[24] should be satisfied.Here,qrandρsare the radial wave vector and the ion Larmor radius,respectively.In the top plasmas,θ=sin1,the value of the right-hand side is estimated as 0.7% and close toδn n0/ ∼0.5%. The phase relationship between density fluctuations and potentials is also evaluated.Figures 5(b) and (c) present the coherency spectra and the phase differences between density fluctuations and potentials, respectively.The coherencies are significant above the noise level at the GAM frequency,indicating that the density fluctuations are well correlated with the potential fluctuations for the GAMs.The phase shifts at the GAM frequency are about 0.6π. Figure 6.(a)The auto-power spectra of(a)Er,(b)Mach number and(c) Eθ fluctuations, (d) the coherency spectra between Eθ and Mach number fluctuations (blue solid line), and between Er and Mach number fluctuations (red dashed line) (qa=4.1). The toroidal component of the velocity for the GAMs deserves to be measured due to its relevance to the return flows owning to the plasma incompressibility.The Mach probe is parallel to the magnetic field line for the Mach number measurement.Due to the small angle between the parallel and toroidal directions,which is less than 5°, the toroidal component of the parallel velocity is approximately equivalent to the parallel velocity.Therefore,it is reasonable to estimate the toroidal velocity via the parallel Mach number.Figures 6(a)–(c) provide the auto-power spectra of the radial electric field fluctuations, Mach numbers,and poloidal electric field fluctuations atqa=4.1, respectively.The Mach numbers can be estimated as=Mmach0.4 ln (Iup/Idown)[25].From the measured Mach number and electron temperature, the toroidal velocity is evaluated asVφ≈MmachCs.The ion sound speed is written aswhereTe(mi) is the electron temperature (ion mass).A sharp peak at the GAM frequency occurs in the spectra of the radial electric feild fulctuationsδEr=(δVf5−δVf3)/dr.Small peaks at the GAM frequency are also observed in the Mach numberδM//and poloidal electric field fluctuationsδEθ=(δVf1−δVf3)/dθas shown in fgiures 6(b) and (c).The peak inδ θEis smaller than that inδErfor about an order of magnitude and may come from the fact that the two tips to measure the poloidal electric field are not placed on the same magnetic surface.Removing the turbulence interference, the poloidal velocity at the GAM frequency is calculated asVθGAM= −ErGAM/Bt∼60 m s−1.The folw velocity at the GAM frequency from the Mach number spectra is evaluated as Figure 7.The auto-power spectra of(a)Er,(b)Mach number and(c)Eθ fluctuations, (d) the coherency spectra between Eθ and Mach number fluctuations (blue solid line), and between Er and Mach number fluctuations (red dashed line) (qa=3.4). φVGAM∼35 m s−1.The ratio of the toroidal component of velocities to poloidal one is∼0.6.Note that for the GAMs,δEθ=0,thereby theδErdoes not contain a poloidal component of electric feild caused by the probe geometry.However, for turbulence,theδErcould be overestimated because theδEθis not equal to zero. The correlation between turbulence components in different directions is a mystery.Figure 6(d) shows the coherency spectra between the poloidal electric field fluctuations and Mach numbers.The high coherencies betweenδ θEandδM//in the turbulence frequency region of∼30–100 kHz indicate thatδ θEandδM//have strong correlation for turbulence.In contrast, the coherencies between the radial electric field fluctuationsδErand Mach numberδM//in the turbulence frequency band are much lower than those ofδEθandδM//.This indicates that the correlation betweenδErandδM//is weak for turbulence.The strong correlation betweenδEθandδM//in the turbulence frequency band is required for the generation of the parallel stresses〈δV rδM//〉 .However, the coherence betweenδErandδM//is higher than that betweenδEθandδM//in the GAM frequency band.The possible reason is that the poloidal component of the velocity is dominant for the GAMs. The toroidal component of the velocity for the GAMs has also been detected atqa=3.4.Figures 7(a)–(c) show the auto-power spectra and the coherency spectra between fluctuations, respectively.Similarly, the sharp peak at the GAM frequency is observed in the spectra of theδErwhile small peaks appear in the spectra of theδE θandδM//.TheVθGAMis evaluated as∼100 m s−1, respectively.The estimated toroidal velocityVφGAMat the GAM frequency is∼80 m s−1from the Mach number spectra.The ratios of these velocities are calculated asVφGAM/VθGAM∼0.8.The coherencies betweenδErandδM//are also lower (higher) than those ofδ θEandδM//in the turbulence (GAM) frequency band atqa=3.4. Figure 8.(a)The toroidal component of velocity as a function of poloidal velocity,and(b)the ratio of the toroidal velocity to the poloidal one for the GAMs at various edge safety factors; the dashed line denotes the theoretical prediction. Figure 9.Phase shifts between poloidal electric field and Mach number fluctuations at qa=3.4 (solid line) and 4.1 (dashed line). Note that the electron temperature fluctuations are generally considered to be small and can be neglected in the lowtemperature edge plasmas.In addition, for the measurement of the electron temperature fluctuations,the standard four tips are often used, while for the floating potential fluctuations,just one tip is needed.This indicates that the measurements for the electron temperature and floating potential fluctuations are not at the same position.Therefore, commonly, only floating potentials are utilized for the estimation of smallerscale electric fluctuations. The poloidal and toroidal velocities for the GAMs are analyzed statistically near 20 shots.The toroidal component of the velocity as a function of the poloidal velocity for the GAMs is shown in figure 8(a).One can see that the toroidal velocity is less than the poloidal velocity in most cases and it tends to increase with the poloidal velocity.Here, except for the edge safety factors, other parameters are kept constant.The ratio of the toroidal component to the poloidal one of velocities for the GAMs as a function of the edge safety factor is given in figure 8(b).The ratio is mainly localized in the interval between 0.3 and 0.8.With a lower edge safety factor,the ratio tends to increase.The observed ratio ofVφGAM/VθGAM=0.3–1.0 is larger than the theoretical expectation ofθ qcos / =0.02–0.03.The possible reason is that the nonlinear effect is not taken into account for the equationVφGAM/VθGAM~q−1cosθ.The nonlinear coupling between the toroidal flow and turbulence will be discussed further.Note that the ratio rises rapidly when theqais reduced to 3.2, while in the interval betweenq=3.5 and 4.5, theVφGAM/VθGAMchanges slightly.The larger ratio at lowqmight be explained by the appearance of magnetic islands in the edge or the higher Ohmic heating power.Both islands and heating power could enhance turbulence and consequently drive flows. The observation is not consistent with the theoretical expectation [24], i.e.,VφGAM/VθGAM~qa−1cosθ.The approximate evaluation ofθwill be given later in the discussion section.The toroidal flows come from the return flow because of plasma incompressibility.In toroidal plasma, the GAMs directed mainly in the poloidal direction can induce the compression of plasma.However, to maintain incompressibility,a return flow along the magnetic field line will be generated to compensate for this compression. The toroidal flow can be driven by turbulent nonlinear interaction via parallel Reynolds stress.The value of Reynolds stress〈δVrδM//〉 is influenced by the amplitudes and the cross correlation (or cross phase) of theδVrandδM//.The radial velocity fluctuation is written asδVr=δE θ/Bt.The stronger correlation between theδ θEandδM//is observed as above.Here,the cross phase of theδ θEandδM//is examined.Figure 9 gives the phase shifts betweenδ θEand Mach number atqa=3.4 and 4.1.One can expect that the cross phase is almost constant and about 0.6π in the turbulence frequency bands for two cases.The invariant phase between theδ θEandδM//is beneficial to the generation of the〈δVrδM//〉 .In the calculation for the cross phase,δ θEandδM//are selected at the same frequency.Therefore, the discussion corresponds to the toroidal flow, which has a zero frequency, but not for GAM because of its finite frequency.Generally, the momentum and energy conservations should be satisfied for the nonlinear coupling, i.e.,k=k1±k2andf=f1±f2,whereki(i=1, 2) refers to the wave vector.Assumingf1=f2,thenf=0.However, the mechanism is similar to that of the GAM generation.The nonlinear coupling between GAMs and turbulence will be given in next section. Figure 10.The auto-bicoherence spectrum of Mach numbers. Nonlinear coupling is considered to be an important mechanism for the GAM generation and needs to be exploited further.Figure 10 gives the auto-bicoherence spectra of the Mach numbersδM//.The auto-bicoherences are calculated aswhere=B f3( )The values ofaboutf3=f1±|f2|∼15 kHz,f2∼±15 kHz andf1∼15 kHz are higher.The cross-bicoherence spectra of the Mach numbersδM//and the turbulent velocityδVrare shown in figure 11(a),here,andTwolines aboutf3=f1±|f2|∼0–10 kHz and ∼15 kHz are apparently demonstrated.The linef3<10 kHz may come from the LFZFs.The summed bicoherence is given in figure 11(b)and calculated aswhereNis the total number ofThe noise level is expressed as 1/N0; hereN0is the realization number.This coupling analysis suggests that it is possible that the components at the GAMs frequency may come from the nonlinear interaction between turbulence and GAMs via three-wave coupling.It also has the implication of those flows being driven by parallel stresses. Figure 11.(a) The cross-bicoherence spectrum ofδVr andδM/ / ,and (b) summed bicoherence (the red dashed line is the noise level). Figure 12.(a)The auto-power spectrum of the turbulence envelopes in the frequency bands of ∼50–200 kHz, (b) the coherency spectra between potential fluctuations and turbulence envelopes,and (c)the corresponding phase shifts. Figures 12(a)–(c) present the auto-power spectra of the turbulence envelope from the floating potential fluctuations, the coherency spectra between turbulence envelope and floating potentials, and their phase shifts, respectively.The envelope can be calculated with Hilbert transform from the higher frequency turbulence.The turbulence in the frequency band of∼50–300 kHz is selected for this evaluation.A peak is clearly shown at the GAM frequency of∼18 kHz in the power spectra.The high coherency at the GAM frequency band indicates that the GAM is well correlated with turbulence.This observation apparently shows that the turbulence is modulated by GAMs.The phase shifts between envelopes and potentials are∼π at the GAM frequency.In addition,the coherencies in the frequency band of 0–4 kHz are also high and the phase shifts are∼π.This may come from the fact that the LFZF modulates turbulence.The observation is consistent with the previous measurements in the middle plane of the HL-2A tokamak, where the turbulence envelope is well correlated with GAMs and the corresponding phase shifts are near π [14].The invariance of the phase shifts between turbulence envelope and GAMs indicates that the GAM effects on turbulence are the same in the middle plane and near the top magnetic surface of tokamaks. The toroidal component of velocity for the GAMs is estimated asVφGAM=10 −100m s−1in the top of the J-TEXT tokamaks.This is not consistent with the theoretical expectation, where theVφGAM=0in the top plasmas of tokamaks [3]. The most possible error resource is the movement of the magnetic axis for the present measurement.This can mean that the Mach probes and two tips to measure the poloidal electric field are not placed on the same magnetic surface[24,26].The error introduced by the misalignment is described by the ratiosinδsinθ,whereMint(MGAM)denotes the misalignment interference to Mach number (the Mach number for the GAM), and thelandδare the distance between two Mach probes and the mismatch angle, respectively [24].Considering Shafranov displacement, the plasma movement is ∼2 cm and the poloidal angleθis estimated as∼85°.This indicates that the probe is localized near the top of the magnetic surface.In this case, theφVGAMis expected asThe mismatch angle between the Mach probe array and magnetic surface due to the installment is less than 5°.Here, the observed toroidal velocity increases with the poloidal velocity.Meanwhile,the ratio0.3−1.0 is dominant and larger than the theoretical expectationcosθ~0.02 −0.03.In the region of 3.5 Note that here theTe=Tiis assumed.In most cases,theTishould be smaller than theTe.Therefore, the assumption may lead to the overestimation of the toroidal velocity.In addition, the calculationVφGAM=M//Cscan also enlarge the error bar.However, these two error sources are difficult to remove. The toroidal component of the velocity for the GAMs is first demonstrated.Multiple Langmuir probe arrays set up near the top tokamak of the J-TEXT were used for this investigation.A significant peak at the GAM frequency is observed in Mach number fluctuations and well correlated with the GAMs.Similar to the previous measurements in a great number of devices,the GAM frequency is proportional to the square root of the electron temperature.The phase shift between densities and potentials at the GAM frequency is close to half π.Turbulence envelope analysis suggests that the GAM effects on turbulence are the same in the middle plane and near the top magnetic surface of tokamaks.The poloidal and toroidal velocities for the GAMs are estimated as∼20–130 m s−1and∼10–100 m s−1, respectively.The ratio of toroidal component to the poloidal one of the velocity is mainly 0.3–1.0.The toroidal velocity is also observed to increase with the poloidal velocity.The estimatedVφGAM/VθGAMalmost does not change in the interval between 3.5 and 4.5,while it rises rapidly at lowq.The coherencies between poloidal electric fields and Mach number fluctuations in turbulence frequency band are also evaluated and higher than those betweenδErandδM//.The high coherency betweenδE θandδM//is favorable for the generation of the turbulent Reynolds stress. Acknowledgments This work is supported by National Natural Science Foundation of China (Nos.12075057, 11775069, 11320101005,51821005 and 11875020);Jiangxi Provincial Natural Science Foundation (No.20202ACBL201002) and Doctoral Foundation (Nos.DHBK2017134 and DHBK 2018059); and Grant-in-Aid for Scientific Research of JSPS (Nos.15H02155, 15H02335, 16H02442). ORCID iDs2.Experimental setup


3.Experimental results
3.1.Properties of GAMs
3.2.Toroidal component of the velocity for the GAMs
3.3.Statistic analysis of the velocities for GAMs
3.4.Cross phase between poloidal electric field and Mach number fluctuations

3.5.Nonlinear coupling
3.6.Turbulence modulation
4.Discussion
5.Conclusion
猜你喜欢
Plasma Science and Technology(2022年3期)2022-04-15格言·校园版(2021年13期)2021-09-10初中生学习指导·中考版(2021年4期)2021-09-10Plasma Science and Technology(2021年3期)2021-03-22考试与评价·七年级版(2020年6期)2020-11-02考试与评价·七年级版(2020年5期)2020-10-29考试与评价·七年级版(2020年1期)2020-10-23做人与处世(2015年18期)2015-09-10对联(2011年24期)2011-09-19
 Plasma Science and Technology2021年10期