
Microanalysis of a ductile iron by microchip laser-induced breakdown spectroscopy
2021-10-31 08:15WeiWANG汪为LanxiangSUN孙兰香PengZHANG张鹏LimingZHENG郑黎明LifengQI齐立峰andJinchiWANG王金池
Plasma Science and Technology 2021年10期
Wei WANG(汪为),Lanxiang SUN(孙兰香),Peng ZHANG(张鹏),Liming ZHENG(郑黎明),Lifeng QI(齐立峰) and Jinchi WANG(王金池)
1 State Key Laboratory of Robotics, Shenyang Institute of Automation, Chinese Academy of Sciences,Shenyang 110016, People’s Republic of China
2 Key Laboratory of Networked Control System, Shenyang Institute of Automation, Chinese Academy of Sciences, Shenyang 110016, People’s Republic of China
3 Institutes for Robotics and Intelligent Manufacturing, Chinese Academy of Sciences, Shenyang 110169,People’s Republic of China
4 University of Chinese Academy of Sciences, Beijing 100049, People’s Republic of China
Abstract Laser beams with ns pulse width are generally employed as an excitation source in the process of detecting inclusions and elemental segregation on a workpiece surface by microanalysis of the laser-induced breakdown spectroscopy.In addition,the ablation crater interval of laser sampling on the sample surface is generally 20 μm or more.It is difficult to detect the morphology of inclusions smaller than 50 μm in diameter and the micro-segregation of elements.However, in this work,when the laser ablation crater is 10 μm and the sampling resolution of the laser on the sample surface is 5 μm, the morphology and distribution of spherical inclusions (20–60 μm) in ductile iron can be detected according to the difference of the Fe spectrum on the Fe matrix and the spheroidal inclusions.Moreover,the distribution of micro-segregation of Mg and Ti elements in ductile iron was also studied.
Keywords: micro-laser-induced breakdown spectroscopy, micro-LIBS, mapping, inclusion,segregation, ductile iron
1.Introduction
Inclusions and elemental segregation in metals can reduce their plasticity,toughness and fatigue life,which have a direct impact on the metal’s workability, surface finish and welding performance.With the concept of pure steel being put forward, more stringent requirements are put forward for the control of inclusions and element segregation in the steel production process[1].To research the influence of the distribution of inclusions on metal properties,a metallographic microscope is usually applied to observe the area to be measured, and the composition of the inclusions in the sample is determined according to the shape of the mineral observed.However, this method often relies on the testers’ experience, and the examination accuracy is hard to guarantee.In addition, adopting the spark optical emission(OES)method termed pulse distribution analysis(PDA)[2]can provide rapid,quantitative analysis for non-metallic inclusions in steels, but it cannot provide spatially resolved analysis.Although, Energy-dispersive x-ray spectroscopy [3] (EDS or EDX) and electron probe microanalyzer [4] can accurately analyze the composition of inclusions in metals, both methods are time consuming and environment strict (require a high vacuum environment), complicated in sample processing, and restricted on sample size.In the study of metal element segregation, the spark OES method termed PDA method is often used.However,this method can only give the macro-segregation degree of the element, and cannot detect the micro-segregation in the sample.On the contrary, micro-laser-induced breakdown spectroscopy (μLIBS or micro-LIBS) could compensate these problems [5–8].

Figure 1.Experimental setup.The left and right plots are the LIBS component and the mechanical structure diagram, respectively.
The micro-LIBS technology cannot only detect the inclusion existing in the material, but also qualitatively analyze the elemental composition of the material surface.Besides, it has strong adaptability to environment, fast analysis speed and high degree of automation [9].Syoko Nakahataet al[10] studied Al element inclusions in ferritic stainless steel with a sampling interval between ablation craters of 40 μm.The emission signal from the plasma was transferred to a spectrometer system, comprising a Czerny–Turner-mounting spectrograph and an ICCD detector.With the similar spectrometer described above, Cabalínet al[11]utilized a cylindrical lens to focus the laser beam, and presented the distribution of MnS and TiN inclusions in stainless steel in the range of 6 mm2scanning area with spatial resolution of 50 μm between adjacent craters and 4.8 μm along the microline.Moreover, this team [1, 6] also characterized the silicate inclusions in steel by mapping the spectral distribution of Mg, Ca, Si, Al and Ti.However, due to the relatively slow response rate of ICCD device, which restricts the improvement of system sampling efficiency, researchers tend to apply Paschen–Runge structure spectrometers to collect plasma emission spectra.Yong Zhanget al[12]adopted a spectrometer of Paschen–Runge structure to detect acid-infused aluminum inclusions in steel in an argon environment.The obtained diameter of the ablation crater is approximately 150 μm and the sampling resolution of the laser on the sample surface is 300 μm.Also, using the same equipment,this team[13–15]analyzed spherical oxides,MnS inclusions, and Si–Al–Ca–Mg composite inclusions in the steel, with a laser sampling interval of 100 μm.To further improve the sampling efficiency of the laser,a high-frequency laser source is also adopted.Reinhard Nollet al[5, 16, 17]performed a scanning analysis of steel samples in the range of 1 cm2under argon atmosphere, and inclusions of MnS, AlN and Al2O3, as well as inclusions composed of elements such as C, N, O, P and S were observed.The ablated crater in the experiment was approximately 15 μm in diameter and the distance between adjacent laser ablation craters is 20 μm.Under the same sampling interval of ablation crater, Heinz-Martin Kusset al[7, 18] performed a scanning imaging analysis on a synthetic steel sample containing AlN inclusions in the range of 1 cm2in an argon atmosphere.Furthermore,Fabienne Boué-Bigne[19]discussed the distribution of SiO2,MgO,Al2O3,MnO,CaO and TiO2inclusions in the rail with a laser ablation crater of approximately 13 μm in an argon atmosphere.

Figure 2.The ablative craters on the surface of a sample when the stage is running at 12.5 μm ms−1.
The above analysis system employs a lamp pump or a semiconductor pumped laser as the excitation source.Because the laser pulse width is ns level, the interaction time between laser and material is long and is difficult to obtain smaller ablative craters.Therefore, it is not conducive to improving the spatial resolution of laser sampling on the target.Moreover, in the above methods, the sampling intervals of the ablation craters are 20 μm or more.For small-scale inclusions, the existence of inclusions can only be roughly estimated, and it is difficult to effectively detect the shape of inclusions in materials.

Figure 3.Experimental sample (a) and metallographic diagram of sample surface (b).
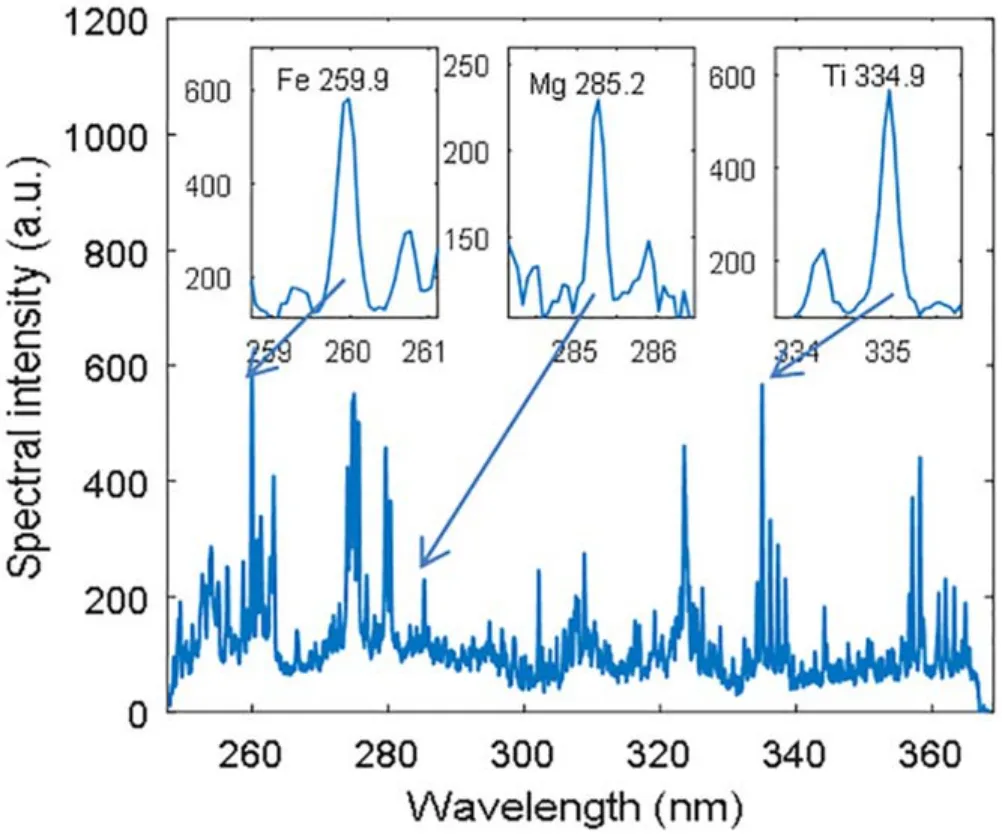
Figure 4.Spectra collected on the surface of ductile iron.
The microchip laser has been favored by many researchers for its characteristics of small size,good beam quality,compact structure,pulse width of the laser beam in the order of ps,and small damage to the sample [20–27].John J Zayhowski [20]proposed that the microchip laser has good prospects in the application of LIBS.I B Gornushkinet al[21] studied the possibility of using microchip lasers for LIBS analysis.Andrew Freedmanet al[23] and C Lopez-Morenoet al[25]analyzed aluminum alloy and low alloy steel samples respectively using microchip laser.For its excellent performance, in this study,a microchip laser is employed as the excitation light source.After the light beam is tightly focused through the objective lens, the obtained diameter of the ablation crater is approximately 10 μm.To further improve the sampling resolution on the target surface,the ablation crater overlap method is adopted to collect spectrum, and each time a spectrum is gathered, the length of the laser scan is 5 μm.Moreover, the shape and distribution of the spheroidal inclusions on the ductile iron surface and the distribution of micro-segregation of Mg and Ti elements in ductile iron are studied in a 1 mm2area.Furthermore,the grade of the ductile iron is determined and the result is consistent with the area where the ductile iron is observed by an optical microscope.
2.Experiment
The experimental setup is shown in figure 1.The equipment mainly consisted of a microchip laser, a trigger, a spectrometer and a three-dimensional stage.The output frequency of microchip laser (Beijing RealLight Technology, MCO-1064-120) is 1 kHz.The pulse width of this laser is 550 ps and operating wavelength is 1064 nm.Moreover, the adopted laser energy is 80 μJ and the laser beam diameter is 1 mm.A laser beam expander with a beam expansion ratio of 1:5 was employed to minimize the divergence angle of the beam and enhance the effect when the beam was focused.After the beam passes through the expander, a 1064 nm reflector reflects the beam to a 20X microscope objective (f=30 mm).The obtained ablation crater diameter is approximately 10 μm, as shown in figure 2.Moreover, a microscopic imaging optical system was constituted by a charge coupled device (CCD) camera and the objective.The CCD camera maintained a constant height from a target surface to the objective by identifying a focused laser pointer beam spot size [28].Besides, the plasma spectrum was collected using a quartz lens with a focal length of 12 mm.Spectral acquisition employed a compact spectrometer (AvaSpec-ULS2048, resolution:0.15 nm, slit width is 25 μm) with a wavelength range of 240–360 nm.The integration time of the spectrometer and the trigger frequency was set to 50 ms and 10 Hz respectively, considering the weak laser emission spectrum and spectral storage rate.In addition, a trigger board was used to achieve a pulse output with a fundamental frequency of 1 kHz and 10 Hz after frequency division to control the laser and spectrometer to work together.Besides, the three-dimensional stage applied has an operational accuracy of 1 μm.
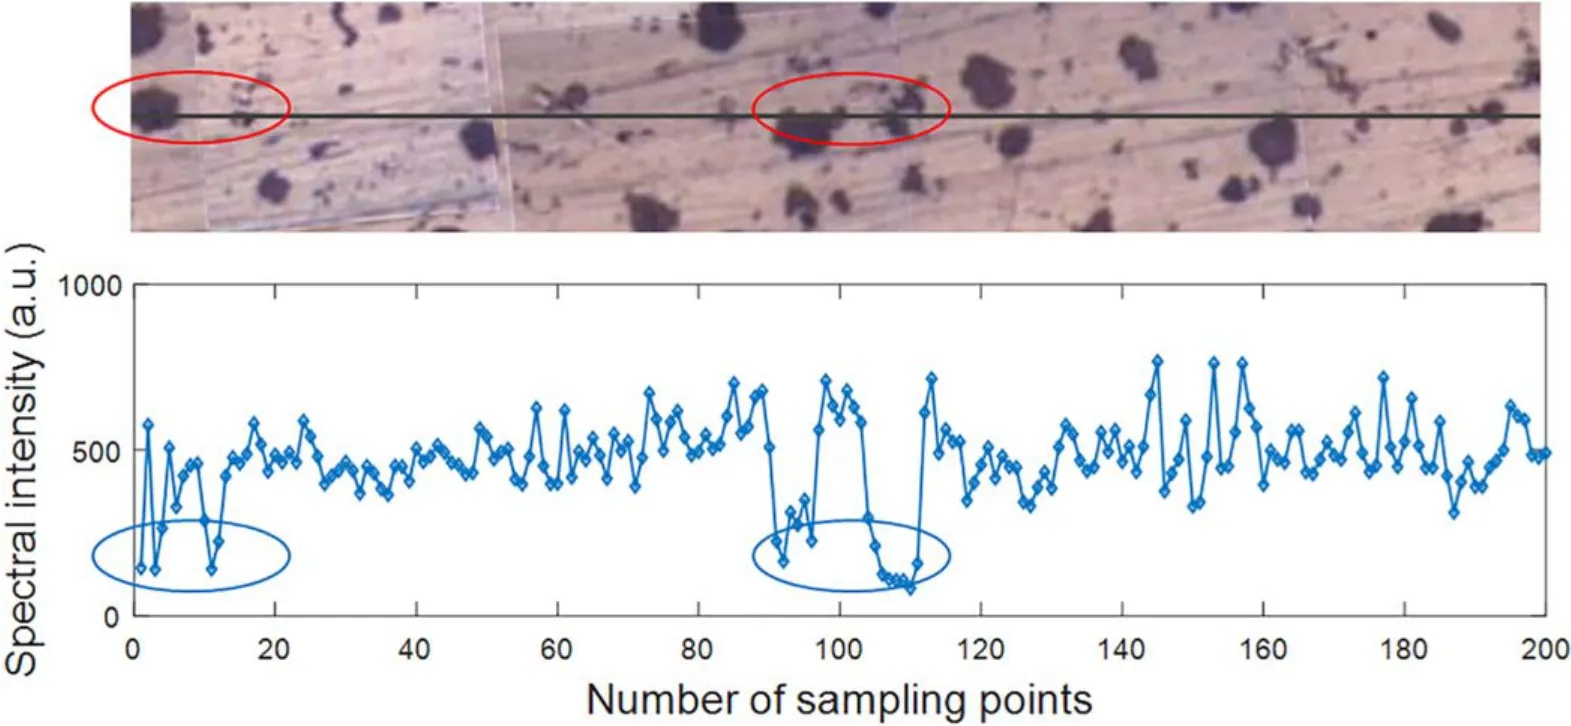
Figure 5.Spectral fluctuation graph obtained when the laser scans the sample by the black line.

Figure 6.Distribution diagram of spherical inclusions in ductile iron.(a)The distribution of spherical inclusions obtained by scanning the surface of the sample with a metallurgical microscope.(b) A graph obtained by performing the μLIBS device to scan on the area shown in(a)and plotting the intensity distribution of the Fe spectral line.The red area in the figure corresponds to the area shown in figure 3(b).The blue area indicates the area where the spherical inclusions topography was not detected by the μLIBS device.
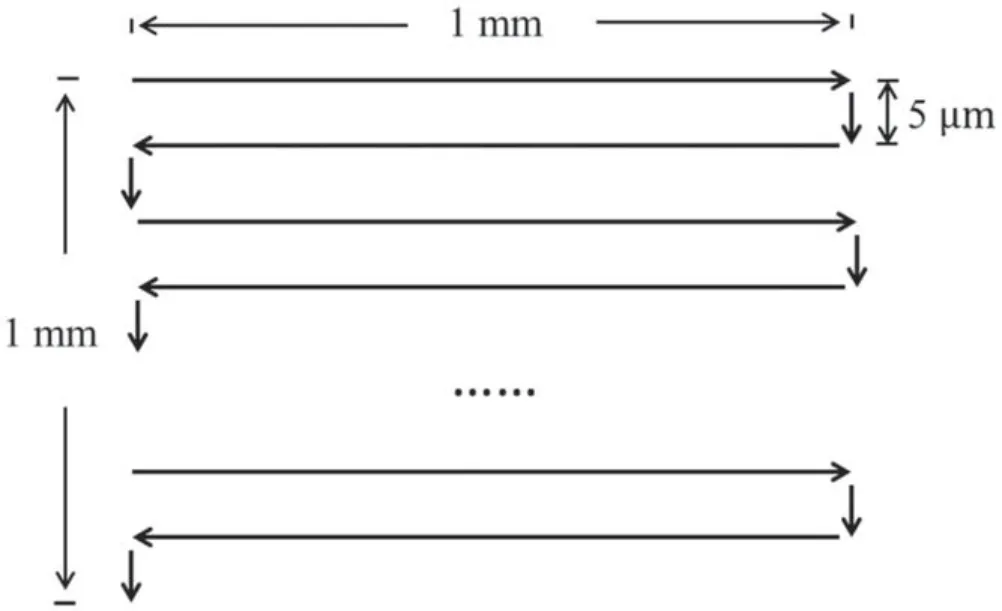
Figure 7.Laser scanning method.

Figure 8.Spectrum intensity distribution of Fe 259.9 nm.

Figure 9.The left picture shows the 3×3 smoothing filter mask,and the right picture shows the coordinate values corresponding to the mask.
The test sample is a piece of ductile iron, as shown in figure 3(a).In order to observe the sample surface clearly under the optical microscope, sandpapers of 500#, 800#,1000# and 1500# were used to polish the sample surface.The polished sample surface observed by a microscope(Chongqing UOP Optoelectronic Technology, UM203i) is shown in figure 3(b).Besides, the obtained sample surface roughness is approximately 0.07 μm.

Figure 10.Elemental micro-segregation maps.The bright spot areas in(a)and(b)represent the segregation maps of Mg and Ti on the surface of a 1 mm2 ductile iron sample.
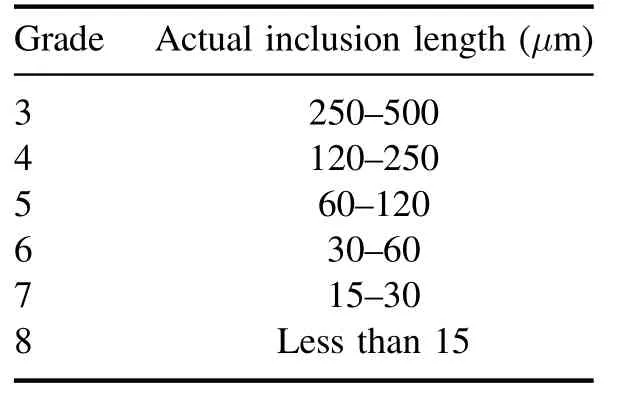
Table 1.Spherical inclusion grade.
3.Results and discussion
3.1.Compositional mapping of ductile iron
The integrated spectrometer was used to collect spectra with overlapping ablation craters to improve the sampling spatial resolution of the laser.The stability and intensity of the spectral signal in the case of different overlapping laser ablation craters have been explored in previously published articles [27].In this paper, we set the operating speed of the stage to 50 μm s−1to obtain the distribution information of the spheroidal inclusions on the surface of the sample with high precision.Because the period of the spectrometer is 10 Hz, each time the spectrometer acquires a spectrum, the running distance of the stage is 5 μm.Eventually, the sampling interval of 5 μm is achieved on the sample.The spectrum collected on the ductile iron is shown in figure 4.
In the analysis of the ductile iron spectra, it was found that when the laser is focused on the spherical inclusions of the ductile iron,the intensity of the collected plasma spectrum is significant different from the iron matrix.As shown by the black line on the ductile iron in figure 5, when the laser is scanned, the spherical inclusions distribution corresponding to the red region is consistent with the intensity fluctuation of Fe 259.9 nm as illustrated in the blue region.This phenomenon indicates the possibility to analyze the distribution of spherical inclusions in ductile iron through the intensity distribution of iron spectrum.
To verify the accuracy of the above experimental analysis,an area of 1 mm×1 mm is first marked on the surface of the sample, and then scanned with an optical microscope.Each picture taken by the microscope is bright in the middle area and is relatively dark in the edge, which causes uneven brightness in the composed image, as shown in figure 6(a).Besides, The LIBS mapping is performed in the cyclic scanning manner in figure 7.
The intensity of the line of Fe 259.9 nm in the spectra is sequentially arranged according to the position information of the sampling points, and the intensity distribution of the spectrum is shown in figure 8.Due to the uneven content of each element in the ductile iron, stronger or weaker spectral intensities are inevitable in the scanned spectral distribution.To reduce the impact of these ‘salt and pepper’noises on the spectral profile, figure 8 was processed with a smoothing filter.The specific filtering process is as follows.
Assuming figure 8 is anM×Nmatrix,each pixel value isf(x,y),xandyrepresent the number of rows and columns of the matrix,respectively.A 3×3 smoothing filter ω is used for filtering, as shown in figure 9.The pixel value of the filtered point is supposed asg(x,y) which can be expressed by formula (1).Also, to cause the spherical inclusions obvious in the distribution map, the filtered image is normalized and the resulting spherical inclusions distribution is shown in figure 6(b).
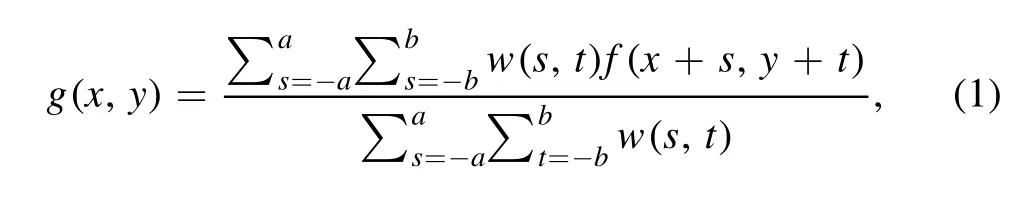
where,a=1 andb=1,x=0,1,2,3,...,M−1,y=0,1,2,3,...,N−1.

Table 2.The diameter of spherical inclusions corresponding to Nos.1–10 in figure 3(b).
Comparing figure 6(b)with figure 6(a),the results of the laser scanning analysis are consistent with those of the microscopic scanning analysis.Three reasons may explain the similarity in the results.First, the microchip laser applied has weak energy and a pulse width in the ps level, which tinily modifies the surface of the material.Second, it is obvious different between the plasma excited by the laser on the spherical inclusions and the plasma emitted by the iron matrix(shown in figure 5),which creates favorable conditions for the experimental results.Third, sampling at intervals of 5 μm on the sample surface provides a high spatial resolution for the laser scanning results.
Using the above method,the intensity distributions of the two spectral lines of Mg 285.2 nm and Ti 334.9 nm in the scanning area were used to explore the micro-segregation of these two elements.The obtained micro-segregation maps of Mg and Ti elements are shown in bright spot areas in figures 10(a) and (b), respectively.Comparing figures 10(a)and(b),it is found that the area of micro-segregation of Mg is basically the same as that of Ti.In addition, the distribution area of the dark black spots in figure 10 is basically the same as the morphology and distribution of the spherical inclusions observed by the metallurgical microscope in figure 6(a),which can explain the accuracy of the micro-segregation analysis of Mg and Ti elements to a certain extent.
3.2.Determination of spherical inclusions grade in ductile iron
Grade of the spherical inclusions is judged according to standards of the People’s Republic of China for ductile iron(GB/T 9441-2009).Steps are as follows: firstly, observing the entire surface of ductile iron with a microscope; second,selecting a representative area and calculating the average value of the diameter of the spherical inclusions whose diameter is larger than the radius of the largest spherical inclusion; finally, evaluating the spherical inclusions grade according to the corresponding rating chart.The rating chart is shown in table 1.
The red area shown in figure 6(a) was selected, and its enlarged plot is shown in figure 3(b).The diameter of spherical inclusions labelled 1–10 is measured with an optical microscope.The intensity distribution of the Fe spectrum corresponding to figure 6(a) is shown in figure 6(b).The diameter of the spherical inclusions labelled 1–10 in figure 6(b) is calculated by multiplying the pixel resolution(5 μm) by the number of pixels whose gray value is greater than the average gray value of the blue square region in figure 6(b).The calculation results are shown in table 2.
According to the national standards, the reference value of spherical inclusions grade calculated by metallographic chart and laser scanning mapping analysis are 35.55 μm and 41.25 μm, respectively.From table 2, the grade of the spherical inclusions obtained by the two methods is same,which is 6.The method of LIBS mapping gives larger diameters for spherical inclusions with a large diameter compared with the metallographic analysis method.However, for spherical inclusions with a small diameter, the obtained inclusions generally have a smaller diameter.On one hand,it may be because the laser scanning distribution analysis method has a lower spatial resolution than metallographic analysis.On the other hand, when using the smoothing filtering to filter the ‘salt and pepper’ noise of the generated picture,it is possible to enlarge the spherical inclusions with a larger diameter and reduce the spherical inclusions with a smaller diameter.In addition,by comparing the sizes of No.9 and No.10 spherical inclusions detected in table 2,the results also show that the laser scanning method can basically analyze the shape of spherical inclusions with a diameter greater than 20 μm.
4.Conclusion
A microchip laser is employed to scan and analyze a 1 mm2area of a ductile iron sample with the sampling resolution of 5 μm.The Fe 259.9 nm was selected as the observation line for the different spectral intensities of the Fe element acquired on the spherical inclusion and the iron matrix when the laser is scanning on the sample.The intensity distribution of the drawn spectral line is consistent with the result of scanning under a metallographic microscope.Moreover, the grade of spherical inclusions in ductile iron was evaluated based on the size of the spherical inclusion reflected in the intensity distribution chart, and the results are consistent with those of metallographic microscope.In addition, the intensity distributions of Mg 285.2 nm and Ti 334.9 nm were used to analyze the micro-segregation of these two elements, and it was found that the area of micro-segregation of Mg is basically the same as that of Ti.
This study validated the possibility of LIBS for highresolution mapping of sample surfaces using a low-frequency,small integrated spectrometer.However,due to the limitation of the current experimental hardware storage rate (the spectrometer and the computer communicate with USB2.0 and the data are stored directly on the disk in real time during the sampling process of the spectrometer) and the realization of spatial sampling resolution of 5 μm on the sample surface,the speed of scanning the sample surface is relatively slow.In this research, when the spectrometer’ sampling frequency is 10 Hz and the scan speed is 50 μm s−1(as shown in figure 7),it takes nearly 67 min for a sample area of 1×1 mm2.The next step is to increase the sampling resolution while increasing the sampling frequency of the spectrometer,and to research the segregation and inclusions of large-scale metal workpieces.
Acknowledgments
This work was supported by the National Key Research and Development Program of China(No.2017YFF0106202),the Key Research Program of Frontier Sciences, Chinese Academy of Sciences (No.QYZDJ-SSW-JSC037), the Liaoning Revitalization Talents Program(No.XLYC1807110),and the Youth Innovation Promotion Association, Chinese Academy of Sciences.
猜你喜欢
Plasma Science and Technology(2022年8期)2022-09-14
华声文萃(2022年6期)2022-07-05
文萃报·周二版(2022年16期)2022-04-23
Plasma Science and Technology(2022年3期)2022-04-15
卫星应用(2022年1期)2022-03-09
金桥(2022年1期)2022-02-12
小学生学习指导(低年级)(2021年10期)2021-11-01
科学与财富(2021年36期)2021-05-10
故事会(2018年13期)2018-07-03
读者(2017年8期)2017-03-29
 Plasma Science and Technology2021年10期
- Plasma Science and Technology的其它文章
- Numerical study of the grid erosion of field emission electric propulsion
- Investigation of variable aperture on the performance and lifetime of ion thruster
- Experimental study of a porous electrospray thruster with different number of emitterstrips
- Design and fabrication of a full elastic submicron-Newton scale thrust measurement system for plasma micro thrusters
- A plasma equilibrium model for rapid estimation of SF-MPDT performance
- Numerical simulation of the effects of protrusion on DC arc anode attachment