
Quantitative analysis of the main components in ceramic raw materials based on the desktop LIBS analyzer
2022-09-14 08:18PengZHANG张鹏LanxiangSUN孙兰香HaibinYU于海斌andPengZENG曾鹏
Plasma Science and Technology 2022年8期
关键词:张鹏
Peng ZHANG (张鹏),Lanxiang SUN (孙兰香),Haibin YU (于海斌) and Peng ZENG (曾鹏)
1 State Key Laboratory of Robotics,Shenyang Institute of Automation,Chinese Academy of Sciences,Shenyang 110016,People’s Republic of China
2 Key Laboratory of Networked Control Systems,Chinese Academy of Sciences,Shenyang 110016,People’s Republic of China
3 Institutes for Robotics and Intelligent Manufacturing,Chinese Academy of Sciences,Shenyang 110016,People’s Republic of China
Abstract The concentrations of SiO2,Al2O3,K2O,Na2O,CaO,MgO,Fe2O3 and TiO2,and loss on ignition(L.O.I.)are the main inorganic components of geological samples.Concentrations of the eight oxides and L.O.I.are also the main indicators of concern in the production of building ceramics.Quantitative analysis of the eight oxides and L.O.I.was performed using fiber-laserbased laser-induced breakdown spectroscopy(LIBS).A combination of continuous background deduction,full width at half maximum (FWHM) intensity integral and spectral sum normalization was proposed for data processing.After the data processing combined the continuous background deduction,FWHM intensity integral and spectral sum normalization,the mean absolute errors(MAEs)of the calibration of L.O.I.,SiO2,Al2O3,K2O,Na2O,CaO,MgO,Fe2O3 and TiO2 was reduced from 2.03%,12.06%,4.84%,1.10%,0.69%,0.31%,0.11%,0.20%and 0.10% to 1.80%,9.48%,2.12%,0.36%,0.58%,0.11%,0.08%,0.19% and 0.05%,respectively.This multivariate method was further introduced and discussed to improve the analysis performance.The MAEs of L.O.I.,SiO2,Al2O3,K2O and Na2O were further reduced to 1.12%,2.07%,1.38%,0.35% and 0.43%,respectively.The results show that the overall prediction error can meet the requirements for the production of building ceramics.The LIBS desktop analyzer has great potential in detection applications on geological samples.
Keywords: laser-induced breakdown spectroscopy,fiber laser,quantitative analysis,matrix effects,geological samples
1.Introduction
As a consequence of the continuous large-scale investment in the field of infrastructure construction and improvement in living standards,there is a huge demand for building ceramics in the construction industry in China.Building ceramics production is a process industry with high-energy consumption.The content of key components in ceramic formulas determines both cost factors (e.g.the energy consumption in the firing process) and quality factors(such as the whiteness,transparency and flatness of products).Therefore,the detection and analysis of the concentrations of key elements in the green body before firing will not only realize better quality control,but the reduction of energy consumption and pollution.At present,the daily production of the building ceramics industry lacks rapid detection methods,and usually depends on the experience and judgment of technicians,resulting in high production risk.Traditional chemical analysis by professional institutions is only performed in the case of problems because of the high cost.This lack of analysis prevents the timeous adjustment of the formula and seriously affects production efficiency.Therefore,a fast and simple detection method is needed to provide a basis for the control and adjustment of daily production.
X-ray fluorescence (XRF) and laser-induced breakdown spectroscopy (LIBS) are recognized as spectral analysis technologies suitable for rapid detection[1–3].The advantage of XRF is nondestructive determination,but the detection ability of light elements is weak;the advantage of LIBS is the quick detection of almost all elements in the periodic table,but part of the sample surface will be ablated by the laser to create plasma during the detection.The building ceramics industry is mainly concerned with the chemical components,being concentrations of the eight oxides(SiO2,Al2O3,K2O,Na2O,CaO,MgO,Fe2O3and TiO2),together with L.O.I.There are light elements such as Na,Mg and Al,and L.O.I.is also largely determined by light elements such as C,H and O.On the other hand,the unit-price of ceramic raw material is low,and the destruction of samples during detection is not a concern.Therefore,LIBS is more suitable for the analysis of the main components of ceramic raw materials.
There is an abundance of research on the applications of LIBS in energy[4],metallurgy[5,6],geographical survey[7]and extraterrestrial space exploration [8,9].Research on the element content and mineral composition of soil and rock using LIBS is also a hot field [10–14].LIBS-based analysis of ceramic raw materials(such as clay,feldspar and quartz)is usually qualitative analysis or quantitative analysis of one or several elements in samples from a specific origin or specific raw material types[15–20].Tang et al analyzed the content of K element in feldspar raw materials and improved the analysis accuracy by Lorentz fitting[18].Chen et al measured the content of Si,Al,Ca,K,Mg,Mn,Ti and Fe in drilling cutting samples by logging a special laser-induced breakdown spectrometer [20].Unified modeling and simultaneous quantitative analysis of the eight main oxides and L.O.I.in clay,feldspar,quartz and other types of minerals have rarely been reported in the literature.
In this work,geological samples with wide variations in mineral composition were detected by the fiber-laser-based LIBS analyzer under the same experimental conditions,and the L.O.I.and concentrations of SiO2,Al2O3,K2O,Na2O,CaO,MgO,Fe2O3and TiO2in different kind of minerals were analyzed synchronously.The concentrations of these main elements in geological samples for building ceramics were simultaneously detected from the plasma emission induced by the long-pulsewidth and low-power fiber laser.The combination of continuous background deduction,FWHM intensity integral and spectral sum normalization was proposed to reduce the differences between sample matrices.Different calibration models were further proposed to improve the analysis performance of different compositions.The desktop LIBS analyzer integrated with the proposed methods provided a solution for daily rapid detection in the ceramics industry.
2.Experiment
2.1.Experimental instrument
An experiment was performed on the self-developed desktop LIBS analyzer named LIBSeer.The design rendering,front view and system diagram of the instrument are shown in figures 1(a)–(c),respectively.The laser adopts the YDFLP-60-LM1+-L1-R(JPT Opto-electronics Co.,Ltd)pulse fiber laser,with maximum power of 60 W and single-pulse energy of about 1.5 mJ;the laser focusing lens is a flat convex lens with a focal length of 75 mm;the plasma emission collection lens is a flat convex lens with a focal length of 20 mm,and the collection angle is 30°lateral to the laser incident direction.Two spectrometers(AvaSpec-Mini4096CL,Avantes) are selected to cover the detection spectral wavelength ranges from 240–400 nm and 610–830 nm,respectively.
2.2.Samples and data
There were 16 national reference materials and 14 common ceramic raw materials used in the experiment.The pretreatment procedure of raw materials is:(1)taking a 500 g sample,wet ball milling it for half an hour;(2) drying it and sieving with a 60 mesh sieve;(3) taking about 20 g for chemical analysis,taking the rest of the powder for a LIBS experiment.The content of the oxides of the eight elements and the L.O.I.of each sample are shown in table 1 below.
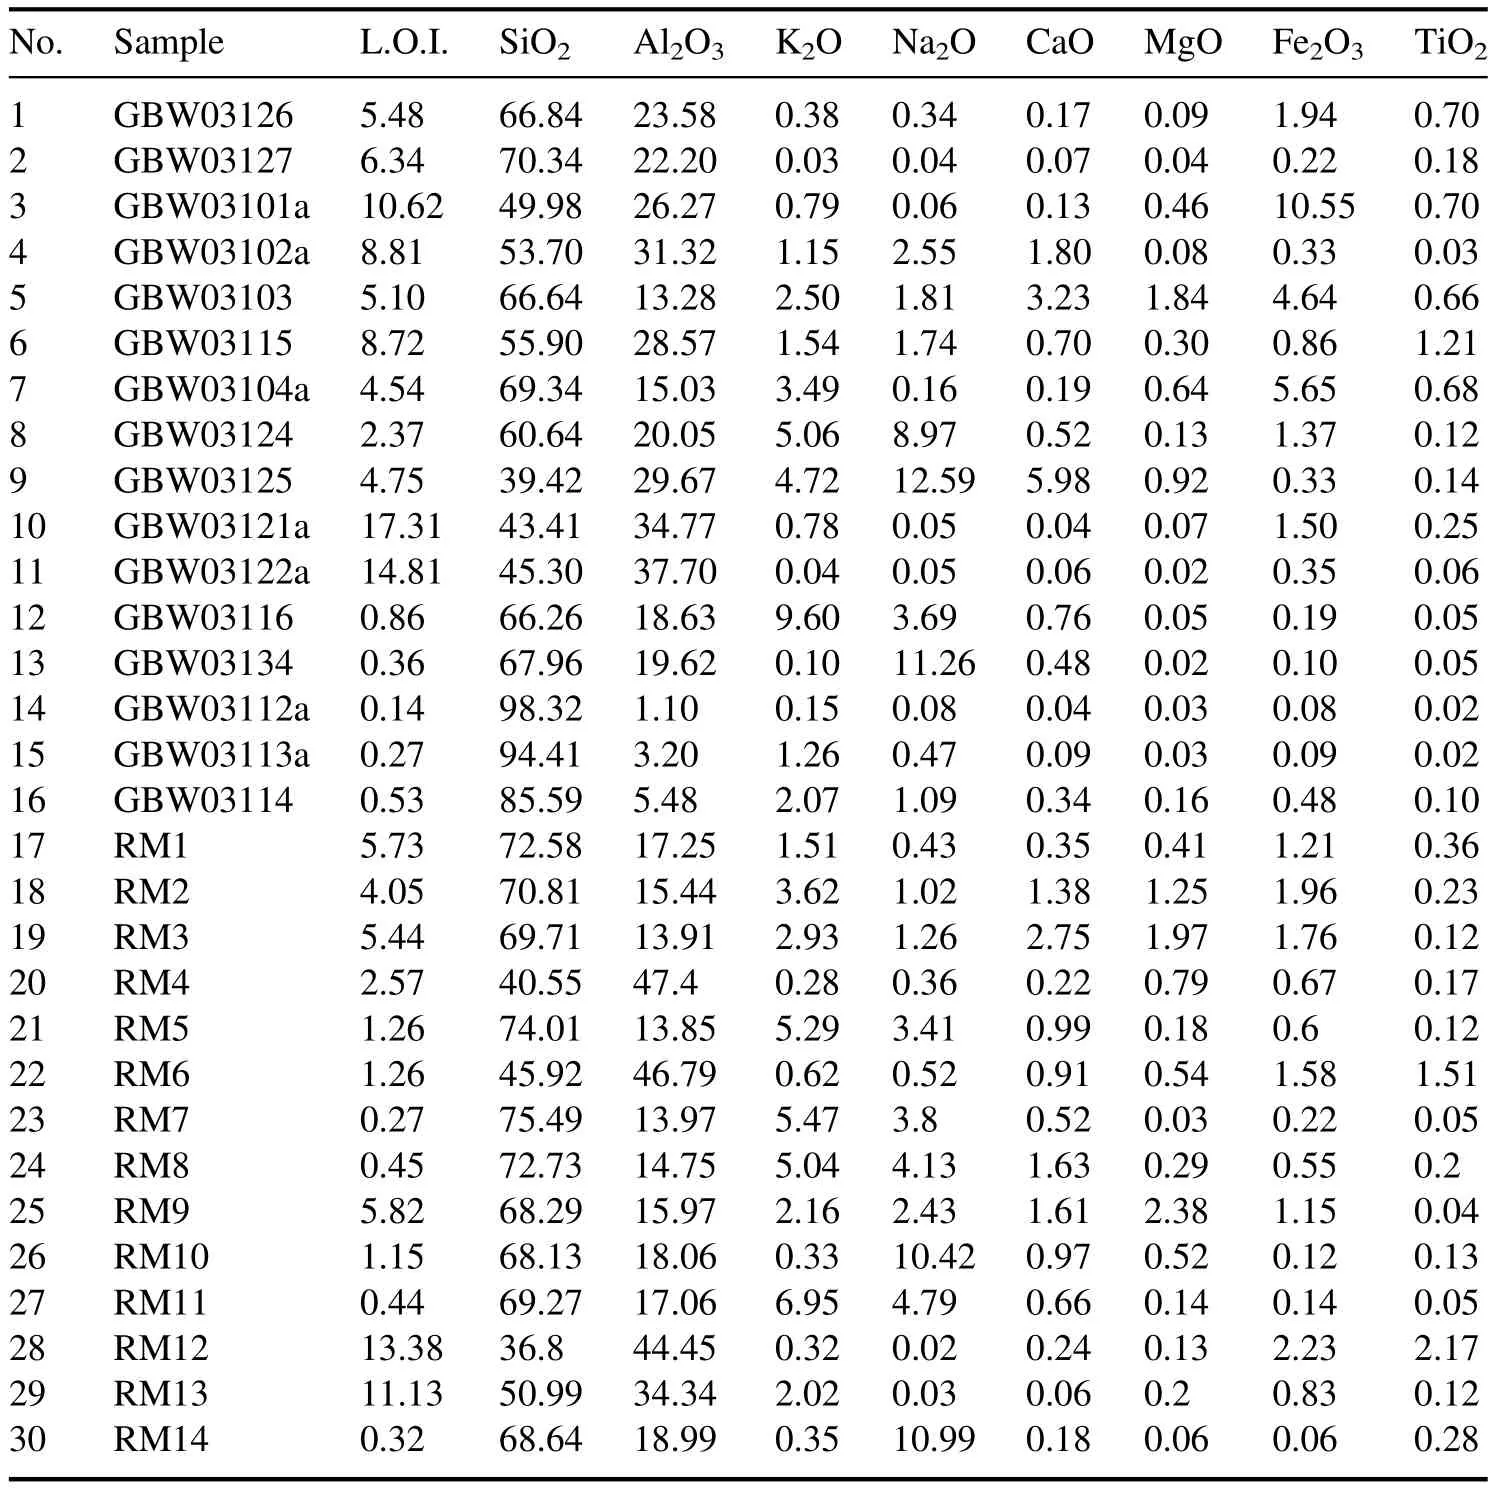
Table 1.Reference content of samples (%).
The tablet-pressing parameters are: (1) 2 g sample powder for each tablet;(2) with boric acid substrate;(3) 4 and 3.2 cm for the outer diameter and inner diameter of the tablet,respectively;(4) pressing under the pressure of 30 T and keeping the pressure for 30 s.
In order to satisfy the condition of full-power output of the fiber laser and obtain stable excitation and collection results,the laser parameters were optimized as follows: the pulse width of 250 ns,frequency of 40 kHz and duration of 150 μs;the delay and integration time of the spectrometers were optimized to 60 and 100 μs,respectively;and the detection frequency of the instrument is 10 Hz.For each detection,the spectrum collected by the spectrometer corresponded to the whole life cycle of plasma emissions excited by four laser pulses.Finally,there were 300 detections from different positions of each tablet,realized by the automatic rotation and translation of the electric control displacement table.The average spectrum of 300 detections is recorded as the original spectrum of the tablet sample.The pressed tablets of different samples and laser ablation craters after detection are shown in figure 2.
The typical spectra collected are shown in figure 3.In the range of 240–400 nm and 610–830 nm,the characteristic spectral lines of Si,Al,K,Na,Ca,Mg,Fe and Ti are all included,and the characteristic spectral lines of other elements,such as H and O,which are related to L.O.I.,are also included.
3.Results and discussion
3.1.Spectral data preprocessing
There were two tablets for each kind of sample listed in table 1.For each tablet,the experiment was repeated twice on different days with the same experimental parameters.Finally,there were four groups (two tablets,two experiments) of original spectral data for each kind of sample.Four plasma emissions were collected by the spectrometers in each detection to obtain sufficient spectral intensity,but due to the lack of time resolution,there was also strong continuous background radiation in the original spectrum.Therefore,the first data preprocessing was continuous background deduction.Furthermore,due to the self-absorption effect and the limited resolution of the module spectrometer,it may not be able to effectively capture the ideal peak intensity of the characteristic spectral line.Therefore,another data preprocessing method used was calculating the full width at half maximum (FWHM) to represent the characteristic spectral line intensity.
3.2.Univariate calibration
Figure 4 shows the correlation between the content and the intensity of the characteristic spectral line of each element.The error bar reflects the standard deviation of spectral intensity between the four experiments for each sample.Due to the different mineral compositions of ceramic raw materials,the spectral line intensity of each element was affected by the matrix effect and could not reflect the element content directly.
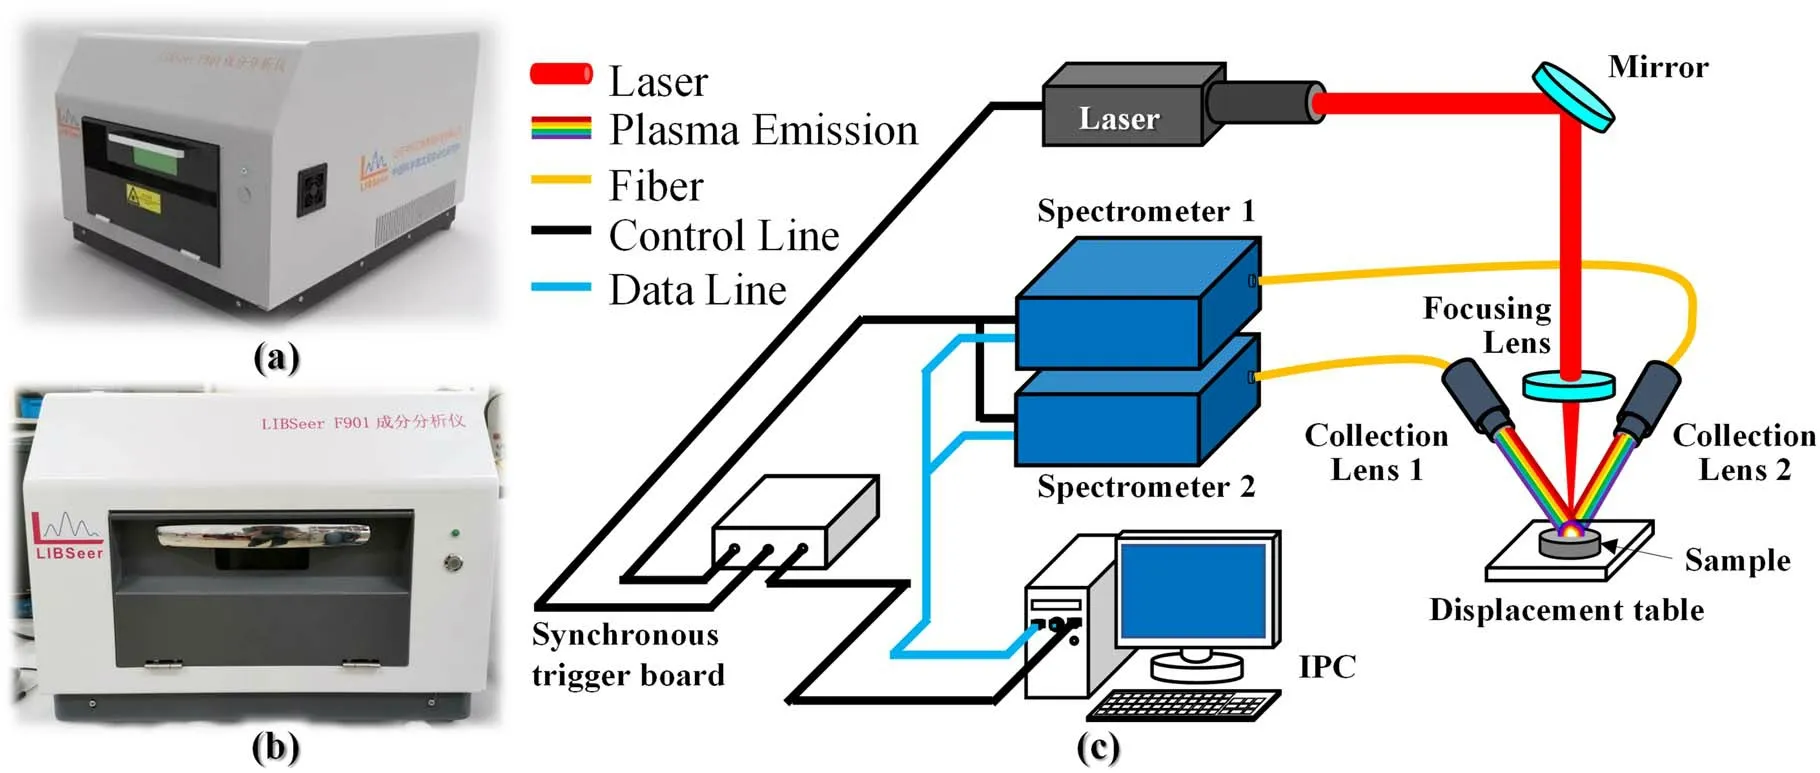
Figure 1.(a) Design rendering of LIBSeer,(b) front view of LIBSeer and (c) structure diagram of the system.
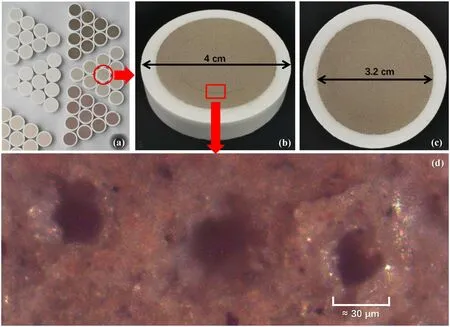
Figure 2.(a) Tablets of different materials,(b) side view of the tablet,(c) vertical view of the tablet and (d) the ablation craters under an electron microscope.

Figure 3.Characteristic spectral lines of different elements in the range of (a) 240–400 nm and (b) 610–830 nm.
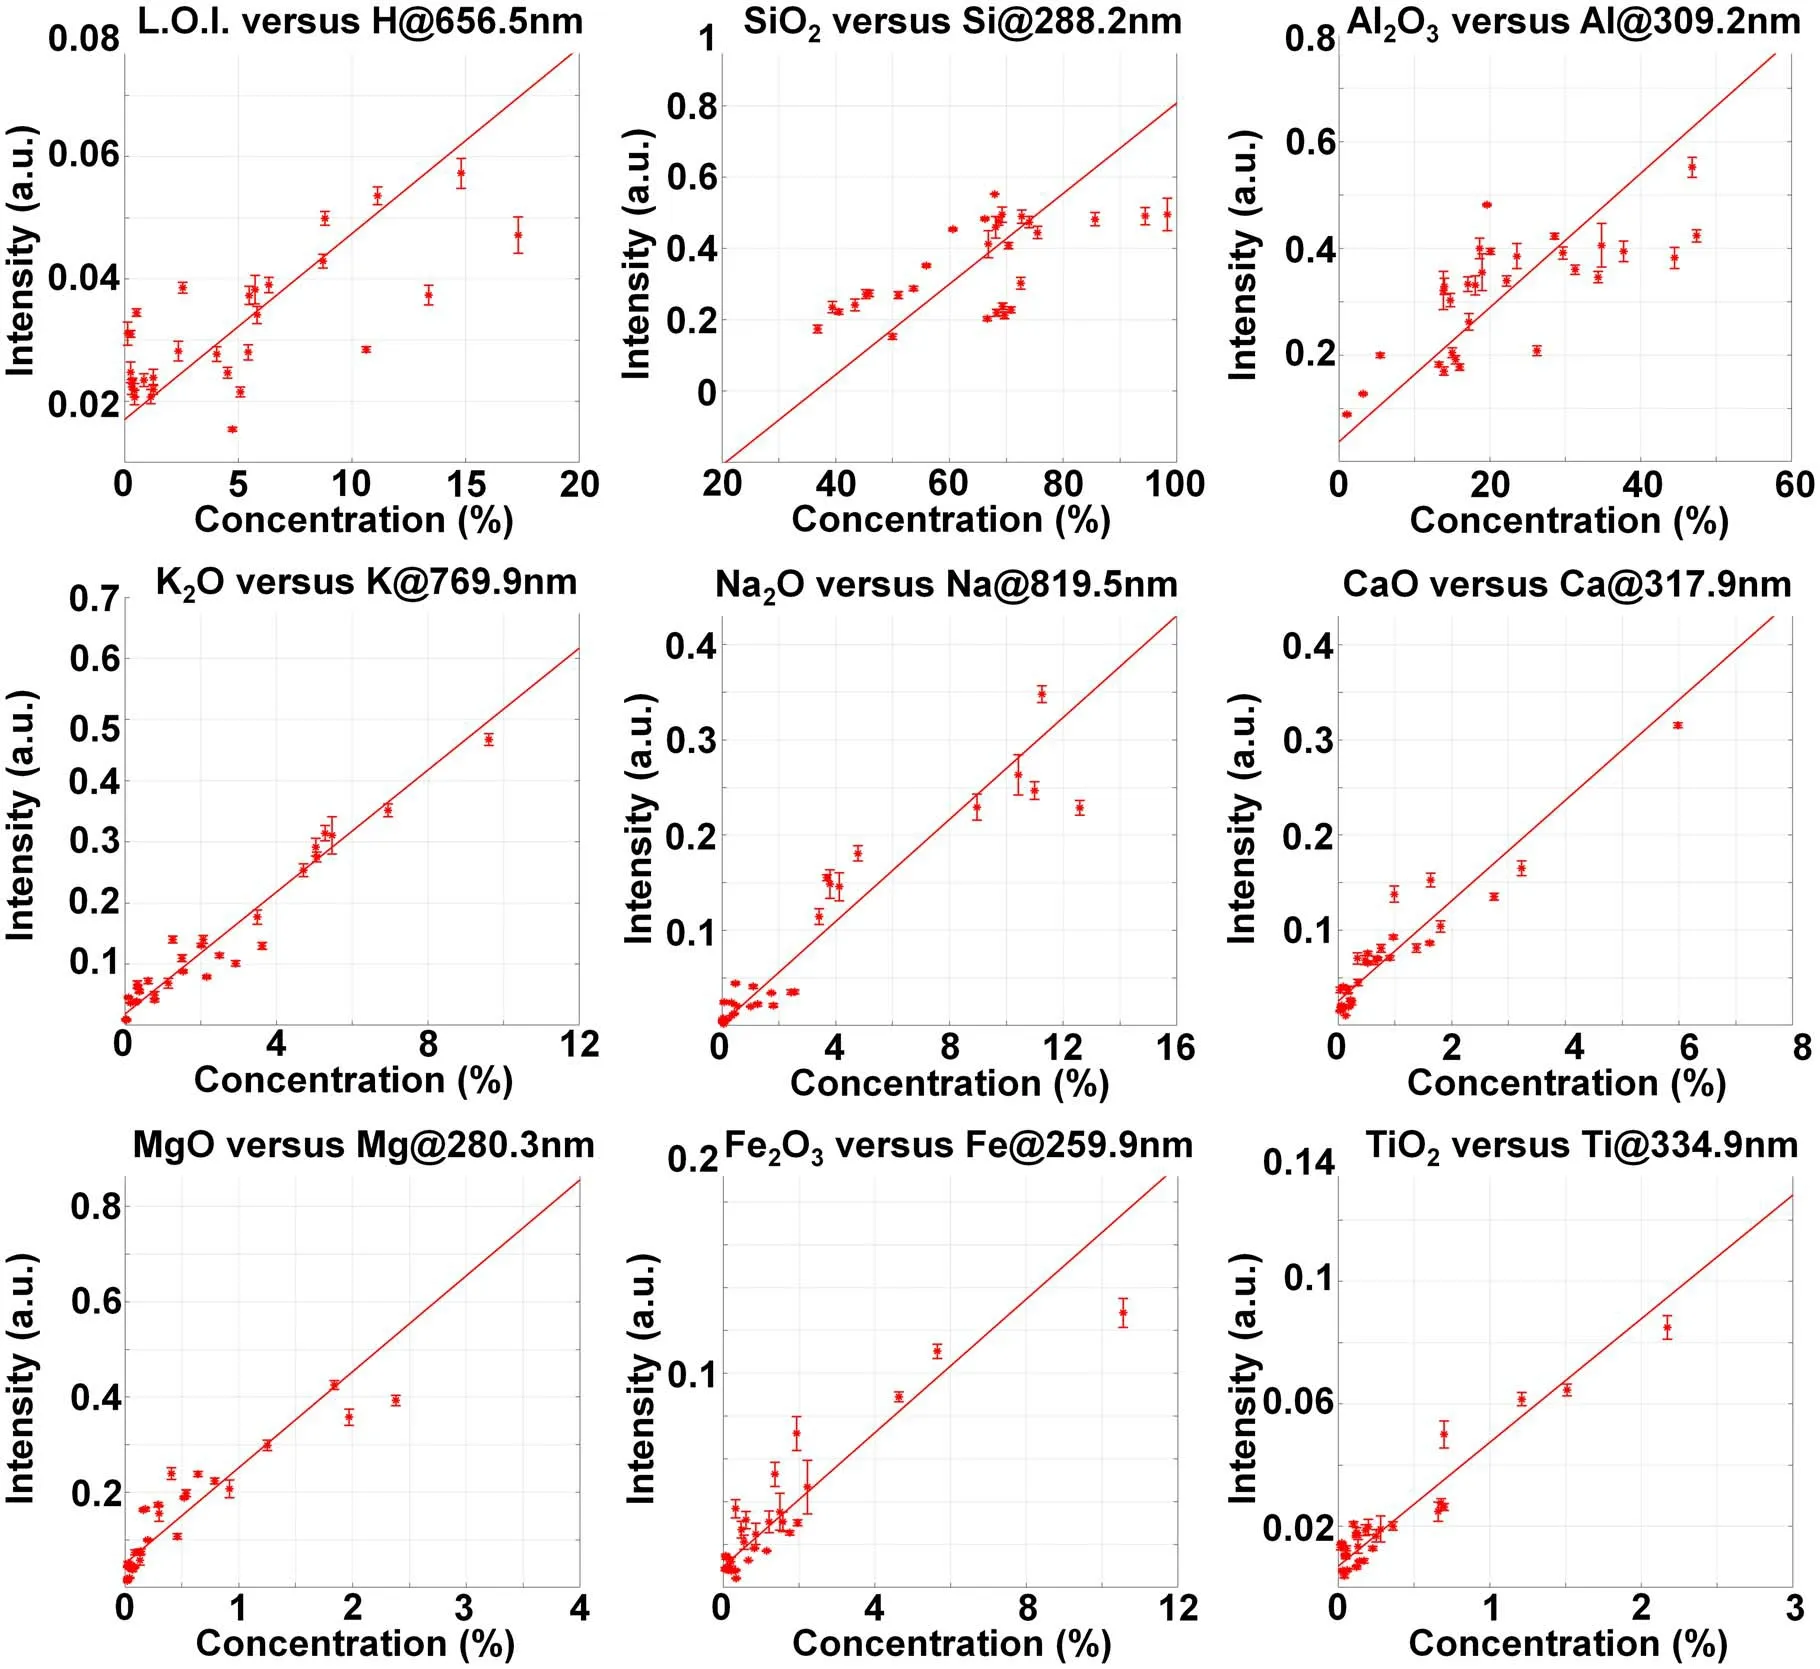
Figure 4.Relationship between the spectral line intensity in the original spectrum and the content of the corresponding element.
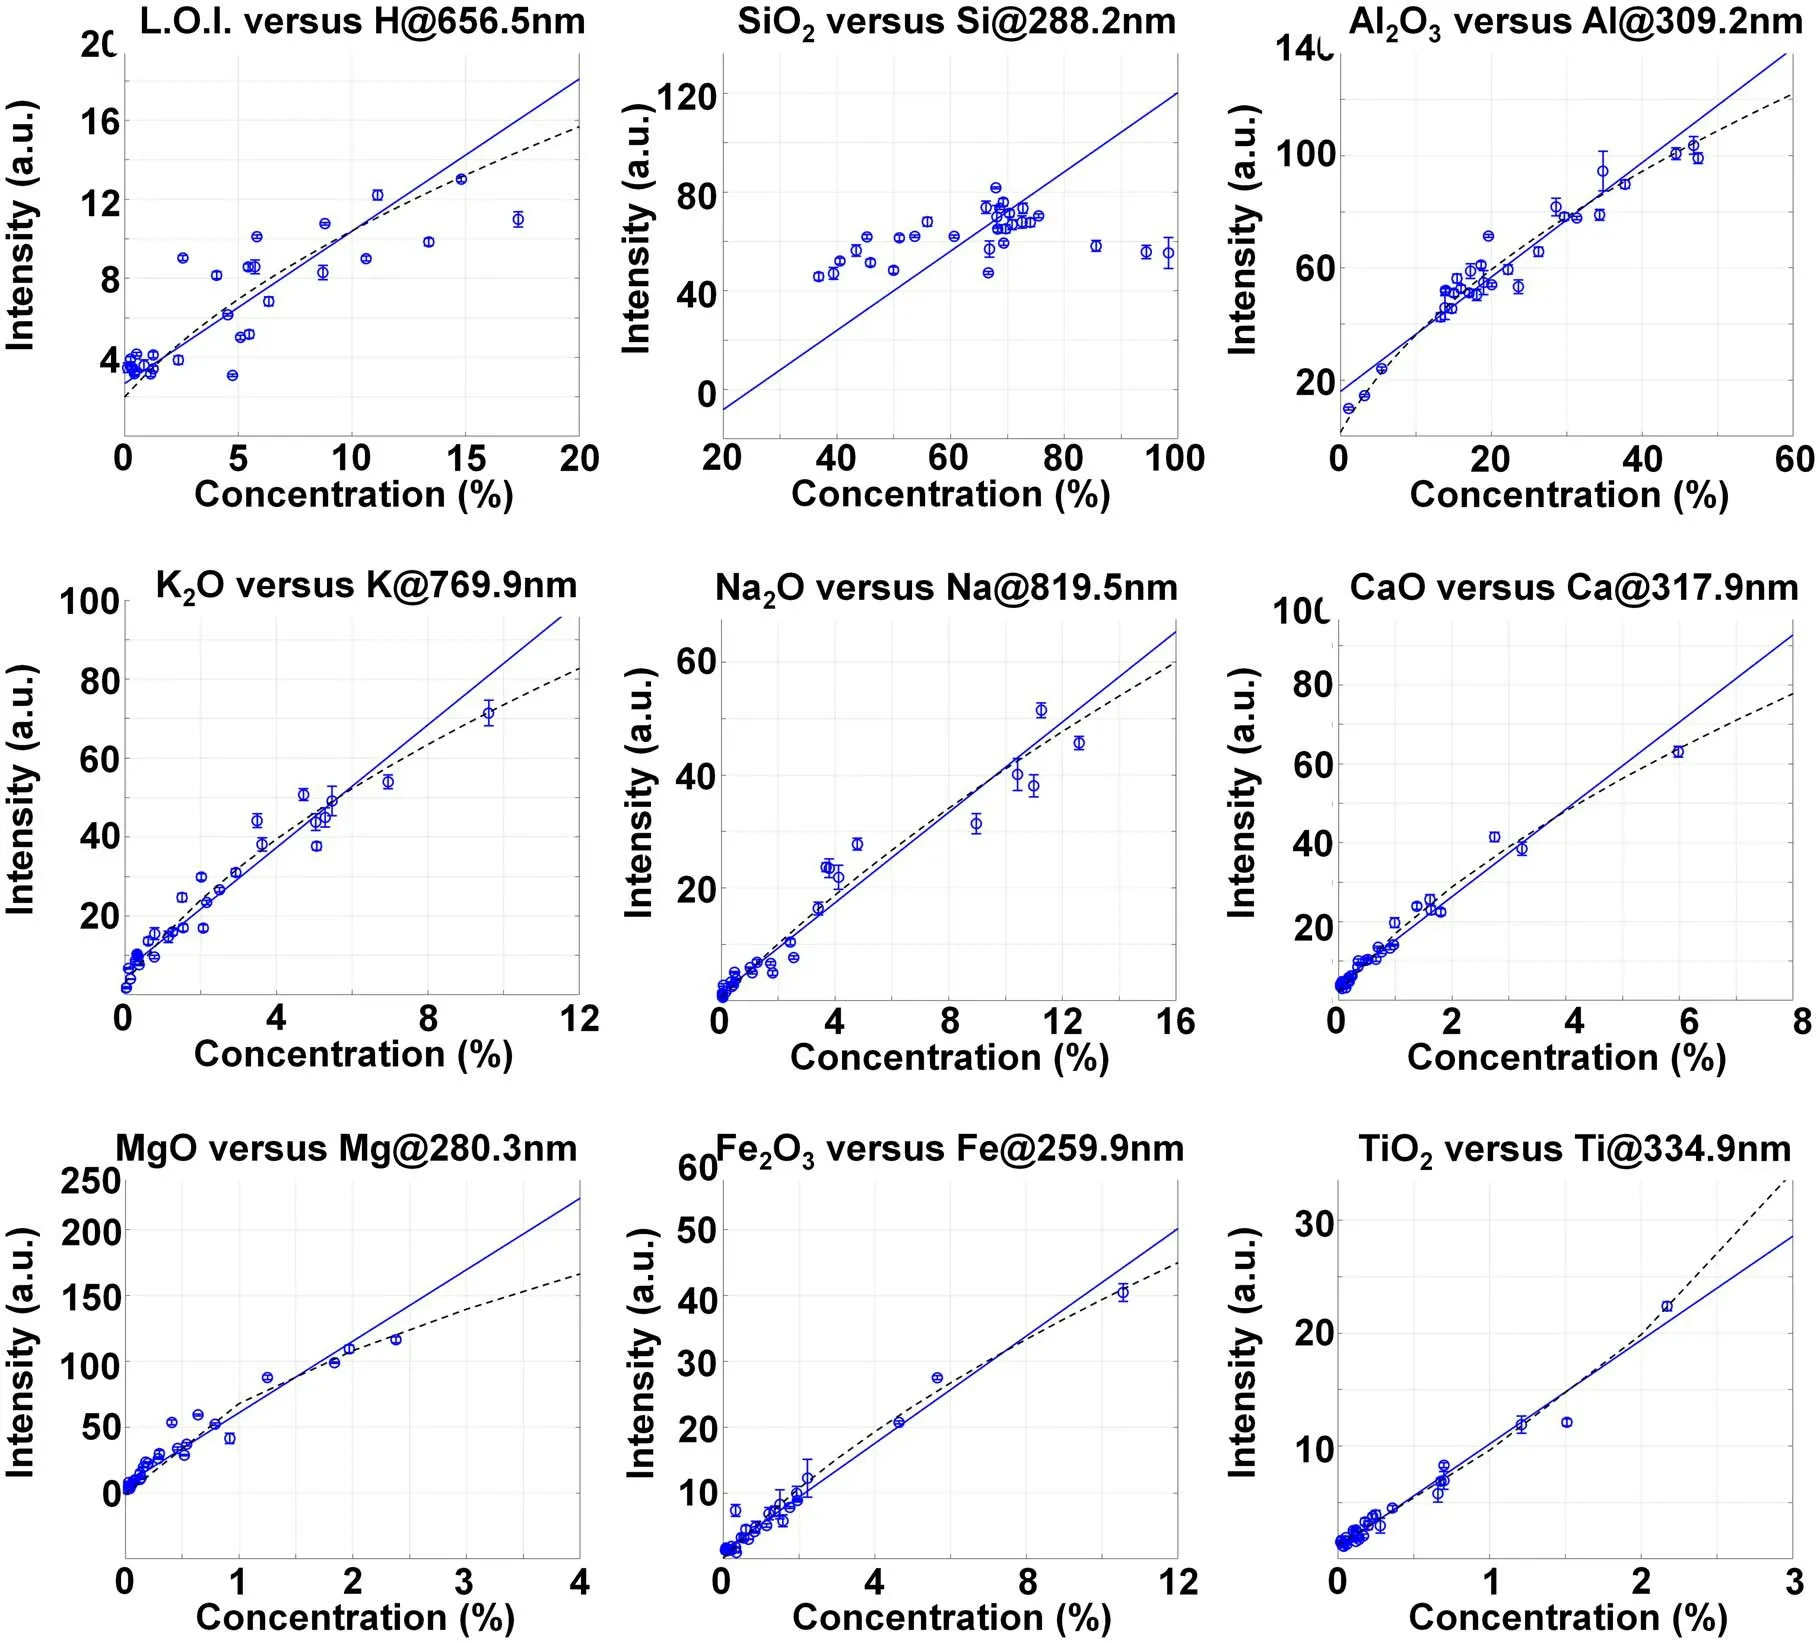
Figure 5.Relationship between the spectral line intensity after the spectral sum normalization and the content of the corresponding element.
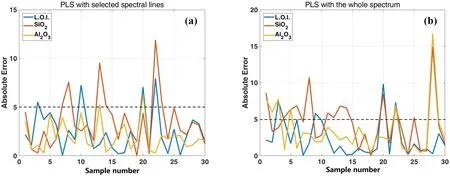
Figure 6.AEs of the 30 samples in the LOO validation of PLSR with(a)the 34 selected spectral lines and the average of the whole spectrum,(b) the whole spectrum.
In order to reduce the influence of the matrix effect on the spectrum,it is necessary to select an appropriate reference value to normalize the original spectral line intensity.The content of each element in different ceramic raw materials varies widely.There is no suitable element to select the reference line for an internal standard.Spectral sum normalization is a feasible method,calculating the sum of the full spectrum detected by the spectrometer as the reference value.The average and relative standard deviation (RSD) values of the spectral sum of each sample in the four experiments are shown in table 2.It can be seen that either the spectral sums or the RSDs of different samples were quite different,due to differences in the plasma emission caused by different matrix compositions.
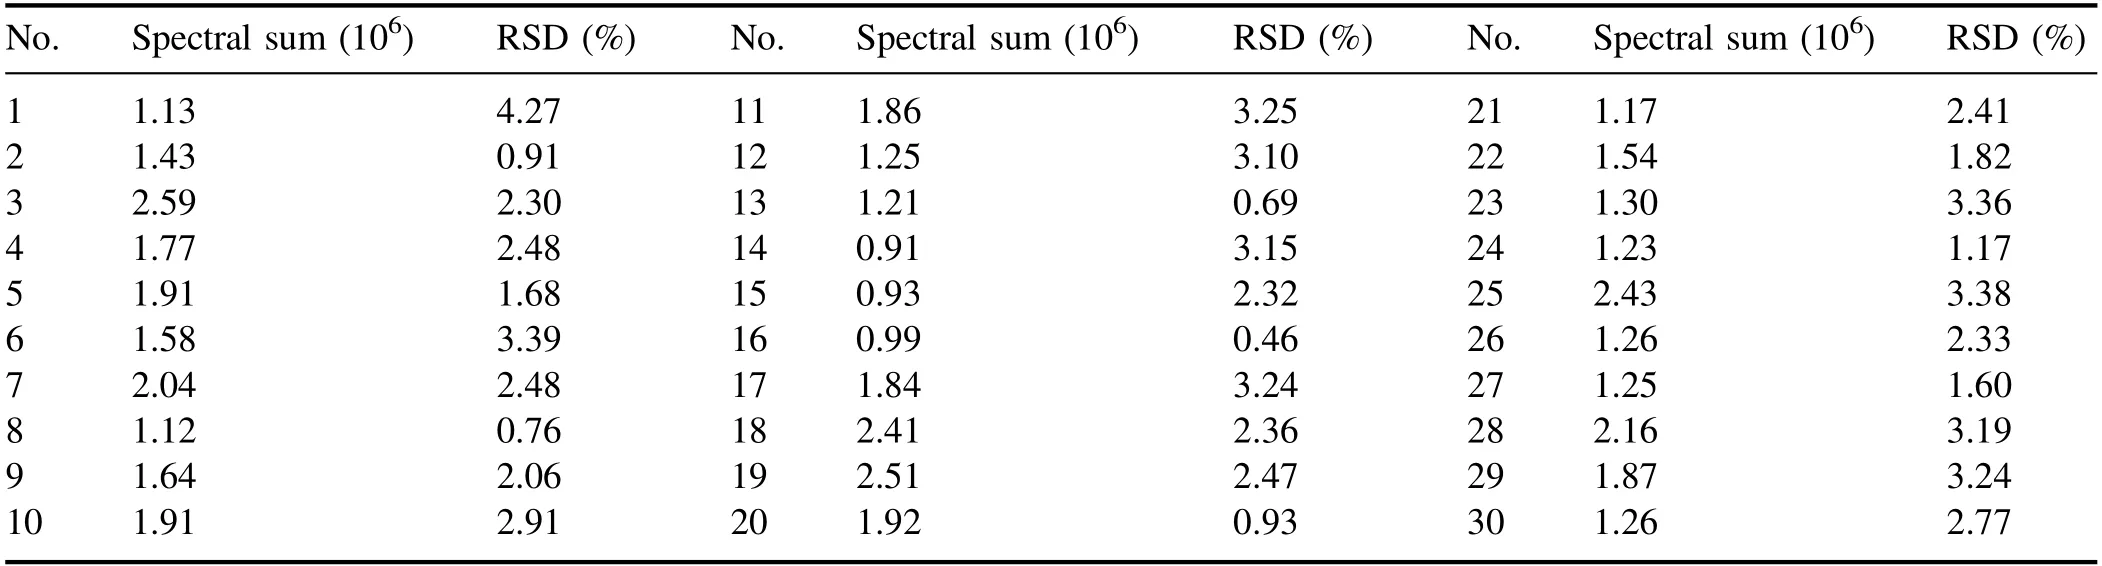
Table 2.Spectral sums and RSDs of different kinds of samples.
The calibration results of the content of each component listed in table 1 using normalized spectral intensity are shown in figure 5.It can be seen that,for most of the components,the correlation between the spectral line intensity and the content was significantly improved after spectral sum normalization.
The characteristic spectral lines and corresponding correlation coefficients (R) selected for each component in figures 4 and 5 are shown in table 3.After spectral sum normalization,the correlation coefficients between all characteristic spectral lines and corresponding content are improved.Further analysis of the spectral lines after spectral sum normalization shows that: (1) L.O.I.includes the structural water discharged during 1000 °C ignition,CO2decomposed by carbonate,SO2decomposed by sulfate,and the loss of material after the thermal decomposition of organic matter.The characteristic spectral line of H can only represent the water content in the sample to some extent,but cannot represent the total L.O.I.Therefore,there was some correlation between L.O.I.and H line at 656.5 nm,but the desired calibration result could not be obtained.(2) As a major element in geological samples,Si exists in most pedogenic minerals in different forms.In a common building ceramics body formula,quartz is usually used as a ridge material,clay as ductile material and feldspar as flux.All these kinds of minerals contain Si.The characteristic line of Si is seriously affected by the matrix effect.Therefore,the correlation between SiO2content and Si line at 288.2 nm was weak.(3)As a major element in clay and feldspar,Al mainly exists in each sample in the form of aluminosilicate.Only part of Al in sample Nos.20,22 and 28 may exist in the form of alumina or hydrated alumina.Therefore,for different kinds of samples,the influence of the matrix effect on Al was more consistent than on Si.The correlation coefficient between the Al2O3content and Al line at 309.2 nm reached 0.96 after spectral sum normalization.(4) For K,Na,Ca and Mg,the main form that exists is aluminosilicate in ceramic raw materials,and the correlation coefficient between oxide content and spectral line is more than 0.97 after spectral sum normalization.(5) Most of the Fe and Ti directly exist in the form of oxides in the samples,so the influence of the matrix effect is relatively weak.The correlation coefficients reached 0.99 after spectral sum normalization.
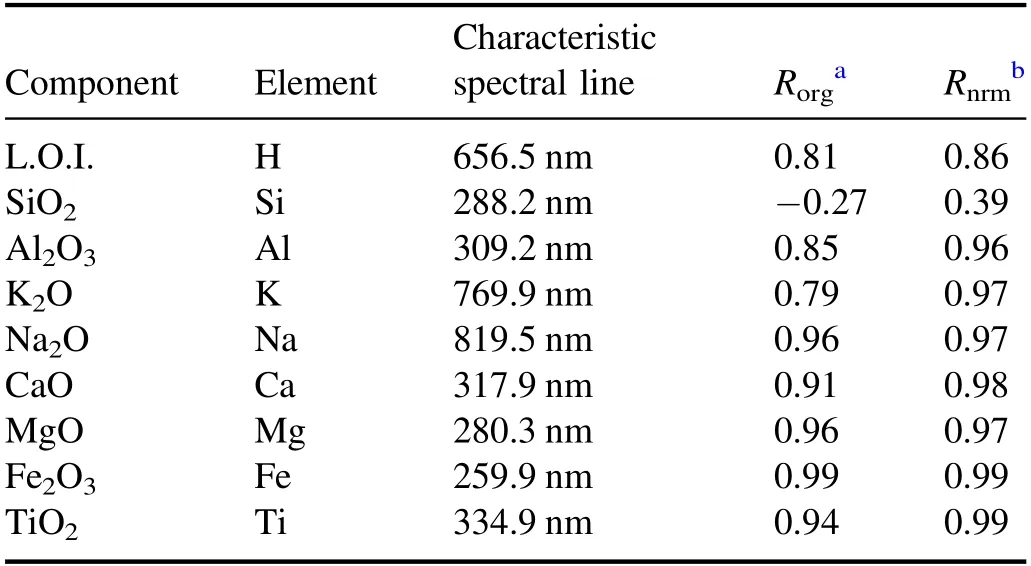
Table 3.Correlation coefficients (R) between characteristic spectral line intensity and concentration.
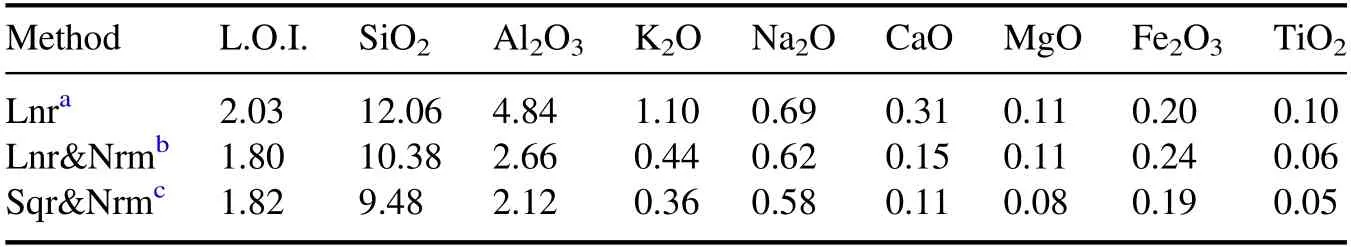
Table 4.MAEs of 30 kinds of samples with different calibration methods.
For comparison between the different calibration methods,the mean absolute errors (MAEs)of direct calibration of L.O.I.and the oxides are shown in table 4.For L.O.I.and most of the oxide content,calibration with the spectral sum normalized intensity can obtain better MAEs.
In the building ceramic structure of SiO2-Al2O3-K2O(Na2O) the following applies: the production will not be affected if the absolute errors of CaO,MgO,Fe2O3and TiO2are less than 0.2%;the absolute error of K2O and Na2O should not exceed 0.5% for firing temperature control;the absolute errors of L.O.I.,SiO2and Al2O3should not exceed 2% for structure and shrinkage control.Therefore,(1) the direct calibration of CaO,MgO,Fe2O3and TiO2can meet the requirements of production control;(2) the direct calibration of K2O can meet the requirement of production control,but direct calibration of Na2O should be further improved;(3)it is not feasible to directly calibrate the L.O.I.,SiO2and Al2O3with spectral lines of H,Si and Al,respectively.Other methods should be used to further improve the prediction accuracy.
3.3.Multivariate analysis
The concentrations of L.O.I.,SiO2,Al2O3,K2O and Na2O are in a wide range in different kinds of ceramic raw materials.The direct calibration could not meet the production requirement.Therefore,more variables were added to build a multivariate model for the quantitative analysis of these compositions.
3.3.1.Double-line analysis of K2O and Na2O.In order to avoid over-fitting caused by excess variables in multivariate analysis,few variables as possible should be selected.The correlation coefficient between the characteristic line intensity and oxide content reached 0.97 for K and Na,and the univariate calibration model could almost meet the requirement of production control.Therefore,only the characteristic lines of the same element with the oxide were selected for the multivariate analysis of K2O and Na2O.Spectral lines at 766.5 and 769.9 nm were selected for K,while spectral lines at 818.3 and 819.5 nm were selected for Na.The calibration model is described as,
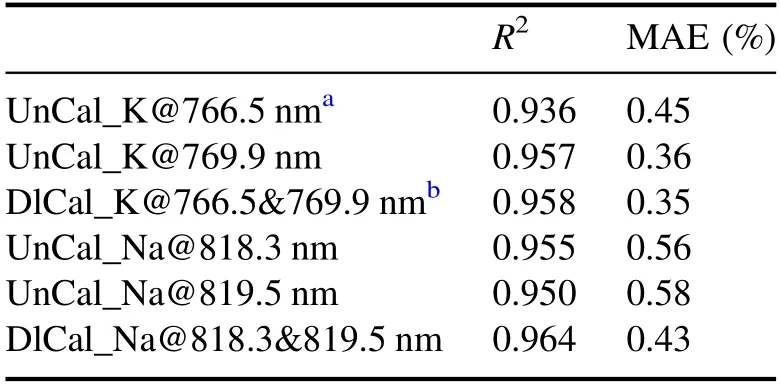
Table 5.Comparison results of K2O and Na2O with different calibration models.

where X stands for K or Na,C stands for the content of the oxide,IX1and IX2stand for the spectral sum normalized intensities of the two selected spectral lines of K or Na,and a0–a4are the fitting coefficients.
The comparison results of the content calibration of K and Na with different calibration models are shown in table 5.The determination coefficient(R2)and MAE values show that the double-line calibration of K and Na can obtain better results than the univariate calibration with either of the spectral lines alone,and the analysis accuracy can meet the requirement of the building ceramic production control.
3.3.2.Multivariate analysis of L.O.I.,SiO2and Al2O3.It can be seen from table 4 that for L.O.I.,SiO2and Al2O3,the accuracy of univariate analysis should be further improved to meet the production control requirement.The multivariate analysis model is described as,
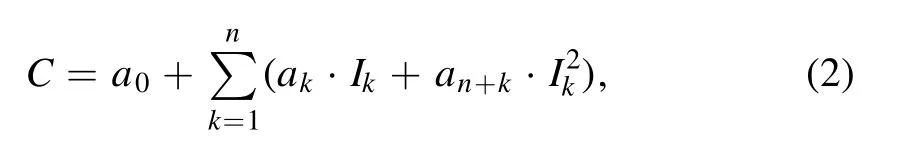
where C stands for the content of SiO2,Al2O3or L.O.I.,Ikstands for the spectral sum normalized intensity of the kth selected spectral line,n is the number of the selected spectral lines,and a0–a2nare the fitting coefficients.The R2and MAE of different combinations of spectral lines are shown in table 6.It can be seen that because the interaction among L.O.I.,SiO2and Al2O3was considered to some extent,the combination of the spectral lines of H,Si,Al and the average of the whole spectrum can obtain the best R2and MAE for SiO2and Al2O3,and adding the spectral line of O can improve the R2of L.O.I.slightly.
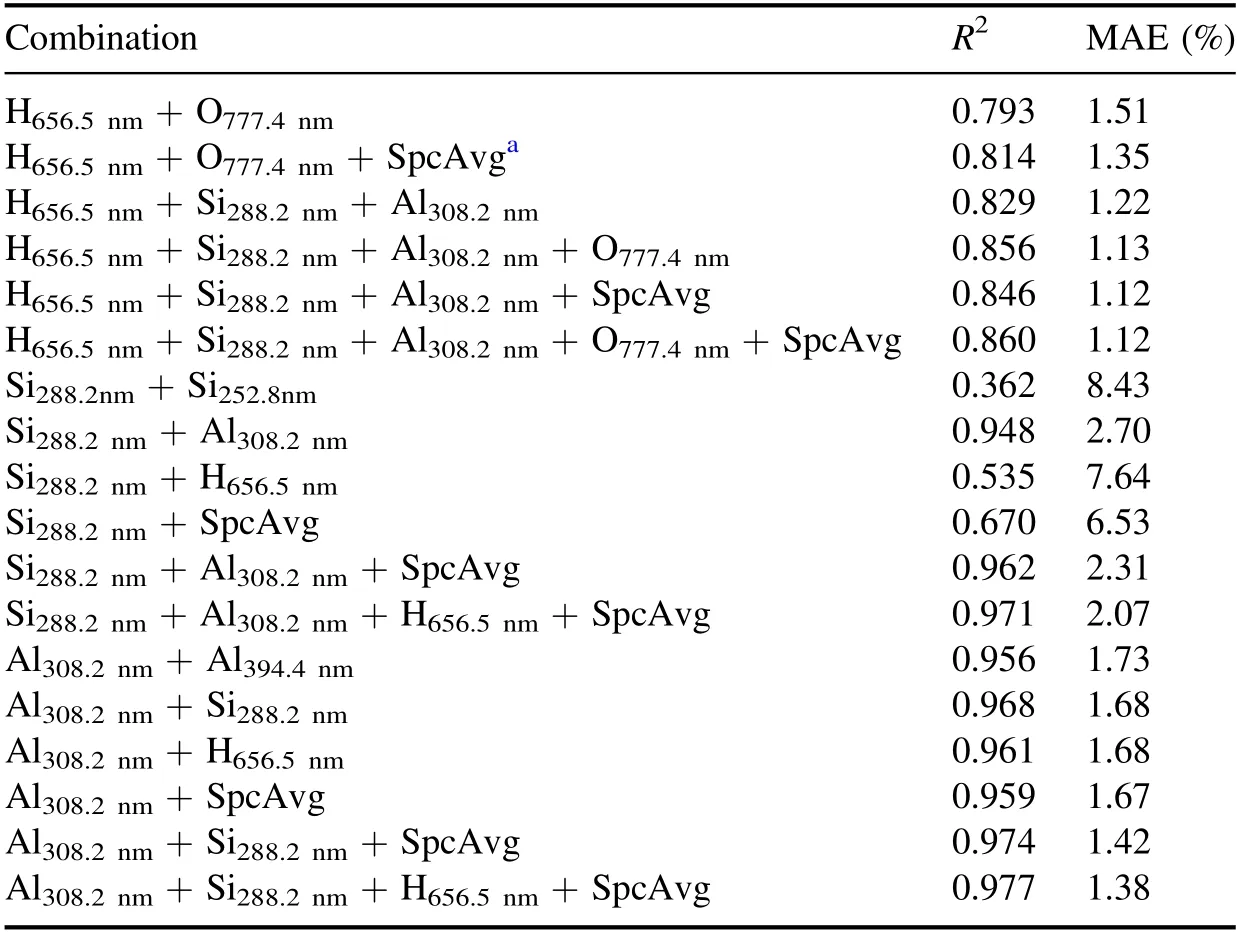
Table 6.Comparison results of multivariate regression with different spectral line combinations.
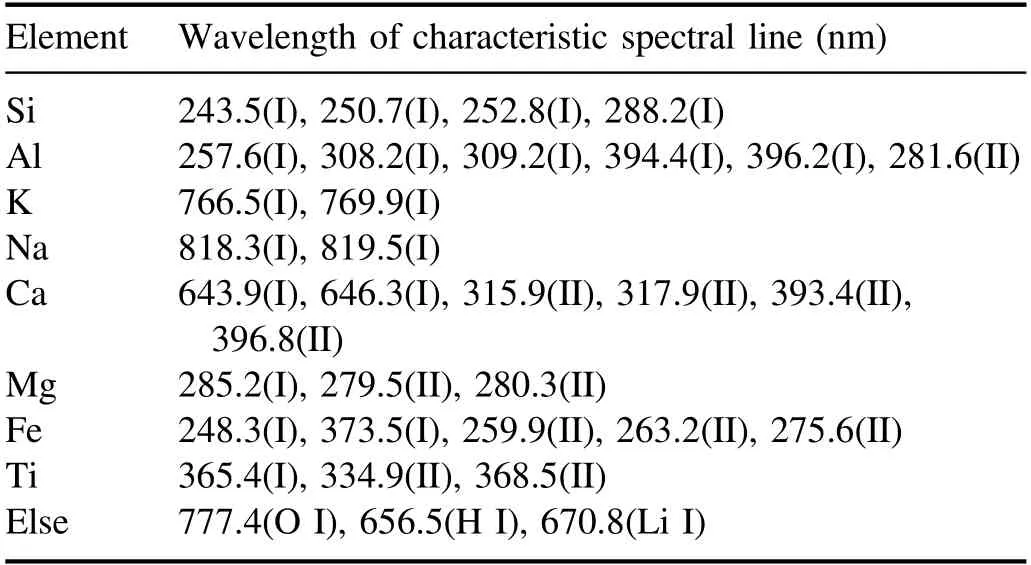
Table 7.Spectral lines selected for PLSR.
Partial least squares regression (PLSR) was further introduced to build the multivariate model with more spectral lines.There are 34 lines listed in table 7,which were used as the input of PLSR.Furthermore,the whole spectrum was also used as the input of PLSR as a comparison.
The leave-one-out (LOO) validation results of different methods are shown in table 8.It can be seen that(1)the PLS model with the 35 selected spectral intensities can obtain better R2and MAE than the model with the whole spectrum for SiO2and Al2O3;(2)the PLS model with either the whole spectrum or the 35 selected spectral intensities cannot obtain better R2and MAE than the multiple regression described above.The specific absolute errors (AEs) of the 30 samples with the PLSR are shown in figure 6,to further analyze the poor performance of PLS in the experiment.It can be seen that there are some samples with AE larger than 5%and even larger than 10%.Analyzing each sample specifically,the main reasons for the large AEs of the samples may be that(1)there are no samples with a similar matrix in the training set of LOO validation (e.g.samples 22 and 28 are calcined bauxite and calcined flint clay,respectively,and there are no other similar calcined bauxite and flint clay samples in the 30 samples);(2) the content of the component cannot be well expressed by the selected lines(e.g.the L.O.I.of sample ten is 17.31%,whereas the concentration of the structural water is only 13.24%and the concentration of SO3is 5.51%,but there are no S lines in the whole spectrum in the experiment).In conclusion,under the complex sample matrix and limited sample types of ceramic raw materials,more variable dimensions do not always lead to better analysis results.
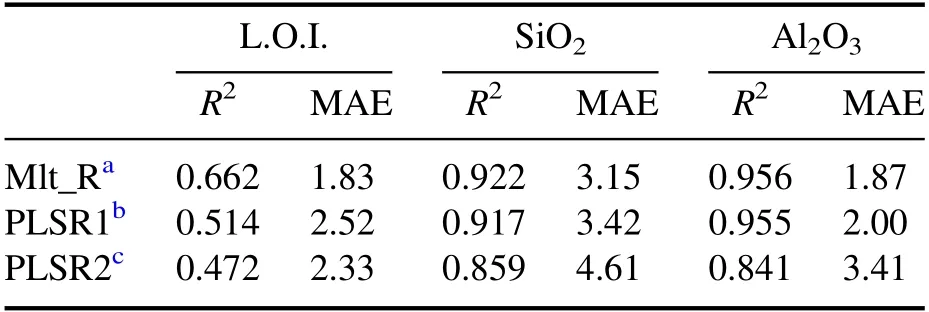
Table 8.LOO validation results of multiple regression and PLSR.
4.Conclusion
In this paper,we introduced the quantitative analysis of SiO2,Al2O3,K2O,Na2O,CaO,MgO,Fe2O3,TiO2and L.O.I.with the atomic emission spectrum induced by a fiber-laser-based LIBS analyzer.Different data processing and analysis methods were discussed to meet the production control requirement.With the combination of continuous background deduction,FWHM intensity integral and spectral sum normalization,the MAEs of univariate calibration were reduced to below 0.2%for CaO,MgO,Fe2O3and TiO2,which can meet the production control requirement.Furthermore,using the double-line analysis model of K and Na,the MAEs of K2O and Na2O were reduced to below 0.5%,meeting the production control requirement.Multiple regression and PLSR were further introduced for the analysis of SiO2,Al2O3and L.O.I.The optimized analysis model reduced the MAEs of SiO2,Al2O3and L.O.I.to 2.07%,1.38% and 1.12%,respectively.It is proved that the use of the fiber-laser-based desktop LIBS analyzer is feasible for the quantitative analysis of the main inorganic elements in geological samples.However,due to the complex sample matrix effect and the limited kinds of experimental samples,complex multivariate analysis did not effectively improve the prediction accuracy.In future work,with the increase in the number of modeling samples,it is expected that there will be further improvement in the analysis accuracy of the instrument through the use of complex multivariable analysis algorithms.This will lead to an expansion of application fields.
Acknowledgments
This work is supported by National Natural Science Foundation of China (No.62173321),the Key Research Program of Frontier Sciences,CAS (No.QYZDJ-SSW-JSC037),the Science and Technology Service Network Initiative Program,CAS (No.KFJ-STS-QYZD-2021-19-002),the Liaoning Provincial Natural Science Foundation (No.2021-BS-022)and the Youth Innovation Promotion Association,CAS.
猜你喜欢
Plasma Science and Technology(2022年3期)2022-04-15
金桥(2022年1期)2022-02-12
电影文学(2021年20期)2021-11-13
科学与财富(2021年36期)2021-05-10
故事会(2018年13期)2018-07-03
今日民族(2017年4期)2017-05-13
艺术评论(2017年10期)2017-03-22
故事林(2010年24期)2010-05-14
金山(2009年12期)2009-01-14
 Plasma Science and Technology2022年8期
- Plasma Science and Technology的其它文章
- Image-based plasma morphology determination and LIBS spectra correction in combustion environments
- Rapid identification of volatile organic compounds and their isomers in the atmosphere
- Fast identification of mural pigments at Mogao Grottoes using a LIBS-based spectral matching algorithm
- Aqueous ruthenium detection by microwaveassisted laser-induced breakdown spectroscopy
- Effect of lens-to-sample distance on spatial uniformity and emission spectrum of flat-top laser-induced plasma
- Elemental and proximate analysis of coal by x-ray fluorescence assisted laser-induced breakdown spectroscopy