
Elemental and proximate analysis of coal by x-ray fluorescence assisted laser-induced breakdown spectroscopy
2022-09-14 08:18ZhihuiTIAN田志辉XiaolinLI李晓林GangWANG王钢LeiZHANG张雷JiaxuanLI李佳轩ShuqingWANG王树青YuBAI白禹WanfeiZHANG张婉飞HanYUE岳晗XiaofeiMA马晓飞WangbaoYIN尹王保andSuotangJIA贾锁堂
Plasma Science and Technology 2022年8期
Zhihui TIAN (田志辉),Xiaolin LI (李晓林),Gang WANG (王钢),Lei ZHANG (张雷),Jiaxuan LI (李佳轩),Shuqing WANG (王树青),Yu BAI (白禹),Wanfei ZHANG (张婉飞),Han YUE (岳晗),Xiaofei MA (马晓飞),Wangbao YIN (尹王保) and Suotang JIA (贾锁堂)
1 State Key Laboratory of Quantum Optics and Quantum Optics Devices,Institute of Laser Spectroscopy,Shanxi University,Taiyuan 030006,People’s Republic of China
2 Collaborative Innovation Center of Extreme Optics,Shanxi University,Taiyuan 030006,People’s Republic of China
3 Shanxi Xinhua Chemical Defense Equipment Research Institute Co.,Ltd,Taiyuan 030006,People’s Republic of China
4 Research Institute of Petroleum Processing,SINOPEC,Beijing 100089,People’s Republic of China
Abstract Although laser-induced breakdown spectroscopy (LIBS),as a fast on-line analysis technology,has great potential and competitiveness in the analysis of chemical composition and proximate analysis results of coal in thermal power plants,the measurement repeatability of LIBS needs to be further improved due to the difficulty in controlling the stability of the generated plasmas at present.In this paper,we propose a novel x-ray fluorescence (XRF) assisted LIBS method for high repeatability analysis of coal quality,which not only inherits the ability of LIBS to directly analyze organic elements such as C and H in coal,but also uses XRF to make up for the lack of stability of LIBS in determining other inorganic ash-forming elements.With the combination of elemental lines in LIBS and XRF spectra,the principal component analysis and the partial least squares are used to establish the prediction model and perform multi-elemental and proximate analysis of coal.Quantitative analysis results show that the relative standard deviation(RSD)of C is 0.15%,the RSDs of other elements are less than 4%,and the standard deviations of calorific value,ash content,sulfur content and volatile matter are 0.11 MJ kg−1,0.17%,0.79%and 0.41%respectively,indicating that the method has good repeatability in determination of coal quality.This work is helpful to accelerate the development of LIBS in the field of rapid measurement of coal entering the power plant and on-line monitoring of coal entering the furnace.
Keywords: laser-induced breakdown spectroscopy (LIBS),x-ray fluorescence spectrometry(XRF),high repeatability measurement,spectral calibration,instability analysis
1.Introduction
According to statistics from the National Bureau of Statistics of China,the installed capacity of thermal power generation in 2020 was 1.25 billion kW,an increase of 4.7%over 2019,and the output of raw coal also increased to 3.9 billion tons.China remains a big coal-burning country,and the coal consumption is increasing year by year[1,2].However,with the gradual depletion of coal resources,it is particularly important to improve the comprehensive utilization rate of coal under the advocacy of sustainable development,recycling and low-carbon economy [3].Developing the coal mixing and optimal control technology in thermal power generation is an important way to improve resource utilization and realize low-carbon economy.The key lies in rapid analysis of coal to obtain the real-time coal quality.
The elemental composition and the proximate analysis data are vital indicators to characterize the coal quality.The latter includes the calorific value,ash content,sulfur content and volatile,which are instructive and meaningful for optimal boiler operation.The calorific value of coal refers to the heat produced by the complete combustion of coal per unit mass,and is an important index representing the characteristics of coal.Ash is the solid residue of coal after complete combustion under specified conditions,which is derived from the oxidation and decomposition of minerals in coal.The higher the ash content of coal,the lower the thermal efficiency.At the same time,the slag formed by coal combustion affects the operation of the boiler,so high ash coal is extremely unfavorable to coal utilization.The volatile matter refers to the combustible gas produced by thermal decomposition of organic matter in coal,which is the main indicator for coal classification [4].The coal with high volatile content is easy to produce unburned carbon particles during combustion and reduce the thermal efficiency,while the coal with low volatile content is easy to cause fire extinguishing in the boiler and difficult to ensure stable combustion.Sulfur content reflects the amount of organic sulfur in coal and is directly related to the emission of toxic sulfide gas.At present,the main methods for proximate analysis of coal in China’s power plants are oxygen bomb,rapid ashing,isolated air heating and Eschka [5–9],that specified in the national standards GB/T 213-2008,GB/T 212-2008 and GB/T 214-2007.However,they are usually time-consuming (2–3 h),seriously lagging behind the industrial production and unable to guide the coal blending and combustion process in time.
The rapid analysis of coal quality mostly adopts prompt gamma neutron activation analysis [10,11],which uses a radioactive source to activate the coal sample,and realizes elemental and proximate analysis of coal by analyzing energy spectra data of gamma ray.However,it is difficult to be widely used in power plants due to radioactive hazards.There are also some other rapid analytical methods.For example,Vogt et al [12]used the electrothermal vaporization-inductively coupled plasma to analyze ten ash-forming elements(Si,Al,Ca,Fe,Mg,Na,K,Mn,S,and Ti) in coal.Ottesen et al [13]used laser spark emission spectroscopy to compare the composition of coal particles,and determined the elemental ash composition.But the repeatability of these methods is not satisfactory.It is noted that the x-ray fluorescence spectrometry(XRF)[14]has been widely used in the analysis of coal ash in recent years.Its principle is to use high-energy x-rays to bombard the coal samples and realize chemical analysis by analyzing the fluorescent emission of characteristic secondary x-rays [15].For example,Mujuru et al [16]determined the ash content by measuring the secondary radiation of coal in three different x-ray energy ranges,and the average standard deviation (SD) of ash was 2.5%.Ma et al[17]used XRF to analyze the ash-forming elements such as Mg,Al,Si,Fe,Ca,Na,K and Ti in coal,and the repeatability met the requirements of national standard.Hicks et al[18]used XRF to predict the ash content of coal,and the mean SD was 1.7%.While XRF has good repeatability in measuring inorganic ash-forming elements in coal,it cannot analyze the key organic light elements such as C and H.Therefore,the calorific value and volatile content of coal cannot be predicted directly.
Laser-induced breakdown spectroscopy (LIBS) [19]is one of the most promising coal quality analysis techniques because of its advantages such as safe,fast,and almost allelement analysis [20,21].It uses the intense laser pulses to focus on the surface of coal to produce plasmas,and to realize the chemical composition prediction by statistical analysis of the fluorescence spectra of plasmas [22].
In LIBS analysis of coal quality,there are some problems,such as self-absorption effect for major elements,low sensitivity for trace elements and poor measurement repeatability.Self-absorption appears when light travels from the nucleus of plasma to the outside as a result of transitions of the same atoms or molecules in the transmission path [23].Guo et al [24,25]used a wavelength-tunable laser enabling transition of atoms in ground-state in the plasma to high energy state as stimulated absorption,thus reducing their amount in laser-induced plasmas and preventing spectrum from being influenced by self-absorption effect.Iqbal et al[26]analyzed the coal quality by calibration-free laserinduced breakdown spectroscopy,and eliminated the selfabsorption of plasma emission line intensity through internal reference self-absorption correction.For the improvement of sensitivity,Fu et al [27]used the cavity confinement method to enhance the LIBS spectra,that is,the reflection of the cavity on the shock wave was used to compress the plasma,so as to make the nuclear temperature higher and the radiation stronger.Guo et al [28]introduced the laser-induced fluorescence to selectively excite the ground-state atoms of elements in the plasma,so as to enhance the spectral line intensity.Ni et al [29]adopted the plasma image integral intensity normalization method,and by setting the plasma image edge extraction threshold,the correlation between spectral line intensity and mass fraction was enhanced,and the influence of LIBS experimental parameter fluctuations on the quantitative analysis of components was reduced.Researchers have been pursuing better repeatability of coal quality measurement.For example,Yao et al[30]used cluster analysis,artificial neural network and genetic algorithm to make the SD of calorific value determined by LIBS reached 0.86 MJ kg−1.Lu et al [31]used the same spectral analysis algorithm,but pressed the pulverized coal into pellets,and the SD of calorific value was further reduced to 0.38 MJ kg−1,and the RSDs of nine elements in coal were within±10%.Li et al [32]optimized the parameters of experimental LIBS device so that the RSD of C,H,Al,Mg,Ca,Fe,Si,K,and Na in coal reached 4.10%,4.45%,4.66%,4.91%,3.14%,3.73%,4.35%,4.21%,and 2.34%,respectively.The RSD of our previously developed LIBS system for predicting the content of C in coal was 1.49%[33].Yu et al[34]studied the matrix effect of coal particle flow using LIBS,the ablation quality and laser thermal effect of plasma were characterized by ablation crater profiling method and rapid imaging method,which reduced the repeatability of spectral analysis response of C spectral line from 21.64% to 12.87%.Song et al [35]used the new machine learning method of collaborative regression to automatically analyze the coal of coal-fired power plants based on the developed online coal analysis LIBS system.The mean absolute errors (MAEs) of calorific value,sulphur,volatile and ash quantification were 0.299 MJ kg−1,0.077%,0.590%and 0.855%,respectively,and the test results of calorific value,sulphur and volatile have met the standard of producibility critical difference.The instability of LIBS analysis for coal mainly comes from the Rayleigh–Taylor instability inevitably triggering the fluctuation of plasma morphology,which is amplified by the back pressed downward process of frontier material of plasma [36–38].In addition,a comparison of repeatability of LIBS and XRF for coal quality analysis in the introduction is shown in table 1.How to greatly improve the measurement repeatability of LIBS is the key to its industrial application.
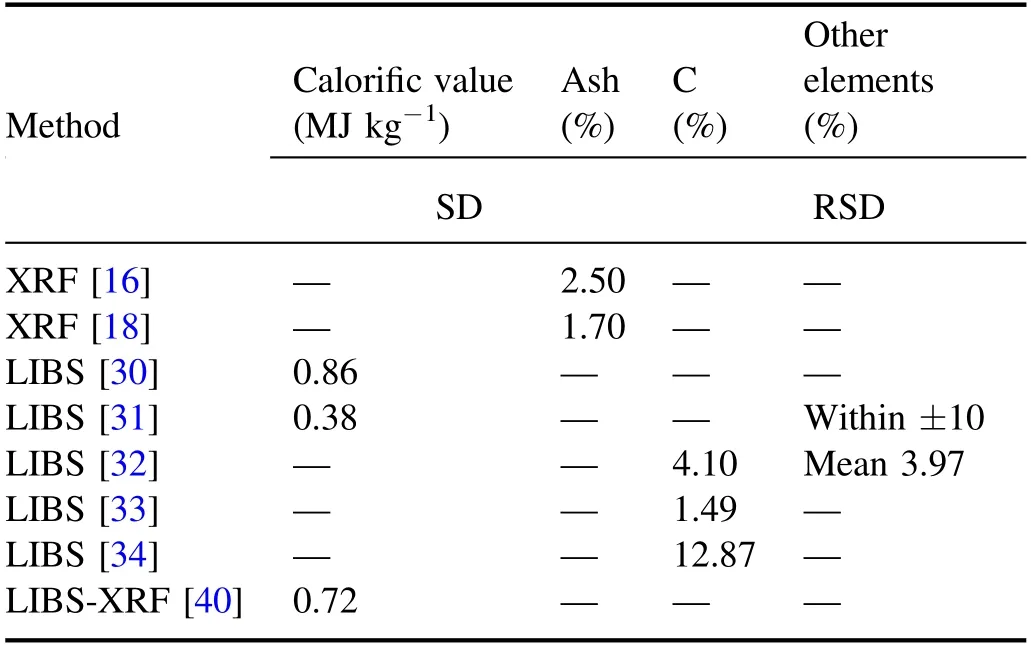
Table 1.Comparison of repeatability of LIBS and XRF for coal quality analysis.
Recently,an XRF assisted LIBS method for high repeatability analysis of coal quality is proposed by our group,which not only inherits the ability of LIBS to directly analyze organic elements such as C and H in coal,but also uses XRF to make up for the lack of stability of LIBS in determining other inorganic ash-forming elements.We improved the accuracy of LIBS-XRF coal quality analysis through spectral intensity correction and piecewise modeling to solve the interference of x-ray emission intensity fluctuation on fluorescence signal in practical application [39].The root-mean-squared errors of prediction (RMSEPs) of the calorific value,ash,volatile,and sulfur were reduced to 0.51 MJ kg−1,1.34%,0.16%,and 0.14% after spectral intensity correction,respectively.In previous work [40],we mainly analyzed the calorific value of national standard coal samples by combining the laboratory LIBS experimental device and the commercial XRF analyzer.Through reasonable selection of stable element emission lines in LIBS and XRF spectra,the SD of coal calorific value predicted by the model is 0.72 MJ kg−1,which meets the requirements of Chinese national standard.Based on the preliminary results,this work will further verify the repeatability of XRF assisted LIBS in multi-elemental and proximate analysis of coal.
2.Experimental
2.1.Sample
A total of 25 pulverized coal samples were collected in the experiment,and the nominal values of coal quality are listed in table 2.It should be noted that the calorific value and the contents of ash,volatile,sulfur,C and H are dry basis values,while the others are the relative contents in ash.All the samples were pressed into pellets with diameter of 32 mm by 20 tons and then divided into a calibration set (20 coal samples,denoted as C1–C20) and a validation set (5 coal samples,denoted as V1–V5).The former was used to establish the prediction model of coal quality,while the latter was used to verify the quantitative performance of the model.The samples in the validation set basically cover the proximate analysis range of the calibration set,so they are well representative.Here,in order to verify the universality of the prediction model,the validation samples were selected according to the calorific values,and each sample was measured five times.
2.2.Experimental setup
The XRF assisted LIBS experimental setup for coal quality analysis is shown in figure 1,which is mainly composed of LIBS module,XRF module and sample transfer module.
In the LIBS module,the output pulse energy of the 1064 nm semiconductor pumped laser (MONTFORT Laser,M-NANO)varies linearly with the injection current,and was fixed at 60 mJ/pulse in the experiment.After passing through the attenuator and high-reflection mirror,the laser beam is expanded doubled by the beam expander,and then be focused on the pellet surface by a plane-convex lens with focal length of 100 mm to produce plasmas.The plasma fluorescence is collected by an optical fiber and then coupled into a dualchannel spectrometer (AVANTES,AvaSpec-4096CL-EVO).The spectrometer is triggered by the laser with a delay time of 2 μs.Here,the dual wavelength ranges are 195–321 nm and 496–732 nm,the spectral resolution is 0.15 nm,and the integration time is 1 ms.300 repeated spectra were collected at different positions on each sample surface to eliminate the influence of sample heterogeneity and environmental fluctuation.In order to reduce the contribution of air moisture to H line,the relative humidity of the laboratory was kept at about 30%.
In the energy dispersive XRF module,the vacuum pump was used to ensure that the atmospheric pressure in the vacuum chamber was maintained at 100 Pa.The x-ray emitted by the x-ray tube (VARIAN,VF-50J) irradiates the sample surface through a beryllium window,and the excited x-ray fluorescence is detected by the SDD (KETEK,Vico-DV H20).The current and voltage of the x-ray tube were set as 0.17 mA and 12 kV respectively,and the integration time of SDD was set to 60 s.Since the output power of x-ray tube is easily affected by temperature,the experimental environment was maintained at 300 K.
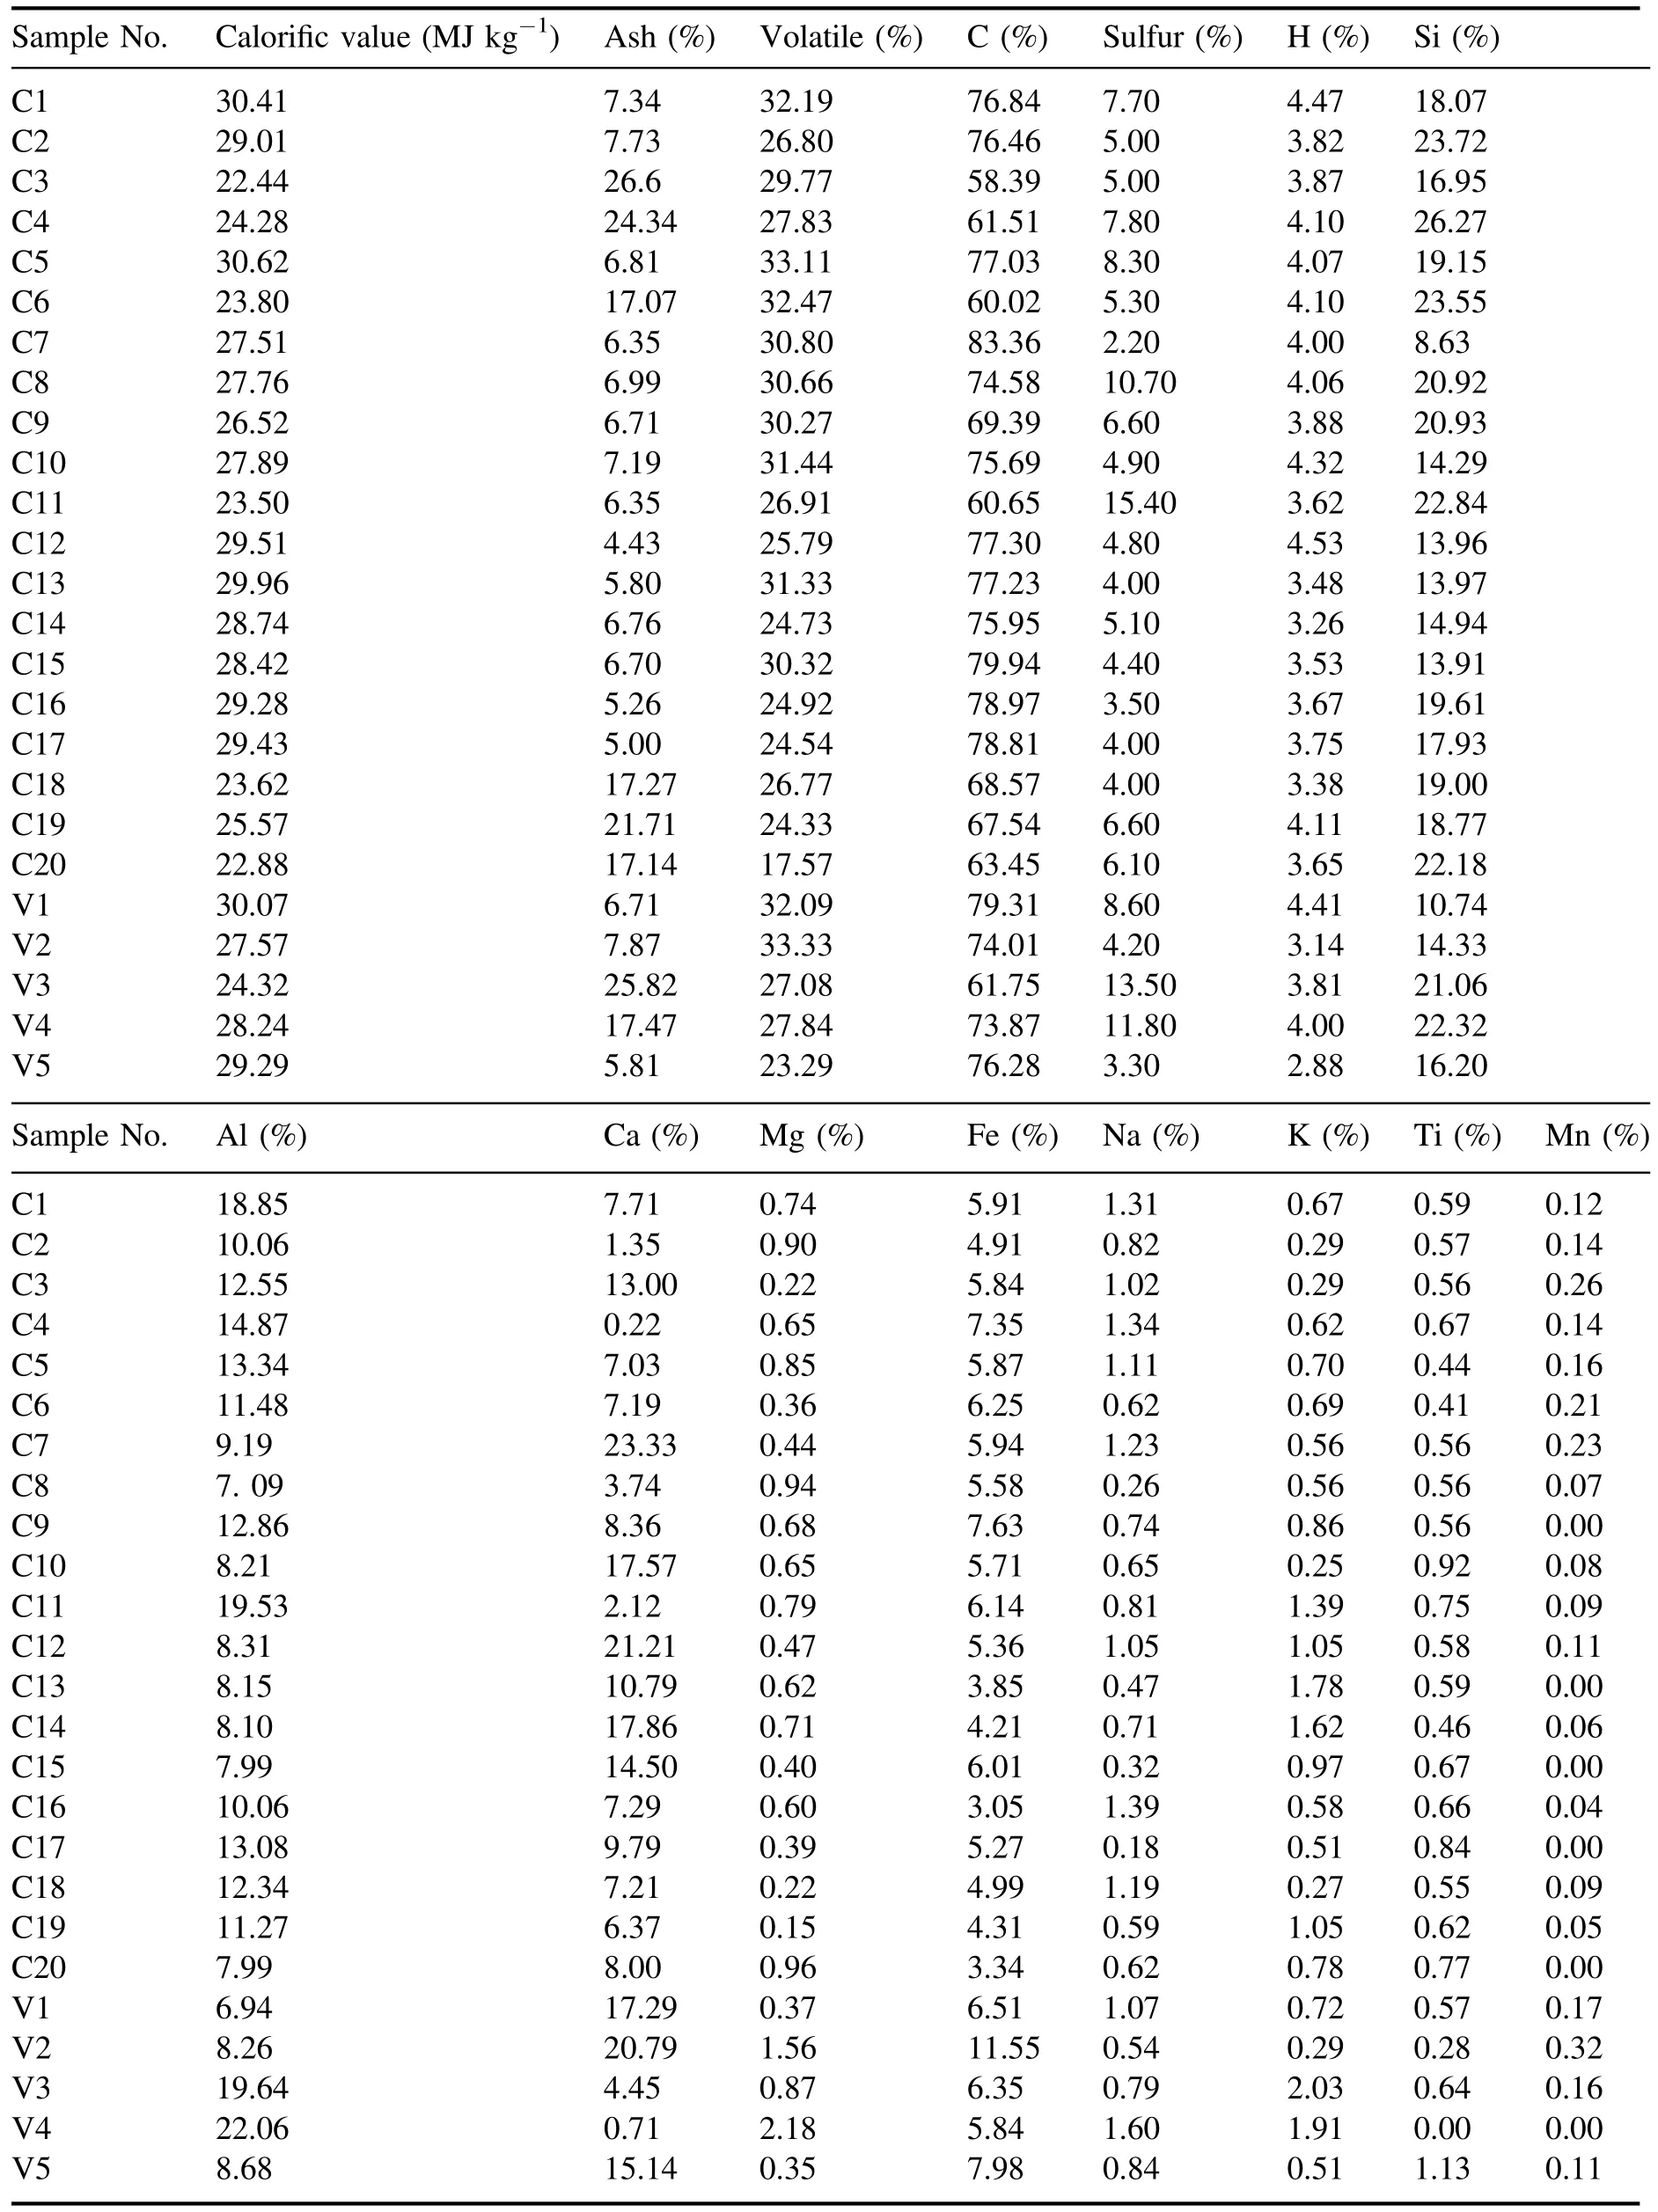
Table 2.The certified coal quality data of the calibration set and validation set.
In the sample transfer module,since XRF is nondestructive and LIBS is small-invasive,the sample is first transferred to XRF module for analysis,and then to LIBS module.
2.3.Prediction model
2.3.1.Spectral pretreatment.For LIBS spectra,we first removed the saturated spectra beyond the CCD range,then removed the worst 100 spectra according to the signal-tobackground ratio of the specific spectral lines,and the rest spectra are normalized by segments and averaged.
For XRF spectra,because they are sensitive to the external environment,especially the temperature,the spectral lines will inevitably drift.Here,there is an additional pure copper plate in the vacuum chamber of XRF module,and the intensity of the Cu line is used for spectra calibration.
2.3.2.Modeling.The selection of stable spectral lines is crucial to ensure the measurement repeatability.Here,the C,H,Na lines in LIBS spectra and the Mg,Al,Si,S,K,Ca,Ti,Mn,Fe lines in XRF spectra are selected as stable analytical lines [40].Principal component analysis (PCA) is used to reduce the dimension of the initial input variables (spectral lines of elements),so as to weaken the interference between elements.The optimal number of PCA was selected by judging the variance explained rate and cumulative variance explained rate(>90%)of each principal component,and then multivariate partial least squares are used for modeling.
For proximate analysis,the ash content mainly depends on the contents of inorganic ash-forming elements in coal,so Mg,Na,Si,K,Ti,Al,Ca,Mn and Fe lines are selected as the initial input variables of coal ash prediction model.The calorific value is positively correlated with the contents of C,H and S and negatively correlated with the ash content,so C,H,S,Mg,Na,Si,K,Ti,Al,Ca,Mn and Fe lines are selected as the initial input variables of ash prediction model.For volatile content,it is only related to the organic elements in coal,so C,H and S lines are selected as the initial input variables of volatile prediction model.For elemental analysis,the initial input variables of each element prediction model are the lines of element to be measured and other interference elements.
2.3.3.Evaluation method.The linear coefficient (R2) of the calibration curve and root mean square error (RMSE) are introduced to evaluate the measurement accuracy of the prediction model,and the SD and relative standard deviation(RSD) are used to evaluate the measurement repeatability of the prediction model for proximate analysis and elemental analysis,respectively.The closer R2is to 1,the better the linearity of calibration model is.The closer RMSE is to 0,the smaller the deviation between the predicted result and the true value is.The smaller SD and RSD represent the better measurement repeatability.
3.Results and discussion
3.1.Spectral calibration
Figure 2(a)shows a typical LIBS spectrum of coal,where the spectral lines of C,H,and Na used for modeling are marked.Before LIBS measurement,a standard deuterium-halogen lamp (AvaLight-DH-CAL) and Avaspec software were used to calibrate the absolute spectral intensity of the spectrometer.The lamp is a NIST traceable calibrated light source,which can be used to calibrate the spectrometer to enable measurements of absolute spectral intensity.Figure 2(b) shows a typical XRF spectrum of coal,from which the lines of Mg,Al,Si,S,K,Ca,Ti,Mn,Fe and Cu can be seen.Here,the Cu line was used for XRF spectrum calibration,and the rest lines were used for modeling.
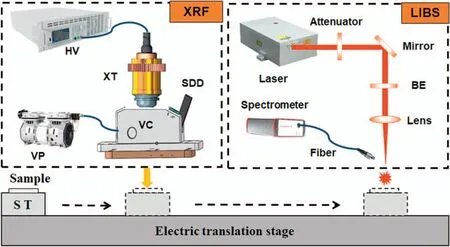
Figure 1.XRF assisted LIBS experimental setup for coal quality analysis.ST: sample table,HV: high-voltage power supply,VP: vacuum pump,XT: x-ray tube,VC: vacuum chamber,SDD: silicon drift detector,BE: beam expander.

Figure 2.Typical spectra of coal:(a)LIBS spectrum,and(b)XRF spectrum.The spectral lines used for modeling and calibration are marked.
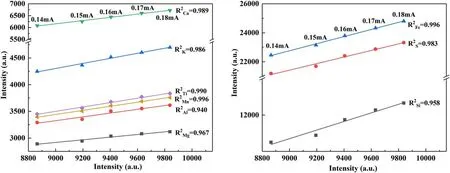
Figure 3.Relationship between the line intensities of Cu and other elements in XRF spectra at different tube currents.
In the actual long-time measurement process,due to the reduction of the service life of the x-ray tube and the change of the working temperature,the output power of the x-ray tube will be affected,resulting in the fluctuation of the spectral intensity of the x-ray fluorescence signal,that is,the x-ray spectral line will drift.The long-term signal fluctuation reduces the accuracy and efficiency of the prediction model,so it is necessary to calibrate the XRF spectrum regularly.Here,a pure copper plate was inserted into the x-ray radiation path in the vacuum chamber,so that there was an extra Cu line in the measured spectrum (there is almost no copper in coal),which could be used as a reference for calibrating other drifted lines.The relationship between the intensity of Cu line and those of Ca,K,Ti,etc in the XRF spectra of the same coal sample under different tube currents is shown in figure 3.The linear coefficients (R2) of all the curves are greater than 0.94,indicating that the Cu line is feasible for the drift calibration of XRF spectra.
3.2.Proximate analysis results
Figure 4 shows a comparison between the predicted results and certified values of proximate analysis of coal samples by XRF assisted LIBS.Compared with our previous work [40],the RMSE decreases from 0.90 to 0.53 MJ kg−1,which is attributed to the spectral calibration.The RMSE of prediction on ash content is 0.89%,which is far less than 1.7%reported in the literature[14].However,the R2of sulfur content is only 0.86,which may be due to the low sulfur content and small dynamic range in these coal samples.The linearity can be improved by adding more high-sulfur coal samples into the calibration set.Even so,the RMSE of sulfur prediction is still 0.15%.The above results show that XRF assisted LIBS is accurate in predicting coal quality.
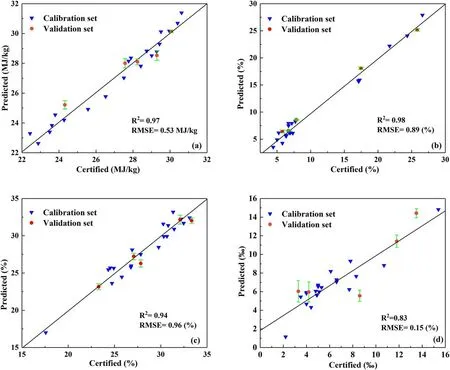
Figure 4.Calibration and prediction results of (a) calorific value,(b) ash content,(c) volatile content,and (d) sulfur content by XRF assisted LIBS.
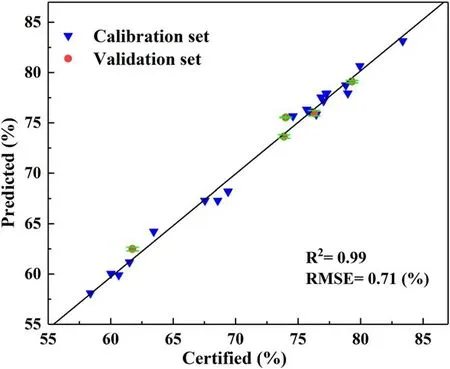
Figure 5.Calibration and prediction results of C by XRF assisted LIBS.
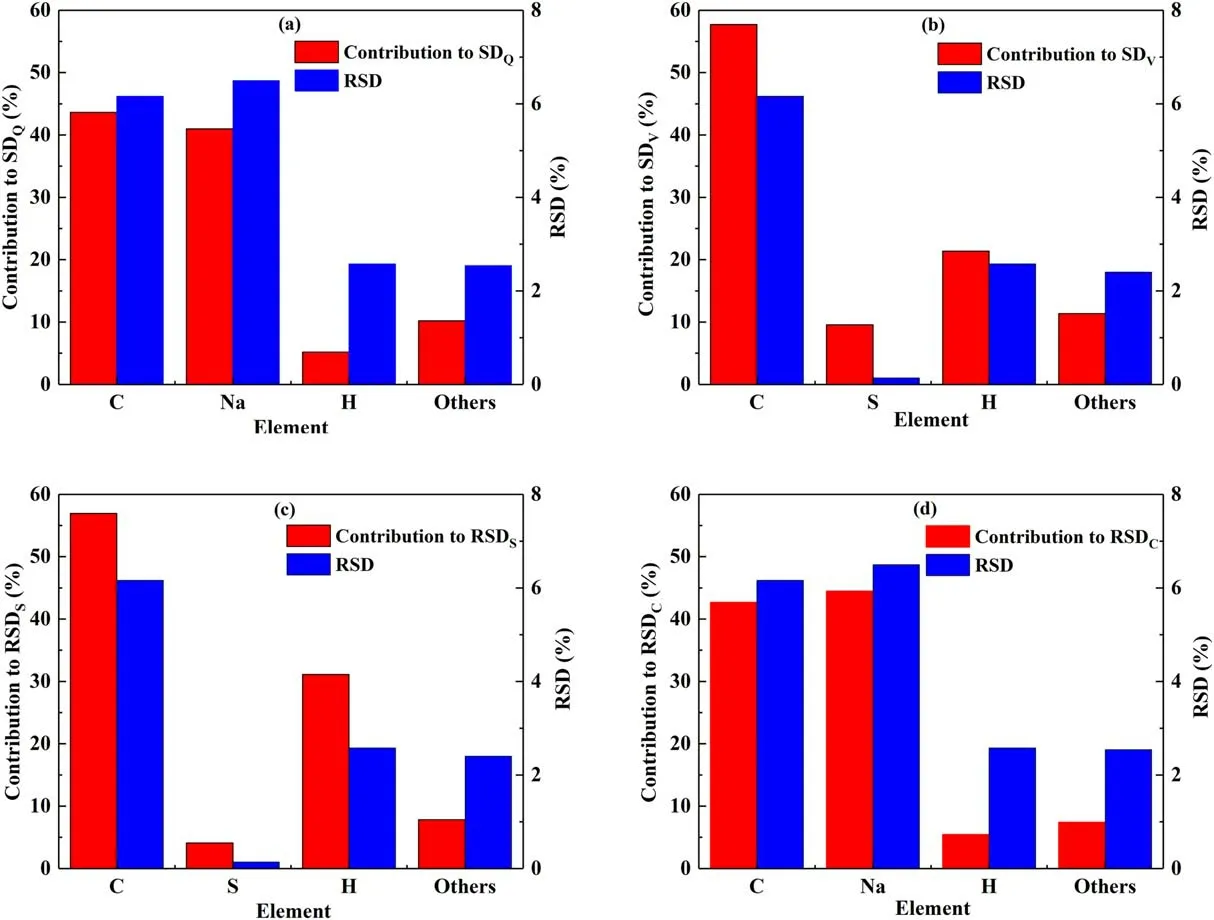
Figure 6.RSDs of the lines intensities of different elements and their contribution to SDs and RSDs of the (a) calorific value,(b) volatile content,(c) sulfur content,and (d) C element.
In table 3,the values of the error bars in figure 4 that reflect the measurement repeatability for each validation sample are listed.For comparison,the national standards of China and some results reported in other literature[17,31]are also given.It can be seen that the mean SDs of calorific value,ash content and volatile content are 0.11 MJ kg−1,0.17%and 0.41%respectively,which are lower than the requirements of national standards.Especially for ash content,the measurement repeatability is one order of magnitude better than that of the traditional single LIBS.Overall,the XRF assisted LIBS method is very stable and reliable for proximate analysis of coal.
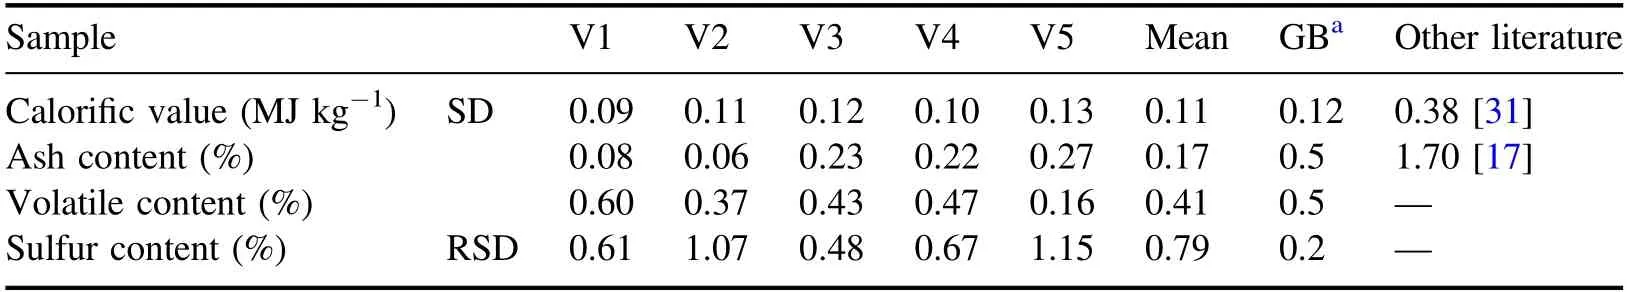
Table 3.Repeatability of proximate analysis of coal,including the SDs of calorific value,ash content,and volatile content,and the RSD of sulfur content.
3.3.Elemental analysis results
The calibration and prediction results of XRF assisted LIBS for major element C in coal are shown in figure 5.It can be seen that R2is as high as 0.99,RMSE is 0.71%,and the RSD is as low as 0.15%.The R2and RMSE for prediction of ashforming elements are listed in table 4,which shows that the R2of inorganic major elements Si,Al and Ca are all above 0.95,while those of trace elements Mn,Ti,Na,K,and Ti are smaller.It is speculated that the small content ranges of these elements lead to poor R2.Even so,the RMSEs are almost less than 2% and the RSDs are less than 4%.In addition,the RMSE and RSD of element H are 0.19% and 0.62%,respectively.These results show that the XRF assisted LIBS method has good repeatability for the determination of major elements in coal.
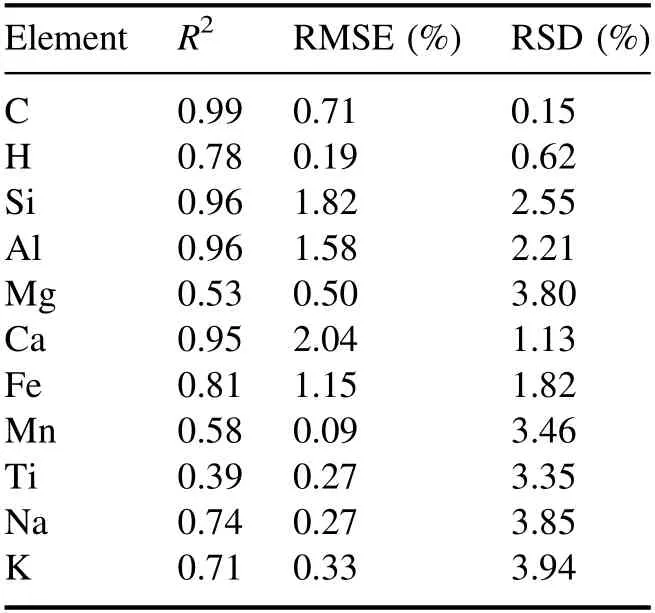
Table 4.Accuracy and repeatability of elemental analysis of coal.
3.4.Instability analysis
In order to further explore the contribution of the fluctuation of the elemental line intensity to the measurement repeatability,the source of instability was analyzed.Substituting the RSDs of line intensity of these elements into the prediction models,the results of contribution rate are shown in figure 6.The right axis is the RSD of line intensity,and the left axis is the contribution rate to the stability of the prediction results.For calorific value and element C,the RSDs of the line intensities of C and Na are larger,and the contribution to the instability is larger,reaching more than 40%.For volatile content and sulfur content,the instability mainly comes from elemental lines of C,S and H,especially C.Therefore,the key to improve the measurement repeatability is to stabilize C,Na,S,and H lines.Considering that it is difficult to further improve the stability of S lines in XRF spectra,the RSDs of C,Na and H lines should be reduced by optimizing LIBS parameters,so as to further improve the repeatability of coal quality analysis.
It should be noted that figure 5 shows the calibration and prediction results of XRF assisted LIBS for C,rather than the results measured using single LIBS.The RSD of C in table 4 is the fluctuation of carbon content,while that in figure 6 is the fluctuation of spectral line intensity.Although the fluctuation of spectral line intensity of C is relatively large,the fluctuation of C content in figure 5 is still very small due to the large slope of the calibration curve.XRF is an order of magnitude lower than LIBS for the repeatability of elemental line intensities,so the influence of C in LIBS is highlighted in the instability analysis.However,in coal quality analysis,the C line intensity is not only related to the C content in coal,but also to other elements in the coal.With the help of XRF measurement,the stable spectral line intensity of the measured elements weakens the adverse effect of C-line intensity fluctuation on the prediction results.
4.Conclusions
In view of the good stability of the determination of inorganic elements by x-ray fluorescence,a new method of rapid analysis of coal quality with XRF assisted LIBS is proposed,and the measurement accuracy and repeatability are evaluated by R2,RMSE,RSD and SD.The experimental results show that the R2of calorific value,ash content,volatiles content and major element C determined by this method are all above 0.95,and especially the mean SDs of calorific value,ash content and volatiles content are 0.11 MJ kg−1,0.17% and 0.41%,which meet the requirements of Chinese national standard.The RMSEs of elemental analysis are less than 2%,and the RSDs are less than 4%.The XRF assisted LIBS greatly improves the repeatability of LIBS for coal quality analysis,and can better meet the needs of coal blending and combustion optimization in power plants.Next,we will further develop the relevant coal quality analysis prototype and carry out industrial field test in power plant.
Acknowledgments
This work is supported by National Energy R&D Center of Petroleum Refining Technology of China(RIPP,SINOPEC);National Key Research and Development Program of China (No.2017YFA0304203);Changjiang Scholars and Innovative Research Team in University of Ministry of Education of China (No.IRT_17R70);National Natural Science Foundation of China (Nos.61975103,61875108,61775125 and 11434007);Industrial Application Innovation Project (No.627010407);Scientific and Technological Innovation Project of Shanxi Gemeng US-China Clean Energy R&D Center Co.,Ltd;111 Project (D18001);Fund for Shanxi ‘1331KSC’.
 Plasma Science and Technology2022年8期
- Plasma Science and Technology的其它文章
- Image-based plasma morphology determination and LIBS spectra correction in combustion environments
- Rapid identification of volatile organic compounds and their isomers in the atmosphere
- Fast identification of mural pigments at Mogao Grottoes using a LIBS-based spectral matching algorithm
- Aqueous ruthenium detection by microwaveassisted laser-induced breakdown spectroscopy
- Effect of lens-to-sample distance on spatial uniformity and emission spectrum of flat-top laser-induced plasma
- Quantitative analysis of the main components in ceramic raw materials based on the desktop LIBS analyzer