
Image-based plasma morphology determination and LIBS spectra correction in combustion environments
2022-09-14 08:18ShuCHAI柴树HaimengPENG彭海蒙ZiqingZHAO赵子庆andWendongWU武文栋
Plasma Science and Technology 2022年8期
Shu CHAI (柴树),Haimeng PENG (彭海蒙),Ziqing ZHAO (赵子庆) and Wendong WU (武文栋),2,∗
1 Institute of Thermal Energy Engineering,School of Mechanical Engineering,Shanghai Jiao Tong University,Shanghai 200240,People’s Republic of China
2 Interdisciplinary Research Center for Engineering Science,School of Mechanical Engineering,Shanghai Jiao Tong University,Shanghai 200240,People’s Republic of China
Abstract Spectra correction is essential for the quantification of laser-induced breakdown spectroscopy(LIBS) due to the uncertainties in plasma morphology.In this work,we determined the plasma morphology using a charge-coupled device camera and introduced the spectral correction method based on plasma images to a combustion environment.The plasma length,width,volume,and location were extracted from the plasma images.Using a back-scattering setup,the contribution of plasma location fluctuation to the total spectral fluctuation was mitigated.The integral intensity of the plasma image was used as a proxy of the total number density to correct the spectra.Linear relationships were established between the integral intensities of the plasma images and the spectral intensities,under different laser energy levels and gas temperatures.The image-based correction method could significantly reduce the fluctuation of raw spectral intensities when the laser energy was below 240 mJ.Compared with the correction method based on total spectral areas,the proposed method offered significant improvements in the low energy region,which promises to reduce the signal fluctuations in combustion environments while preserving the spatial resolution and mitigating the flow disturbance.
Keywords: LIBS,plasma image,spectra correction,combustion
1.Introduction
Laser-induced breakdown spectroscopy(LIBS)is a promising tool for the determination of elemental components in harsh environments,because of the robustness of its setup,the simplicity of sample preparation,and the capability of simultaneously measuring multiple elements.The successful in situ applications of LIBS include environmental monitoring,space exploration,industrial process diagnosis,and oceanic research[1–4].In combustion studies,LIBS has been used for element tracing [5–7]and equivalence ratio measurement[8–11]in a good range of environments including in different fuel systems(liquefied petroleum gas[12],biodiesel[13]),in particle-laden reacting flows [14],in pressurized systems [15]and in turbulent flames [16].
The quantitative measurement of important elements in fuel and oxidizer is crucial for extracting combustion characteristics.For example,the intensity of the nitrogen line at 500.5 nm has been used to measure the flame temperature under the ideal gas assumption [17].Fuel concentration can be obtained by directly matching the line profiles of hydrogen and oxygen to an established spectra database under known conditions[18].The sodium lines at 588.995 nm and 589.592 nm,and the potassium line at 766.490 nm,have been utilized to study the release dynamics during coal combustion [19].However,as the sampling and excitation processes are strongly coupled in LIBS,the laser-matter interactions are rather complicated,and the latter laser-plasma,plasmaatmosphere interactions will further increase the complexity.Thus,LIBS signals can suffer from large uncertainties originated from different mechanisms,compromising the precision and accuracy of quantitative analysis.This problem was regarded as one of the main obstacles in the future development of the LIBS technique [20].In a high temperature environment,the reduced gas density influences the energy coupling efficiency through collision frequency,which requires more energy to initiate the plasma.On one hand,the energy deposition behavior,described by quantities including breakdown threshold [21],breakdown delay [22],acoustic energy [9,23],and deposited energy [24],can be used for simultaneous temperature measurement.On the other hand,the uncertainties in the time required to initiate the plasma will convolve with the temporal structure of the laser pulse,leading to nonnegligible uncertainties in the deposited energy.The deposited energy influences the LIBS spectra in a nonlinear manner,which can further compromise the element composition measurement.Thus,the spectra correction is essential for the quantification of LIBS in the combustion environment.
Many different approaches have been proposed to correct the fluctuations in the LIBS signal.It has been common to average spectra over successive tens or hundreds of shots[25–27].However,additional errors may be introduced because the spectral line intensity has a nonlinear dependency on plasma temperature and electron density.Moreover,averaging spectra is not feasible when the properties of samples are time dependent.Thus,various quantities,such as the whole spectral area [28],the background emission [29],the internal standard[30],the acoustic signal[31],and plasma temperature and electron density [32,33],have been utilized to correct the spectra on a shot-to-shot basis.
The origin of signal fluctuations has been systematically explored in the condensed phase.It was suggested that the variation in plasma morphology plays a key role in the fluctuations during the later stage of plasma cooling [20,34].Plasma morphology can be conveniently retrieved from plasma images [35–38],then the morphological information can be employed to correct the spectra.Ni et al [39]utilized the integral intensities of images to correct the spectral intensities in slag samples.Using the relationship between sampling heights and plasma images,Zhang et al [40,41]reduced the signal fluctuation significantly in steel samples.Li et al [42]also found that the spectral intensities are linearly correlated to the peak intensity and the sum intensity of images in bulk water;such a relationship can be used to improve the performance underwater.However,to the best of the authors’ knowledge,the quantitative analysis of plasma morphology and the spectral correction based on such information has not been reported in the combustion environment.
In this work,we have introduced the image-based plasma morphology determination method to LIBS measurement in combustion environments.The plasma length,width,volume,and location were extracted from the images,then the total number density was estimated from the integral intensity of the plasma image.The relationship between the integral intensity of the plasma image and the atomic line intensity were investigated under different energies and temperatures.The contribution of changing plasma location to the spectra was also evaluated.Based on estimated total number density,the LIBS spectra were corrected and benchmarked with the correction method using the total spectral area.
2.Experimental setup
The experimental setup is schematically shown in figure 1.The measurement was performed in the after-burn gas of a Mckenna burner,which held a premixed methane/air laminar flame under atmospheric pressure.The burner was composed of 60 mm diameter sintered porous brass on the muzzle and was water cooled.Synthetic air (79% N2,21% O2) and pure methane(>99.99%) were regulated by precalibrated mass-flow controllers (Alicat Scientific).The burner was operated under stoichiometric conditions,and the downstream gas temperature can be adjusted by changing the total flow rate of methane and air.The measurements were performed under two temperatures,1200 K and 1600 K.A type-B thermocouple with 50 μm lead wires and an 80 μm bead was set up adjacent to the laserinduced plasma to continuously monitor the gas temperature.
The 532 nm laser beam with 6 ns duration and 0.5 mrad divergence was generated by a Nd:YAG laser (Quantel Q-smart 850).The sampled laser beam was monitored shot-toshot by a pyroelectric energy meter (Ophir PE25BF-DIF-C),and the fluctuation of laser energy was within 3%.The laser energy was adjusted from 80 to 280 mJ using an attenuator.To avoid the disturbance of flow caused by the preceding shot,the laser was operated at 2 Hz.The laser beam was focused by a one-inch UV fused silica plano-convex (f=200 mm),to generate plasmas at 15 mm above the burner surface.After inducing the plasmas,the residual energy of the laser beam was measured by another pyroelectric energy meter(Ophir PE50BF-DIFH-C).Using a back-scattering setup,the radiation of plasmas was directed to a fiber-coupled compact spectrometer (Avantes ULS2048XL 1200 lines/mm grating).The spectrometer was operated with 0.5 μs delay time and 2 μs gate width in this study for optimal absolute signal intensities and signal background ratios (SBR).To monitor its morphology,the plasma was imaged laterally by a 1-inch bi-convex lens(f=125 mm)on a charge-coupled device(CCD)camera(Ophir LT665).The 1: 1 magnification ratio yielded a spatial resolution of 4.54 μm for the plasma image.The CCD camera was triggered 100 μs earlier than the Q-switch due to its long shutter duration(≈31 μs)and 10 ms gate time,which covered the entire lifetime of plasmas.The background from flame chemiluminescence was subtracted from the raw image.The laser,spectrometer,energy meters and CCD camera were synchronized by a digital delay generator (Stanford Research System DG645).
3.Results and discussion
3.1.The LIBS spectra under different temperatures and energy levels
A typical single-shot spectrum within a range of 620–800 nm was plotted in figure 2(a).The baseline was fitted and subtracted automatically using the method proposed by Sun et al[43].The atomic and ionic lines were identified using the NIST database.Adjacent to the strong hydrogen line from the Balmer series in 656 nm,the singly ionized nitrogen lines in 648 nm and 661 nm can be distinguished.Three closely positioned atomic lines of nitrogen can be found in 742 nm,744 nm and 746 nm,and the N 746 nm line was the strongest of the three.The oxygen peak centered around 777 nm can also be easily identified.This triplet was composed of oxygen lines in 777.19 nm,777.42 nm,and 777.54 nm,which could not be clearly separated spectroscopically under our 0.13 nm spectral resolution.The atomic carbon line in 711 nm and the broad CN molecular emissions from several vibrational transitions were relatively weak.For the gas density we investigated,the selfabsorption effect was not pronounced.The H 656 nm,O 777 nm,and N 746 nm lines were fitted by the Lorentzian function for further elemental analysis,and the area under Lorentzian profiles was used as the spectral intensity.The N II lines in 648 nm and 661 nm can be decoupled from H 656 nm using Lorentzian fitting as shown in figure 2(b).
In figure 3,the spectral intensities of atomic lines are plotted against the incident laser energy under two different temperatures,1200 K and 1600 K.We monitored the breakdown on a shot-to-shot basis by a microphone.The N waveform in the acoustic signal is easy to identify when the breakdown happens.The breakdown threshold,which is defined as the laser energy where 50%of all laser pulses will induce a plasma,was 46.8 mJ and 52.1 mJ respectively for 1200 K and 1600 K,under our current optical setup.When the laser energy was below 80 mJ,the intensities of lines were quite weak.Thus,the results were reported within the range of 80–280 mJ.The spectral intensities of all the lines increased monotonically with the laser energy.Two important features should be noted.Firstly,under the same laser energy,the spectral line intensities decreased with a temperature increase.It is caused by the reduced gas density,which deteriorates the energy deposition.Thus,in an environment where the temperature dynamically varies,the temperature effect should be corrected if the accuracy is demanded.Secondly,even when the gas temperature and laser energy were kept as constants,the standard deviation of line intensity,which was represented by the error bar in figure 3,is still pronounced.Such fluctuation in signal can reduce the precision and limit the temporal resolution of the measurement.
3.2.The determination of plasma morphology using images
The plasmas images under different laser energies for a temperature of 1200 K were shown in figure 4.We adjusted the neutral density filters before the CCD camera under different laser energy levels,to ensure the CCD-captured plasma images have comparable brightness.Then each image was normalized by its maximum pixel intensity,laser-propagated from the left side of the images to the right.The plasmas were unsymmetric and inhomogeneous,as evidenced by the acornlike shape and the hot core.The plasmas formed spatially in front of the focal point.As the laser energy increased,the plasma core moved further towards the incident direction of the laser.This behavior is a result of the temporal structure of the laser pulse and the laser supported wave.When the laser energy is sufficiently strong,laser-supported radiation (LSR)governs plasma evolution.In this case,the continuous radiation from the early plasma will heat and ionize the surrounding gas,mainly by its ultraviolet component.The heated gas became opaque to the trailing incident laser.Then the trailed edge of the laser pulse was absorbed at the plasma front from the incident direction,leading to the unsymmetric evolution of plasma.As shown in figure 4,the growth of plasma size along the laser direction was much less than that opposed to the laser direction,which led to an even more unsymmetric shape under higher energy levels.The radial expansion under increased laser energy was also to a lesser extent than the axial expansion.Consequently,the plasma had a very prolonged shape under 280 mJ.It was suggested that the spherical aberration of the focusing lens will lead to multiple subfocal points,and such a phenomenon has been reported in an atmospheric environment [44,45]as well as under reduced pressure [46,47].However,within the energy range of interest,no discrete structure with more than one separated plasma core can be observed in figure 4.
To analyze the plasma morphology quantitatively,we arbitrarily defined the positions where the pixel intensities were five times higher than the background as the boundary of the plasma.The length and width of the plasma can then be retrieved from the plasma images.Their trends corresponding to different laser energies were plotted in figures 5(a) and (b).The plasma length,which is the spatial dimension along the laser propagation direction,increased from 3 mm under 80 mJ to 5.8 mm under 280 mJ,while the plasma width increased from 1.0 to 1.6 mm.As a consequence,the plasma has a larger volume.Assuming that the plasma was axially symmetric,the plasma volume under different laser energies can be calculated(figure 5(c)).Under a temperature of 1200 K,the plasma expanded from 1.7 mm3under 80 mJ to 9.8 mm3under 280 mJ,a 5.8 times increase in volume compared with the 3.5 times in incident laser energy.Under a temperature of 1600 K,the plasma expanded from 1.0 mm3under 80 mJ to 12.6 mm3under 280 mJ,a 12.6 times increase in volume.The gas densities for 1200 K and 1600 K under atmospheric pressure are equivalent to the gas densities for 0.185 atm and 0.146 atm at room temperature;thus,the literature for under reduced pressure can serve as a benchmark.The plasma sizes we measured agreed with the reported values in the work of Glumac and Elliott [46],where a focal length of 270 mm was used.It should be noted that when the laser energies were lower than 180 mJ[figures 5(a)–(c)],the plasma was larger under 1200 K,while under even higher energy,the plasma size for 1600 K was larger.This is the first time such a phenomenon has been observed and it can be reproduced consistently.A speculation on the mechanism behind this phenomenon is that,when the flame temperature is lower,a denser gas environment favors the energy absorption.The size of plasma was dominated by the deposited energy when the laser was weak.When the laser energy was high,the differences in absorbed energy under different temperatures became a secondary effect,a smaller plasma was generated under lower temperature due to the greater confinement effect which limited the plasma expansion.
Other than the change of plasma morphology corresponding to the laser energy and flame temperature,the uncertainties in plasma morphology under the same laser energy and flame temperature are also of interest to us.The relative standard deviations of morphological parameters were represented by the error bars in figure 5.The uncertainties in plasma location were rather consistent for all energy levels and temperatures.As the laser energy increased,the fluctuations in plasma length and width decreased for both temperatures.This can be attributed to the reduced variation in energy deposition with laser energy.Moreover,when the laser energy is low,the fluctuations in plasma length and width for both 1200 K and 1600 K were comparable.But for higher energy levels,the fluctuations under 1600 K were significantly stronger than those under 1200 K,which was attributed to the weaker confinement effect under 1600 K.Thus,the uncertainties in plasma morphology can be significant even under the same temperature and laser energy.It should be corrected,especially under higher temperature and lower laser energy levels.
In a gaseous environment,plasma location can sometimes vary significantly.The variation of plasma location changes the collection solid angle,which further contributes to the total fluctuation of signal.Taking the location of the brightest pixel as the plasma location and using the focal point as a reference,the change in plasma location and its contribution to the total fluctuation can be quantitatively evaluated.The location of the focal point was determined by the following approach.When the laser energy is near the breakdown threshold,fairly weak and small plasma will appear at focal point [44].We adjusted the laser energy until it just led to breakdown,and the location of this faint plasma was registered as the focal point and can be used as a reference.The determined focal point was indicated by a white circle in figure 4.Figure 6 schematically showed the influence of plasma location variation on the collection solid angle for a back-scattering optical setup,whereLandrare the back focal length and radius of the focus lens,which were 198.7 mm and 12.7 mm,respectively.Ois the focal point.O′ is the plasma location,the value of which was the distancel.
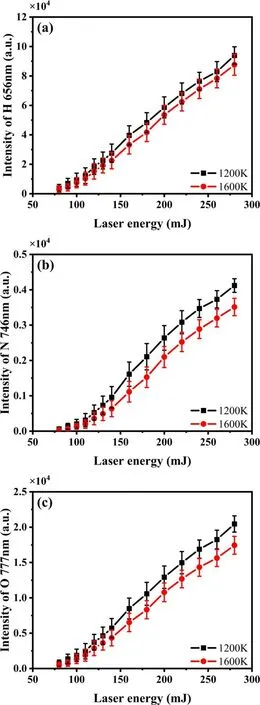
Figure 3.Spectral intensities of H 656 nm(a),N 746 nm(b),and O 777 nm (c) under laser energy of 80–280 mJ.
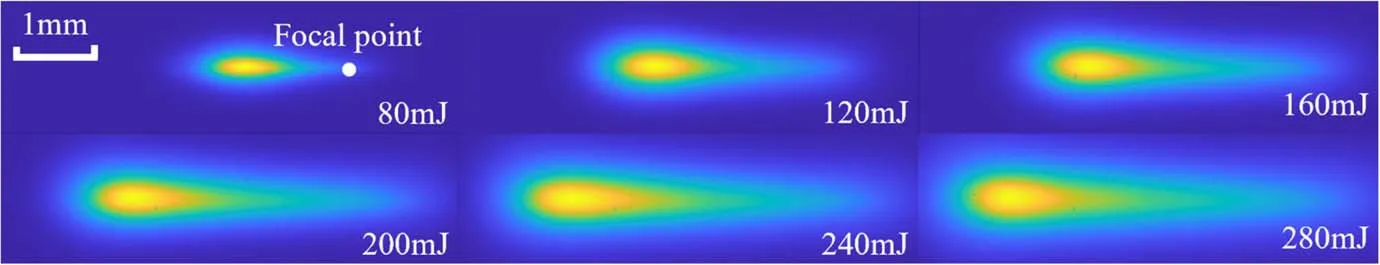
Figure 4.Maximum intensity normalized plasma images (1200 × 350 pixels) under different laser energies and a temperature of 1200 K.Laser propagated from the left side.The spatial position of the focal point is marked with a white circle.

Figure 5.Plasma morphological parameters:the length(a),width(b),volume(c),and the plasma location with respect to the focal point(d).
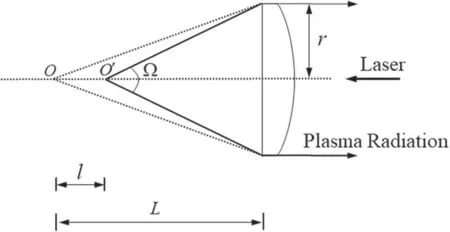
Figure 6.The relationship between the plasma location,the focal point,and the solid angle.
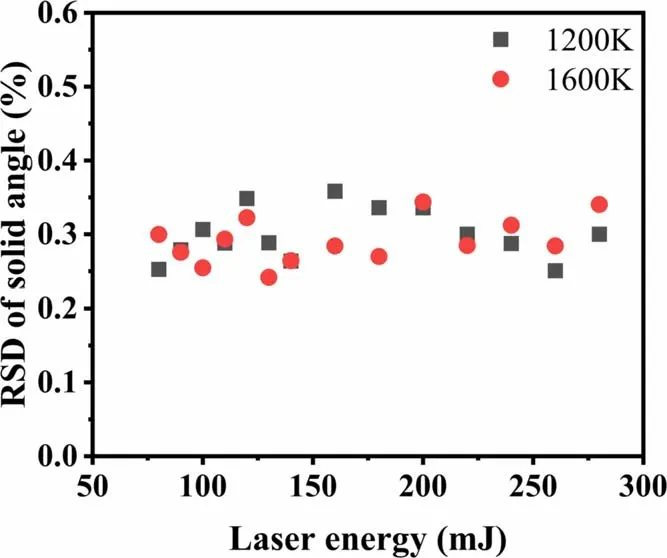
Figure 7.RSD of solid angle under different laser energies.
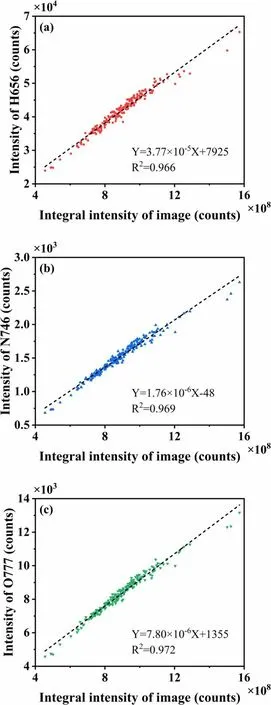
Figure 8.Relationship between the spectral intensity and the integral intensity of images under 180 mJ and 1600 K.Dashed lines were linear fitting.
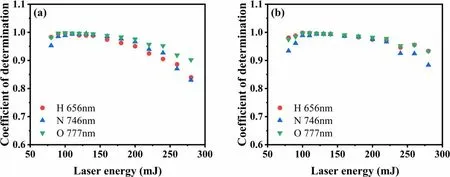
Figure 9.Linear coefficients of determination (R2) between the spectral intensities and the integral intensity of plasma images.
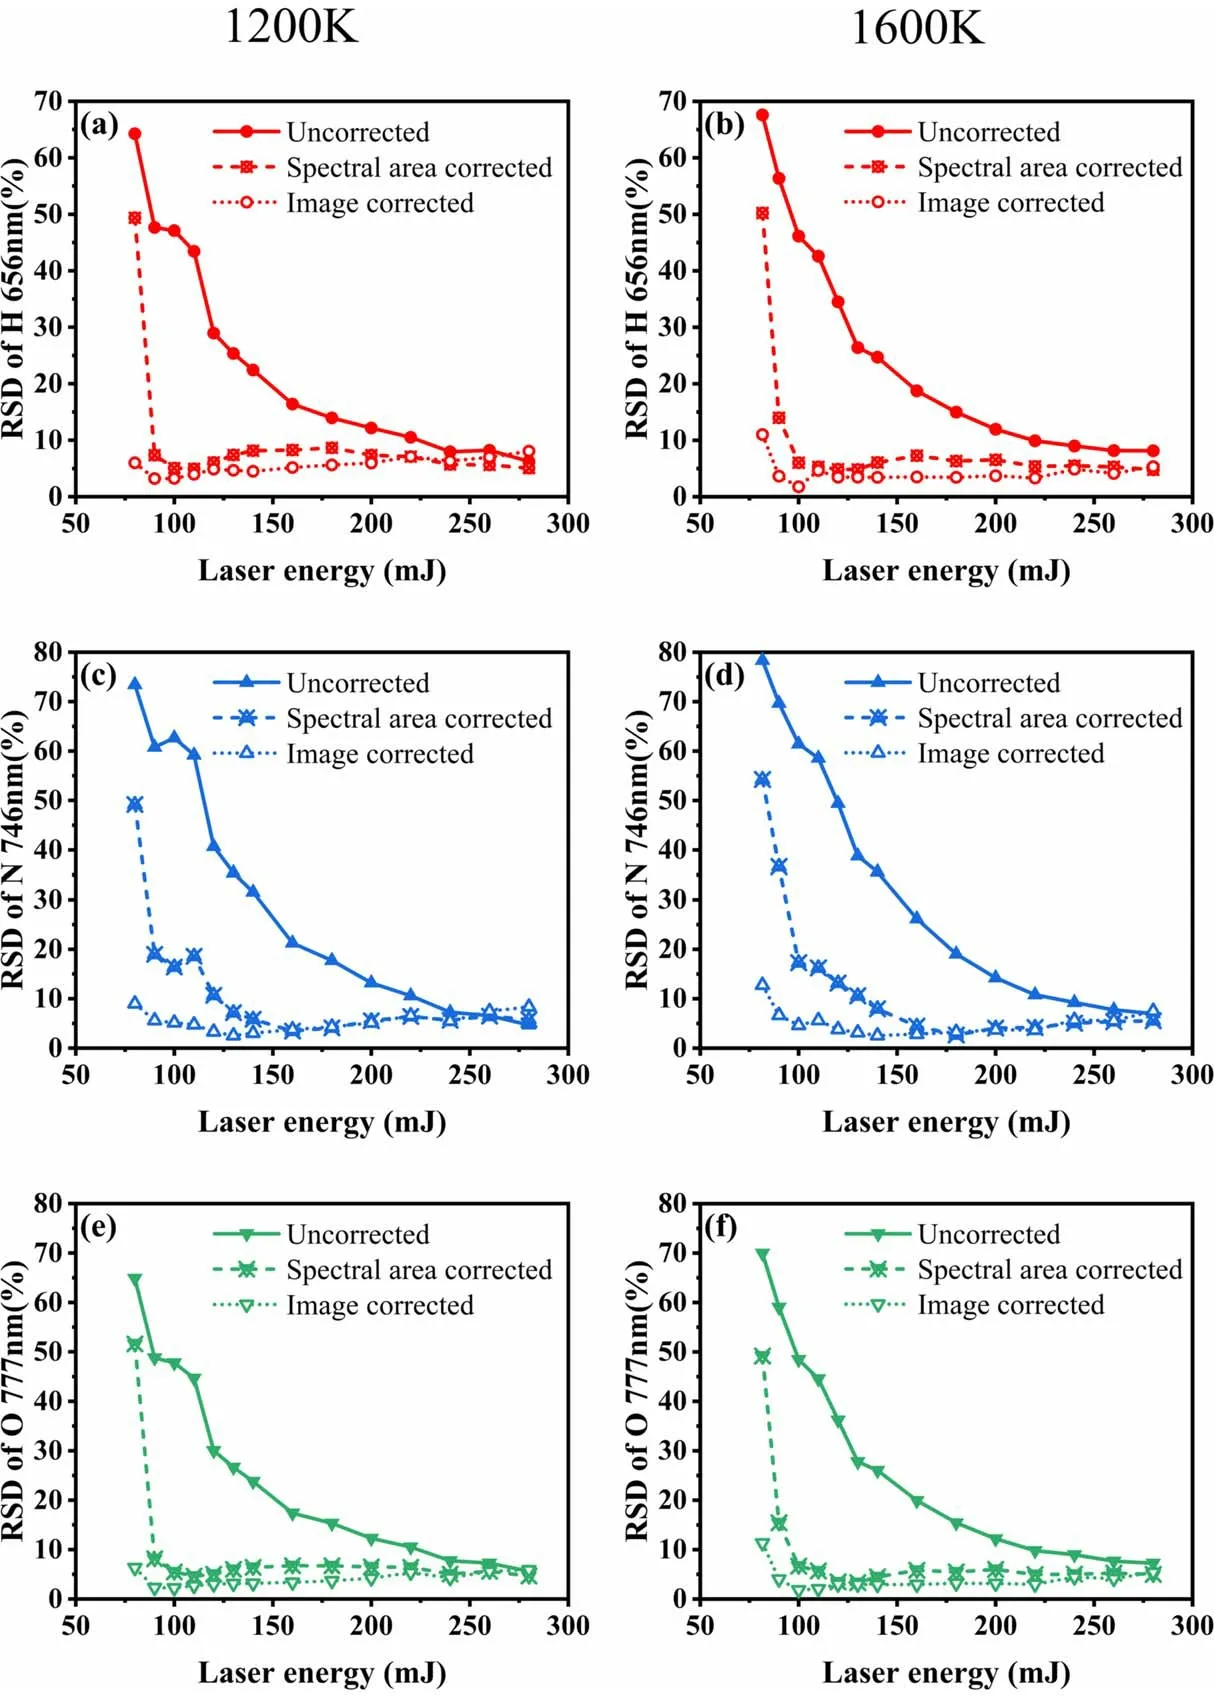
Figure 10.Comparison of the uncorrected signal,the total spectral area corrected,and the plasma image corrected line intensities of H,N,and O.
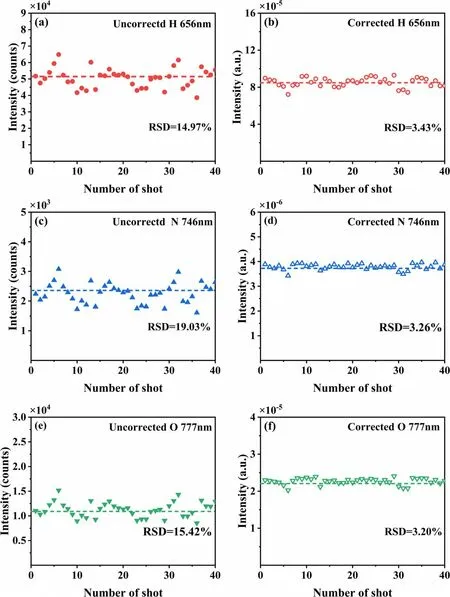
Figure 11.Shot-to-shot analysis of uncorrected signal and the plasma image corrected line intensities of H,N,and O under 180 mJ and 1600 K.
When the laser energy increased from 80 to 200 mJ,the plasma location changed from 1.2 to 2.6 mm,a shift of 1.4 mm (figure 5(d)).Ω,the collection solid angle,can be calculated by equation (1)
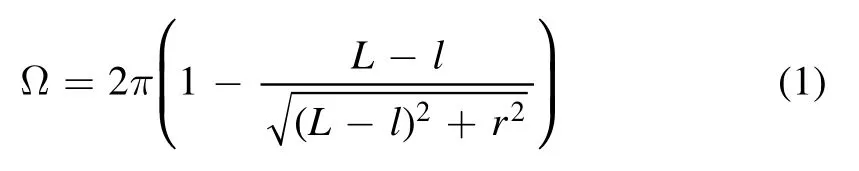
Corresponding to the uncertainty in plasma location,the relative standard deviation (RSD) in collection solid angle was only up to 0.36% under 1200 K and 0.34% under 1600 K,as shown in figure 7.When the energy increased from 80 to 280 mJ,the 1.4 mm shift in plasma location can introduce a 2.68%increase in solid angle.Thus,using a backscattering setup,the contribution of the plasma location to the total spectral fluctuation was quite negligible,but should be considered when a large variation in gas temperature and laser energy is experienced.
3.3.Spectra correction using plasma images
Various types of information can also be extracted from the images,such as peak intensity,integral intensity,area [39],and flatness[42].Among them,integral intensity,which is the summation of the brightness of all pixels belonging to a plasma,has a direct relationship with the spectral intensities,since both are proportional to the total number density of plasma.Such a relationship has been used for spectra correction in solid samples [48].The linearity between the spectral intensity and the integral intensity of the plasma image has to be evaluated before the correction method can be employed.In this work,the spectra and images were collected on a shot-to-shot basis over a laser energy of 80–280 mJ.The integral intensity of the image was calculated.The linear fittings were performed for a total of 200 shots under each laser energy level.The result under 180 mJ and 1600 K was shown in figure 8 as an example.A strong linear relationship existed with a coefficient of determination(R2)higher than 0.96.The R2corresponding to different incident energy and gas temperature was shown in figure 9.R2were close to unity in the region of 90–150 mJ,suggesting a reliable linear relationship.Then,R2decreased as the laser energy increased.When laser energy was above 220 mJ,R2was between 0.8 and 0.9.The decrease in R2with laser energy can be attributed to the expansion of plasma size.In this work,the optical arrangement yielded a 1:1 magnification ratio,projecting the plasma image on the 1 mm diameter fiber entrance.When the laser energy increased,the plasma expanded significantly,and the outer region of the plasma could not be collected by the fiber effectively.This effect is less pronounced under lower energy levels because the majority of emissions were effectively collected.However,under higher energy levels,it can lead to significantly reduced R2.Moreover,it should be noted that the gate widths of the camera and spectrometer are different.The spectral signals were collected from 500–2500 ns after the initiation of plasma,while the CCD captured the plasma over its entire lifetime.Such a difference can also compromise the agreement between the spectral intensity and the integral intensity.Nevertheless,a satisfactory agreement was achieved in the region of 90–150 mJ,and over the entire energy region,there was a clear linear relationship,but caution should be taken when the plasma size is expanded significantly.
Based on established correlations,the original spectral intensities can be corrected by the integral intensities of the plasma image to reduce the measurement uncertainties under a specific laser energy.To evaluate the spectra correction method based on plasma images,we benchmarked it with the correction method based on total spectral areas,which is a popular approach to partially compensate the signal fluctuation due to laser energy variation,delay time,and gate delay [33].The RSD for the uncorrected spectral intensities,the total spectral area corrected,and the plasma image corrected line intensities are shown in figure 10,for 1200 K and 1600 K respectively.In general,the RSD for uncorrected line intensities can be quite large under low energy,reaching 60–70%when the plasma is weak.Both the total spectral area and the plasma image correction methods reduced the RSD significantly.The correction method based on plasma images generally performed better under low energy.For example,when laser energy was 80 mJ,the RSD for the uncorrected signal could be more than 70%,the total spectral area correction method reduced the RSD to around 50%,while the image-based correction method performed much better,yielding an RSD of less than 10%.The RSD for uncorrected line intensities decreased with larger laser energy,being less than 10%when the laser energy was above 240 mJ,in which case,comparable with the RSD using the spectra correction methods.Using an optical fiber with a larger core size or a smaller magnification ratio can improve the performance of this technique in the high energy region.However,a large laser energy is not always desirable in combustion diagnostics.The large plasma size under high energy levels can result in deteriorated spatial resolutions,which limits the application of LIBS in characterizing the fine structure of the reacting zone.A large amount of deposited energy can also potentially disturb the flow field.Another downside is the extra cost associated with a high output laser.The proposed image-based correction method is capable of reducing the signal fluctuation when a lower laser energy is favored,improving the quantification performance while preserving the spatial resolution and mitigating the flow disturbance.In figure 11,the uncorrected and the plasma image corrected line intensities of H,N,and O were analyzed on a shot-to-shot basis,under 180 mJ and 1600 K.It is shown that the shot-toshot fluctuations in line intensity were clearly reduced,demonstrating the usefulness of this method.
4.Conclusions
In this work,we have determined the plasma morphology using a CCD camera,and introduced the spectral correction method based on plasma images to LIBS measurement in a combustion environment.The plasmas were unsymmetric and inhomogeneous,prolonged and shifted towards the focal lens with higher laser energy.Using a back-scattering setup,the contribution of the plasma location to the total spectral fluctuation was mitigated but should be considered when a large variation in gas temperature and laser energy is experienced.The dimensions and volume of the plasma were determined from the images.The integral intensity of the plasma image was used as a proxy of the total number density.A clear linear relationship was established between the integral intensity of the plasma image and the spectral intensities.The correction method based on the plasma images can significantly reduce the fluctuation of line intensities,especially under lower laser energy levels.Compared to the correction method based on total spectral areas,this correction method performed better when the laser energy was below 240 mJ and offered its major benefits in the low energy region.The proposed imagebased correction method is capable of reducing the signal fluctuation in the combustion environment while preserving the spatial resolution and mitigating the flow disturbance.
Acknowledgments
This work was supported by National Natural Science Foundation of China (No.51906149),the Natural Science Foundation of Shanghai (Nos.20ZR1428500,21DZ1205300),and the Oceanic Interdisciplinary Program of Shanghai Jiao Tong University (No.SL2020ZD202).
 Plasma Science and Technology2022年8期
- Plasma Science and Technology的其它文章
- Rapid identification of volatile organic compounds and their isomers in the atmosphere
- Fast identification of mural pigments at Mogao Grottoes using a LIBS-based spectral matching algorithm
- Aqueous ruthenium detection by microwaveassisted laser-induced breakdown spectroscopy
- Effect of lens-to-sample distance on spatial uniformity and emission spectrum of flat-top laser-induced plasma
- Quantitative analysis of the main components in ceramic raw materials based on the desktop LIBS analyzer
- Elemental and proximate analysis of coal by x-ray fluorescence assisted laser-induced breakdown spectroscopy