
Effect of lens-to-sample distance on spatial uniformity and emission spectrum of flat-top laser-induced plasma
2022-09-14 08:18HongboFU付洪波HuadongWANG王华东MengyangZHANG张梦阳BianWU吴边andZhirongZHANG张志荣
Plasma Science and Technology 2022年8期
关键词:华东
Hongbo FU (付洪波),Huadong WANG (王华东),Mengyang ZHANG (张梦阳),2,Bian WU (吴边) and Zhirong ZHANG (张志荣),2,3,4,∗
1 Anhui Provincial Key Laboratory of Photonic Devices and Materials,Anhui Institute of Optics and Fine Mechanics,Hefei Institutes of Physical Sciences,Chinese Academy of Sciences,Hefei 230031,People’s Republic of China
2 University of Science and Technology of China,Hefei 230026,People’s Republic of China
3 Key Lab of Environmental Optics &Technology,Anhui Institute of Optics and Fine Mechanics,Hefei Institutes of Physical Sciences,Chinese Academy of Sciences,Hefei 230031,People’s Republic of China
4 Advanced Laser Technology Laboratory of Anhui Province,Hefei 230037,People’s Republic of China
Abstract The optimal spectral excitation and acquisition scheme is explored by studying the effect of the lensto-sample distance (LTSD) on the spatial homogeneity and emission spectra of flat-top laser converging spot induced plasma.The energy distribution characteristics before and after the convergence of the laser beam with quasi flat-top intensity profile used in this study are theoretically simulated and experimentally measured.For an aspheric converging mirror with a focal length of 100 mm,the LTSD(106 mm ≥ LTSD ≥ 96 mm)was changed by raising the stainless-steel sample height.The plasma images acquired by ICCD show that there is air breakdown when the sample is below the focal point,and a ring-like plasma is produced when the sample is above the focal point.When the sample is located near the focal point,the plasma shape resembles a hemisphere.Since the spectral acquisition region is confined to the plasma core and the image contains all the optical information of the plasma,it has a lower relative standard deviation (RSD) than the spectral lines.When the sample surface is slightly higher than the focal plane of the lens,the converging spot has a quasi flat-top distribution,the spatial distribution of the plasma is more uniform,and the spectral signal is more stable.Simultaneously,there is little difference between the RSD of the plasma image and the laser energy.In order to further improve the stability of the spectral signal,it is necessary to expand the spectral acquisition area.
Keywords: laser-induced plasma,lens-to-sample distance,plasma image,RSD,laser-induced breakdown spectroscopy
1.Introduction
Laser-induced breakdown spectroscopy (LIBS) is a typical atomic emission spectroscopy technique that forms plasma by converging pulsed lasers to the sample surface and then analyzes the plasma emission spectrum to determine the sample’s element composition and content.Because LIBS uses a pulsed laser as an excitation source,it has many advantages over traditional analysis methods: simultaneous excitation and detection of multiple elements;remote noncontact telemetry,fast analysis speed,and in situ and online detection can be realized;and laser ablation can analyze the sample at different depths.Based on this point,LIBS is widely used in many fields,including geological minerals[1],Mars exploration [2],environmental monitoring [3],organic compounds [4],aerosol analysis [5],nuclear fusion materials[6],industrial materials [7],etc.However,the temporal and spatial heterogeneity of laser-induced plasma leads to poor repeatability of the LIBS signal and low accuracy of quantitative analysis.This seriously restricts the commercialization and industrial application of LIBS technology.
To solve the above problems,numerous researchers have proposed many methods to improve the repeatability of LIBS.These methods mainly include two aspects: spectral pretreatment and experimental setup.In terms of spectral pretreatment,some physical parameters that can reflect the fluctuation and change of plasma in real-time are used for spectral standardization or normalization of samples to be analyzed.These physical parameters include the acoustic signal generated when the laser interacts with the sample[8],plasma-related parameters (temperature or electron number density) [9],plasma image [10],background [11],integral intensity of full spectrum or partial spectrum [12],etc.By changing the experimental parameters,researchers attempt to obtain a more stable plasma emission spectrum.It mainly includes the effects of laser pulse energy [13,14],energy distribution[15],focusing spot geometry[16],lens-to-sample distance(LTSD)[17],spatial constraint[18],and ambient gas pressure [19]on signal repeatability.
In the previous work,we used diffractive optical element(DOE) to shape and converge the Gaussian beam output from the laser into a flat-top spot,and compared the stability and quantitative analysis performance of Gaussian and flat-top focusing spot induced breakdown spectroscopy [15,20].The results show that,the flat-top focusing spot obtained more constant ablation,more stable spectral intensity,better correlation calibration curve and lower limit of detection.However,DOE is expensive,and we find that there are lasers based on Gaussian mirror output with quasi flat-top laser beam in the market.Its convergence spot characteristics and its influence on the stability of spectral signal in LIBS are not clear.In this work,we study the change of energy distribution characteristics of flattop laser converging spot with LTSD and its influence on the spatial uniformity and emission spectrum of plasma,and further explore the optimal excitation and acquisition scheme.
2.Experimental setup
Figure 1 shows the LIBS system used in this work.The excitation source was a Nd:YAG pulse laser (Dawa-100,Beamtech Optronics,China)with a wavelength of 1064 nm,a repetition frequency of 1 Hz,a single pulse energy of approximate 50 mJ,and the RSD of its energy is about 1%.Based on the use of Gaussian mirror,it can output laser beams with quasi flat-top energy distribution.After passing through the beam expander,the initial pulse is reflected by a 45-degree mirror and converges to the surface of the stainlesssteel sample through an aspherical lens (#89-442,Edmund Optics,USA) with a focal length of 100 mm.The sample used in this work is standard stainless-steel (GBW 01683,Shandong Metallurgical Research Institute,China).The sample and the emitted light collection lens can be adjusted up and down,and their distance and angle remain unchanged.The plasma emissions are focused to the fiber end face and transmitted to the 4-channel optical fiber spectrometer(AvaSpec-ULS2048-4-USB2,Avantes,Netherlands),with an acquisition delay of 1.28 μs and an integration time of 1.05 ms.The plasma image is taken by ICCD (DH734I-18F-03,Andor,UK)equipped with a suitable lens,and its time is set the same as that of the spectrometer.During the experiment,LTSD was reduced from 106 to 89 mm,each time by 0.5 mm.Due to the limitation of ICCD acquisition range,when LTSD ≥ 95.5 mm,ICCD rises once to obtain a complete plasma image.
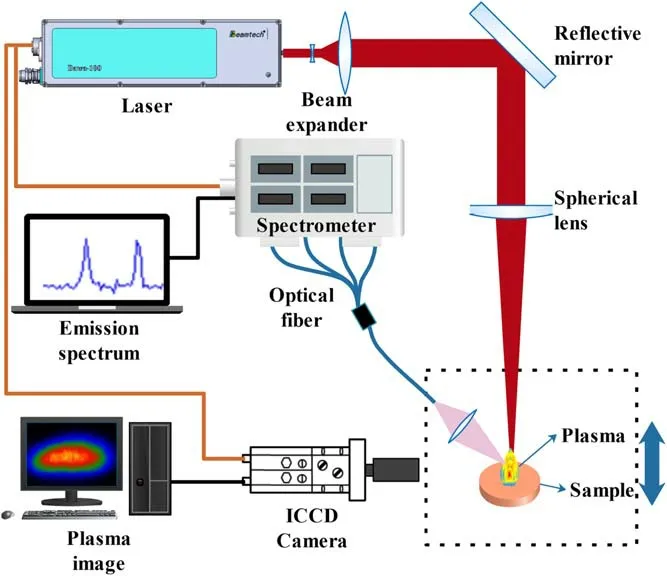
Figure 1.Schematic diagram of the experimental system.
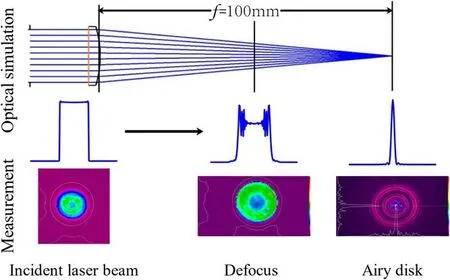
Figure 2.Theoretical simulation and experimental measurement of energy distribution before and after flat-top laser convergence.
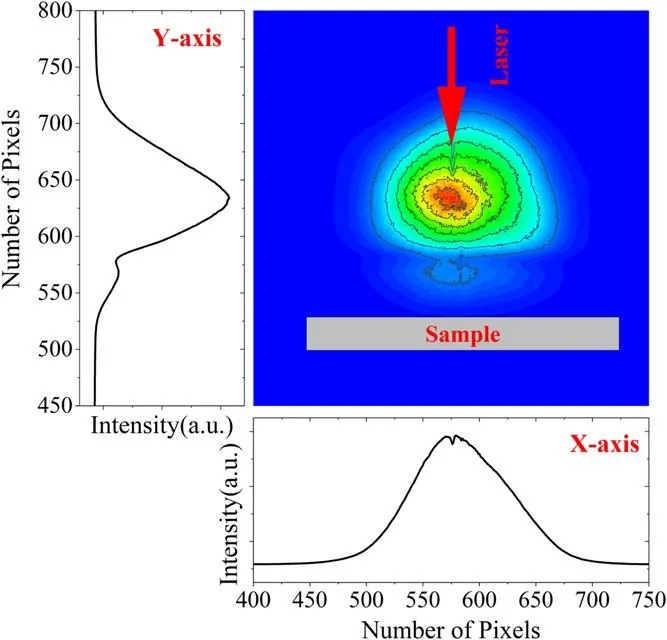
Figure 3.Plasma image illustration.
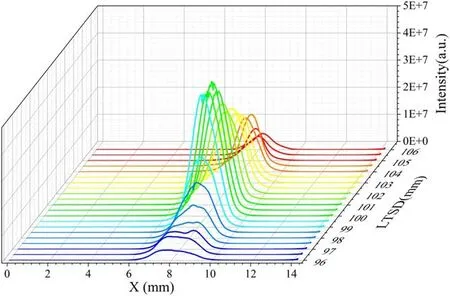
Figure 4.X-axis distribution characteristics of plasma.

Figure 5.The change of area and FWHM of Gaussian fitting X-axis for 106 mm ≥ LTSD ≥ 96 mm.
The energy distribution characteristics of the initial laser beam were experimentally measured by using a beam profile camera (pyrocam iiihr,Ophir photonics,USA).The results show that it has a quasi flat-top distribution.According to Huygens–Fresnel principle,each point of the wavefront can be regarded as the point wave source generating spherical secondary waves,and the wavefront at any time in the future can be regarded as the envelope of these secondary waves.The rigorous mathematical description of the relevant diffraction theory is beyond the scope of this study.Optical simulation software and Pyrocam IIIHR are used to simulate and measure the energy distribution characteristics of converging spot.As shown in figure 2,both theoretical simulations and experimental measurements show that the flattop beam produces spots with inhomogeneous intensity in the focal plane or intermediate plane.At the focal plane,there is a bright spot in the central area of the diffraction pattern generated by the flat-top beam,which is called the Airy pattern together with a series of concentric rings around it.In the case of defocusing,the energy distribution of the laser convergent spot has an uneven profile between the flattop and ring.
3.Results and discussion
3.1.Spatial distribution characteristics of plasma
The incident laser is perpendicular to the sample surface.For the convenience of the following description,we define the coordinate axis of the plasma image taken by ICCD.As shown in figure 3,the direction parallel to the sample surface is defined as the X-axis,the laser incident direction is defined as the Y-axis,where the intensity in the coordinate axis is the sum of image pixel intensities(SIPI)along the other direction.For better clarity,all of the images are normalized to their maximum intensity.
3.1.1.X-axis distribution characteristics of plasma.With the decrease of LTSD(the rise of the sample surface),the X-axis distribution characteristics of the plasma image are shown in figure 4.When 106 mm ≥ LTSD ≥ 96 mm,the X-axis line shape of the plasma image is similar to the Gaussian function.When the sample surface is slightly higher than the focal plane of the lens,the spatial distribution of the X-axis of the plasma is more uniform.Figure 5 shows the variation of the area(A)and the full width at half maxima(FWHM)of the Gaussian fitting with LTSD.The area has a maximum value,and the FWHM has a minimum value near the focus.When LTSD ≥ 103 mm,the FWHM does not continue to rise due to the influence of air breakdown.
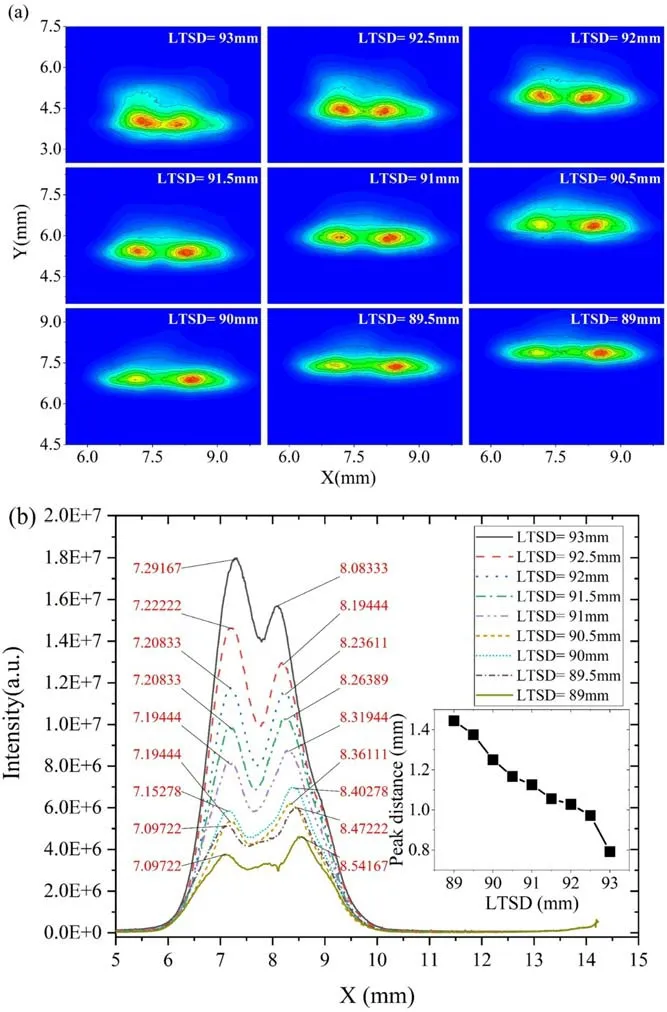
Figure 6.With the decrease of LTSD,double peaks begin to appear in the plasma image,and the distance between the two peaks increases gradually.(a) Plasma images for 93 mm ≥ LTSD ≥ 89 mm.(b) X-axis distribution characteristics of SIPI for 93 mm ≥ LTSD ≥ 89 mm.
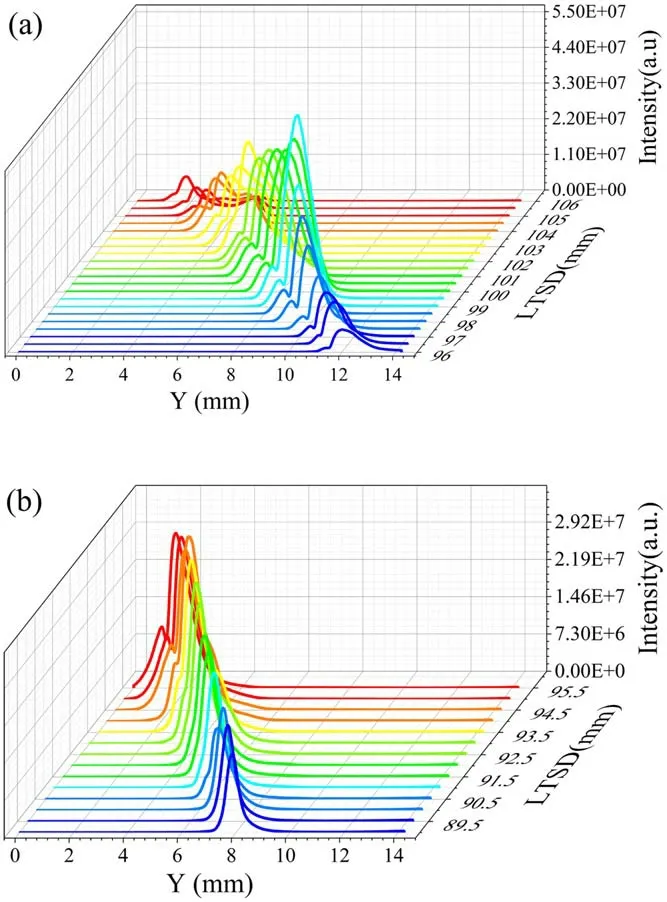
Figure 7.Y-axis distribution characteristics of SIPI.(a)106 mm ≥ LTSD ≥ 96 mm.(b) 95.5 mm ≥ LTSD ≥ 89 mm.
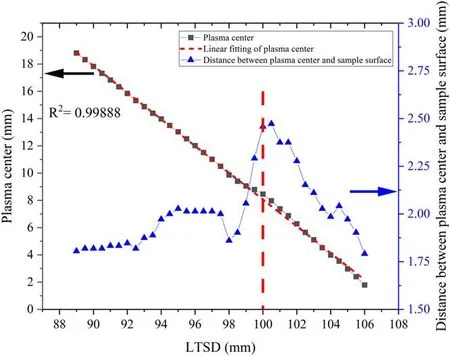
Figure 8.Variation of the plasma center and its distance from the sample surface with LTSD.
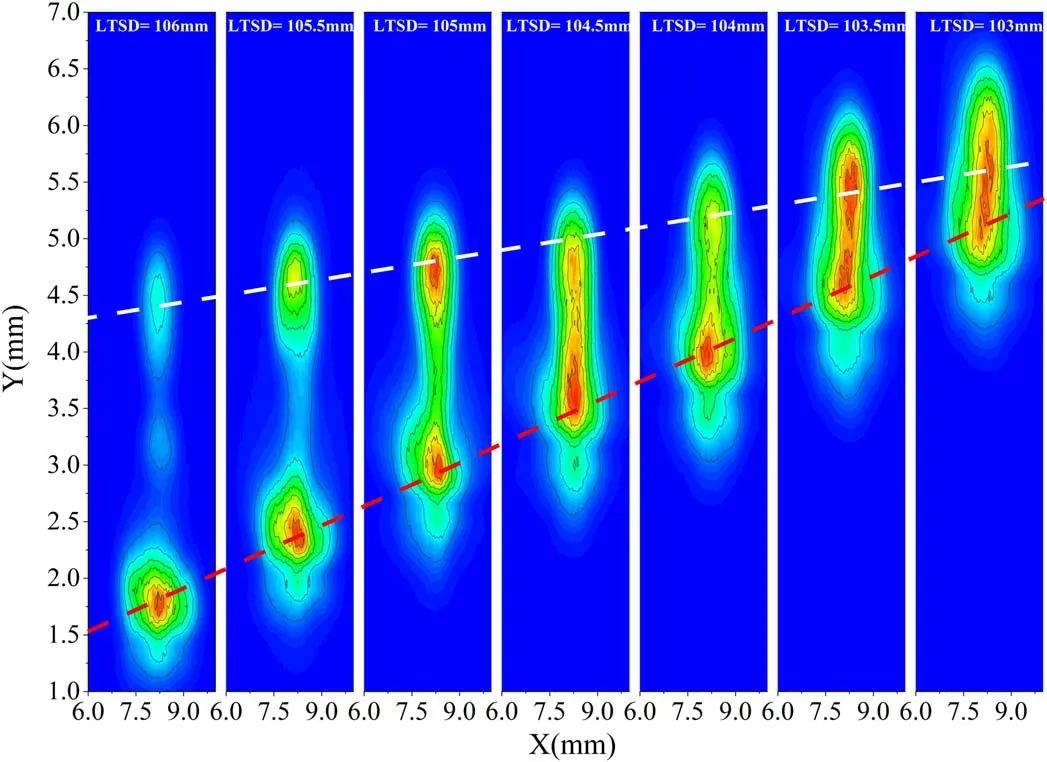
Figure 9.Location of plasma center and air breakdown when 106 mm ≥ LTSD ≥ 103 mm.The white dotted line is the air breakdown position,and the red dotted line is the plasma center.
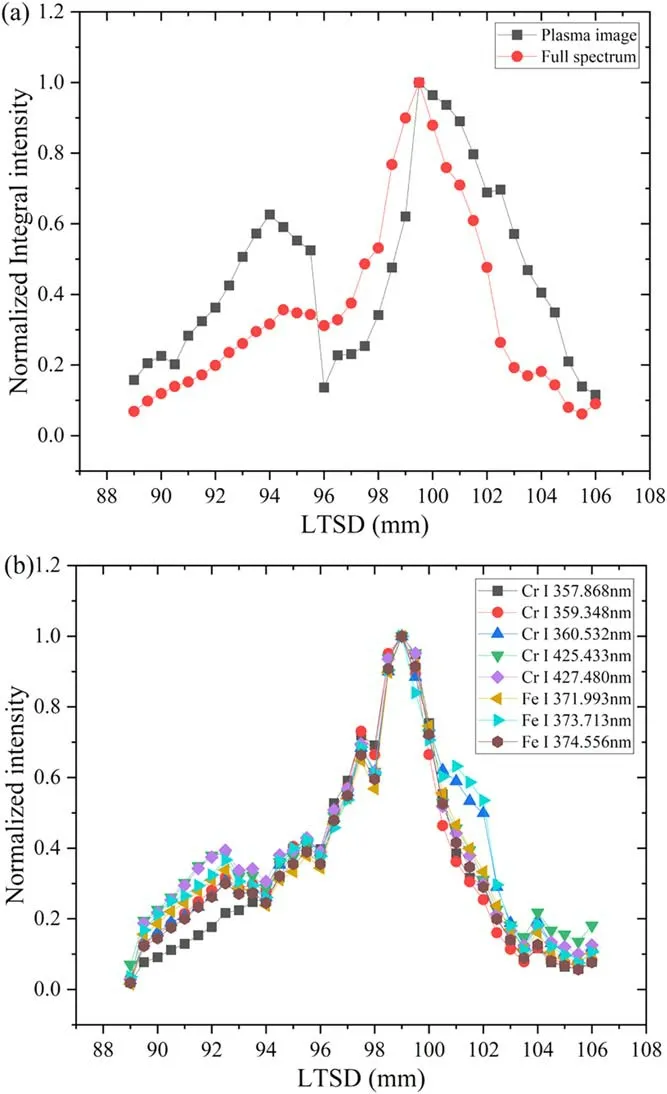
Figure 10.(a)Normalized SIPI and SFSI,(b)normalized intensity of Cr I 357.868 nm,Cr I 359.348 nm,Cr I 360.532 nm,Cr I 425.433 nm,Cr I 427.480 nm,Fe I 371.993 nm,Fe I 373.713 nm and Fe I 374.556 nm.
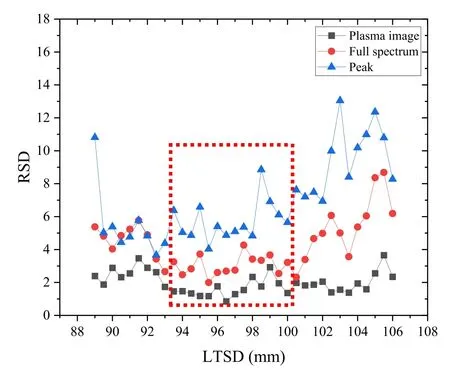
Figure 11.RSD of SIPI and SFSI and average RSD of 7 spectral peak intensities.
With the continuous decrease of LTSD,the laser convergence spot gradually increases,and the top of the Xaxis integral intensity gradually becomes flat.When LTSD ≤ 93 mm,double peaks begin to appear in the plasma image,and the distance between the two peaks gradually increases,as shown in figure 6.This is in agreement with the energy distribution of the laser convergence spot shown in figure 2.The results show that the spatial distribution of plasma strongly depends on the energy distribution of laser convergence.
3.1.2.Y-axis distribution characteristics of plasma.The Yaxis distribution characteristics of SIPI change with LTSD,as shown in figure 7.With the decrease of LTSD,SIPI first increases and then decreases,and there is a maximum near the focus.
As shown in figure 8,the plasma center,that is,the maximum value of the Y-axis,decreases with increasing LTSD.By linear fitting LTSD and plasma center position,the goodness of fitting is 0.99888.Based on this point,it can be estimated that the rise height of 0.5 mm per sample is approximately equal to 36 pixels.The distance between the plasma center and the sample surface,that is,the flying height of the plasma,has a maximum near the focus.
As shown in figure 9,with the decrease of LTSD(the rise of sample surface),the sample plasma gradually approaches and coincides with the air breakdown.However,it is obvious that the position of air breakdown is not fixed.Relevant studies show that the air plasma expands or propagates reversely along the laser incident direction [21],and the velocity increases with the laser energy[22].We consider that this phenomenon may be due to the diffusion of the sample plasma,which reduces the breakdown threshold of the front air,promotes the air to produce more plasma,and then absorbs more laser energy due to the shielding effect of the plasma.
3.2.The intensity and relative standard deviation
3.2.1.Intensity contrast.The normalized SIPI and sum of full spectrum intensity (SFSI) are shown in figure 10(a),and their Pearson correlation coefficient (PCC) is 0.74854.The SIPI and SFSI have some correlation,but there is a significant difference when LTSD < 95.5 mm and LTSD > 100 mm.This is mainly due to the inconsistency between the two acquisition areas.When the convergence spot is below the focal plane,the plasma image contains the intensity of air breakdown.Correspondingly,when the converging spot is above the focal plane,double peaks appear in the plasma image.Correspondingly,the spectral acquisition area is always limited to the vicinity of the plasma core.That is,when the laser converging spot is separated from the focal plane for a certain distance,the image range captured by ICCD greatly exceeds the spectrum acquisition range.The normalized intensities of the seven feature spectra are shown in figure 10(b).The mean PCCs of the feature spectra with SIPI and SFSI are 0.4738 and 0.9033,respectively.The mean value of the PCC between the characteristic spectra was 0.9777.It is shown that the characteristic spectra are more correlated with each other,more correlated with SFSI and less correlated with SIPI.
3.2.2.Relative standard deviation (RSD).The RSD of SIPI and SFSI,and the average RSD of 7 spectral peak intensities are shown in figure 11.Their average values are RSDSPIPI=1.98,RSDSFSI=4.24and RSDPeaks=6.92,respectively.So overall,RSDSPIPI The aim of the present research was to evaluate the effect of LTSD on the spatial uniformity and emission spectrum of plasma induced by flat-top laser convergent spot.The laser energy distribution after beam expansion and convergence is an Airy spot at the focal plane and a nonuniform flat-toplike distribution out of focus.Under the existing experimental configuration,the distance between the air breakdown spot and the sample plasma gradually decreases as the LTSD decreases when the sample is below the focal plane.When LTSD=103 mm,the air plasma is combined with the sample plasma.The sample is near the focus,and the plasma has the maximum distance from the plasma center to the sample surface.When the sample surface is slightly higher than the focal plane,the spatial distribution of the plasma is more uniform,the plasma width gradually increases as the LTSD decreases,and a double peak starts to appear when LTSD ≤ 93 mm.Since the spectrum acquisition area is limited to only the plasma core,RSDSPIPI Acknowledgments This work is supported by the Young Scientists Fund of National Natural Science Foundation of China (No.12004388),the National High Technology Research and Development Program of China (No.2021YFB3202402),the Key Research and Development Plan of Anhui Province(No.202104i07020009) and the Collaborative Innovation Program of Hefei Science Center,CAS (No.2021HSCCIP005). ORCID iDs4.Conclusions
猜你喜欢
理论建设(2022年4期)2022-09-03当代水产(2022年6期)2022-06-29语数外学习·高中版下旬(2020年3期)2020-09-10校园英语·下旬(2018年7期)2018-10-30价值工程(2018年14期)2018-05-03时代金融(2017年23期)2017-09-13现代营销·经营版(2016年12期)2016-12-21中国市场(2016年21期)2016-06-06课程教育研究·下(2016年2期)2016-03-25安徽农业科学(2015年34期)2015-10-21
 Plasma Science and Technology2022年8期