
Aqueous ruthenium detection by microwaveassisted laser-induced breakdown spectroscopy
2022-09-14 08:18AbuFarhanABUKASIMWAKILKevinGRANTMiltonHEARNandZeyadALWAHABI
Plasma Science and Technology 2022年8期
Abu Farhan ABU KASIM,M A WAKIL,Kevin GRANT,Milton HEARN and Zeyad T ALWAHABI
School of Chemical Engineering,The University of Adelaide,Adelaide SA 5005,Australia
Abstract Aqueous ruthenium was detected in real-time under ambient conditions using microwaveassisted laser-induced breakdown spectroscopy (MW-LIBS).A 10 mJ laser energy and 750 W microwave power were directed at an open liquid jet sample of ruthenium.It was observed that,for liquid flow,the coupling efficiency between the microwave and the laser-induced plasma was limited to 43%.The improvement in the ruthenium’s signal-to-noise ratio with MW-LIBS,with respect to LIBS,was 76-fold.Based on MW-LIBS,the limit of detection for aqueous ruthenium was determined to be 957 ± 84 ppb.
Keywords: microwave-assisted laser induced breakdown spectroscopy,ruthenium detection,laser induced breakdown spectroscopy
1.Introduction
Ruthenium(Ru)is part of the platinum-transition group 8 metals and is a rare element due to its very low mining rate [1].Following its discovery and isolation by Karl Karlovich Klaus in 1844,scientists have been studying the numerous ways in which ruthenium can be utilized[2].In its early applications,ruthenium was commercially used as an alloying agent for the hardening of platinum and palladium [3].Because they exhibit rapid reversible redox processes involving a variety of coordination geometries and valence states,ranging from octavalent in RuO4to−2 valent in Ru(CO)42−,Ru-based materials have subsequently attracted considerable interest in multiple fields,including the development of supercapacitors,in ruthenium-platinum alloys for methanol fuel cells,and in photovoltaics [4,5].In addition,organometallic ruthenium complexes have found very wide application as catalysts in the homogeneous and heterogeneous syntheses of numerous organic compounds [6–8]and polymers[9–11],including reactions involving Z-selective olefin metathesis catalysts [12,13]and many pharmaceutical compounds [14].As a consequence,the versatility of rutheniumbased compounds now permits its routine use in today’s chemical processing and pharmaceutical industries [15],including its role in the hydrogen evolution reaction[16]and the aqueousphase hydrogenation of biomass [17].
Despite the enormous scope of application of rutheniumbased catalysts,the detection and removal of residual ruthenium impurities from synthetic mixtures represent a significant challenge,particularly for synthetic products destined to become active pharmaceutical ingredients (APIs).Depending on the reaction conditions,ruthenium can be dislodged from its catalytic complex and leach into the solution [18–20].This phenomenon is common in heterogeneous catalytic reactions and occurs either by thermal effects that reduce the integrity of the catalyst carrier’s structure and/or through pH effects [18].Although considerable effort has been expended to develop more stable ruthenium-based catalysts [20,21],losses are inevitable and can pose a significant health and business risk.From a more general perspective,the detection and recovery of rutheniumrelated leachables could be carried out by simply removing the ruthenium catalyst by filtration during the process and observing whether further reaction occurs in the filtrate;with persistent product formation suggesting that leakage had occurred[22].Despite being a definitive analysis,this method is often impractical as the majority of production industries now operate in a continuous mode.
Chemical species detection is important in many fields such as the food industry,chemical and pharmaceutical processing and manufacture,and the mining industry.To accommodate this task,numerous analytical methods,such as atomic absorption spectroscopy (AAS),have been developed to both detect the presence,and quantify the amount,of an element in a given sample [23].One detection technique that has attracted considerable attention in recent years is laserinduced breakdown spectroscopy (LIBS).The reason for this interest is that the analysis can be carried out with little to no sample preparation and hence allows extremely fast and in situ detection [24,25].LIBS methods exploit the concept of atomic emission spectroscopy by using a laser pulsing in a range of nano- to femto-seconds as an ablation source.This approach allows analysis without the need for sample preparation as the laser energy is focused directly onto the sample allowing an ablation of the target regardless of its physical or chemical state [24,26].However,LIBS suffers from the disadvantages of low sensitivity,and low reproducibility[27,28].This is where assisted techniques such as microwave-assisted LIBS (MW-LIBS) are useful [29].
MW-LIBS enhances the detective capability of LIBS by extending the lifetime of the plasma produced by the laser up to hundreds of microseconds [30]rather than just a few [31].The main reason for this is that,with the addition of microwaves,the laser-induced plasma can be reignited by mobilising the free electrons and ions and thus further prolonging their lifetime[27].This can be achieved by employing a nearfield applicator(NFA)to the system[32].The effectiveness of microwave coupling to the system has recently been demonstrated.Enhancement factors for the limit of detection(LoD) parameter,lowest theoretical concentration detectable,ranging from 11 folds to 93 folds,have been achieved for the analysis of indium (aq) and copper (s),respectively [33,34].
MW-LIBS can offer an attractive solution for ruthenium detection at very low concentrations.This is because it enables in situ real-time detection,whilst still maintaining a substantial sensitivity.In regard to process technologies,and with respect to the current investigation,as soon as Ru leakage becomes evident and detected in the process stream or reactor during operation,the catalyst could be isolated,retrieved,and then immediately replaced with a fresh batch.In addition to not impeding the process and preserving a constant production rate,this approach will certainly avoid further losses in Ru-based catalysts and extends its useful life as the extracted species can simply be reused by readsorbing it into a new catalyst carrier [35].Owing to the extreme demand for its use as a catalysis,and because only 12 tonnes per year of this rare element are mined throughout the world[1],as opposed to 10 million tonnes for copper [36],having available a highly sensitive real-time procedure to identify Ru in its aqueous state could consequently be very useful during its extraction from mineral sources and for its application.In the case of liquid detection using MW-LIBS/LIBS,the simplest approach is to have a static liquid solution held in a suitable vessel and focus the laser on the surface of the liquid.Although it can be easily operated,using this method usually yields unsatisfactory results as most of the laser energy is used to evaporate the bulk liquid causing a lower quantity of excited atoms [31].A solution to this problem is to have the liquid flowing as a jet instead of remaining stationary.This permits a much lower laser energy consumption during the vaporisation phase since a smaller volume is present per given time [33].
Furthermore,the use of a water jet reduces the unwanted splash issue associated with laser ablation of static fluids.Several studies have been published regarding liquid MWLIBS/LIBS and the reported detection limits are tabulated into table 1.
An extensive study has been carried out by Balcerzak regarding the analytical detection of ruthenium in different samples [42].A variety of methods have been outlined with different detection limits including AAS,inductively-coupled plasma atomic emission spectroscopy (ICP-AES) with periodic acid solution,and UV–vis spectroscopy,with an LoD of 0.1 ppm,0.005 ppm and 0.001 ppm,respectively [42].
It is worth noting,however,that these analytical methods cannot be used in real-time as they require sample preparation.They are also more suitable to be employed in analytical laboratories.Currently,as previously stated,there is no report on LoD for aqueous ruthenium(Ru(aq))detection with MW-LIBS.Thus,to the best of the authors’ knowledge,this paper reports the first real-time detection of ruthenium in liquid samples.
2.Experiment
Figure 1 shows a schematic of the experimental MW-LIBS setup used for the detection of Ru.A Q-switched Nd:YAG (neodymium doped yttrium-aluminium-garnet) was used as the laser source producing a beam of 532 nm in wavelength,10 Hz repetition,∼6 ns in pulse duration and a beam width of 3 mm.A half-wave plate(HWP)combined with a Glan-laser polarizer(P)was used to alter the laser pulse energy.Pulse energy was measured with an ES220C pyroelectric sensor (EM) and set to an optimized energy to be determined.The laser beam passed through a perforated parabolic mirror with a focal length of 152 mm and a diameter of 50.8 mm and was then focused onto the liquid sample by a plano-convex UV fused silica lens with a focal length of 100 mm and a diameter of 50.8 mm.The emission was collected by the emission detection unit which consists of Lens 1(focal length of 100 mm and diameter of 50.8 mm),an offaxis parabolic mirror (OPAM),Lens 2 (focal length of 20 mm)and an achromatic reflective coupler(ARC)as shown in figure 1.
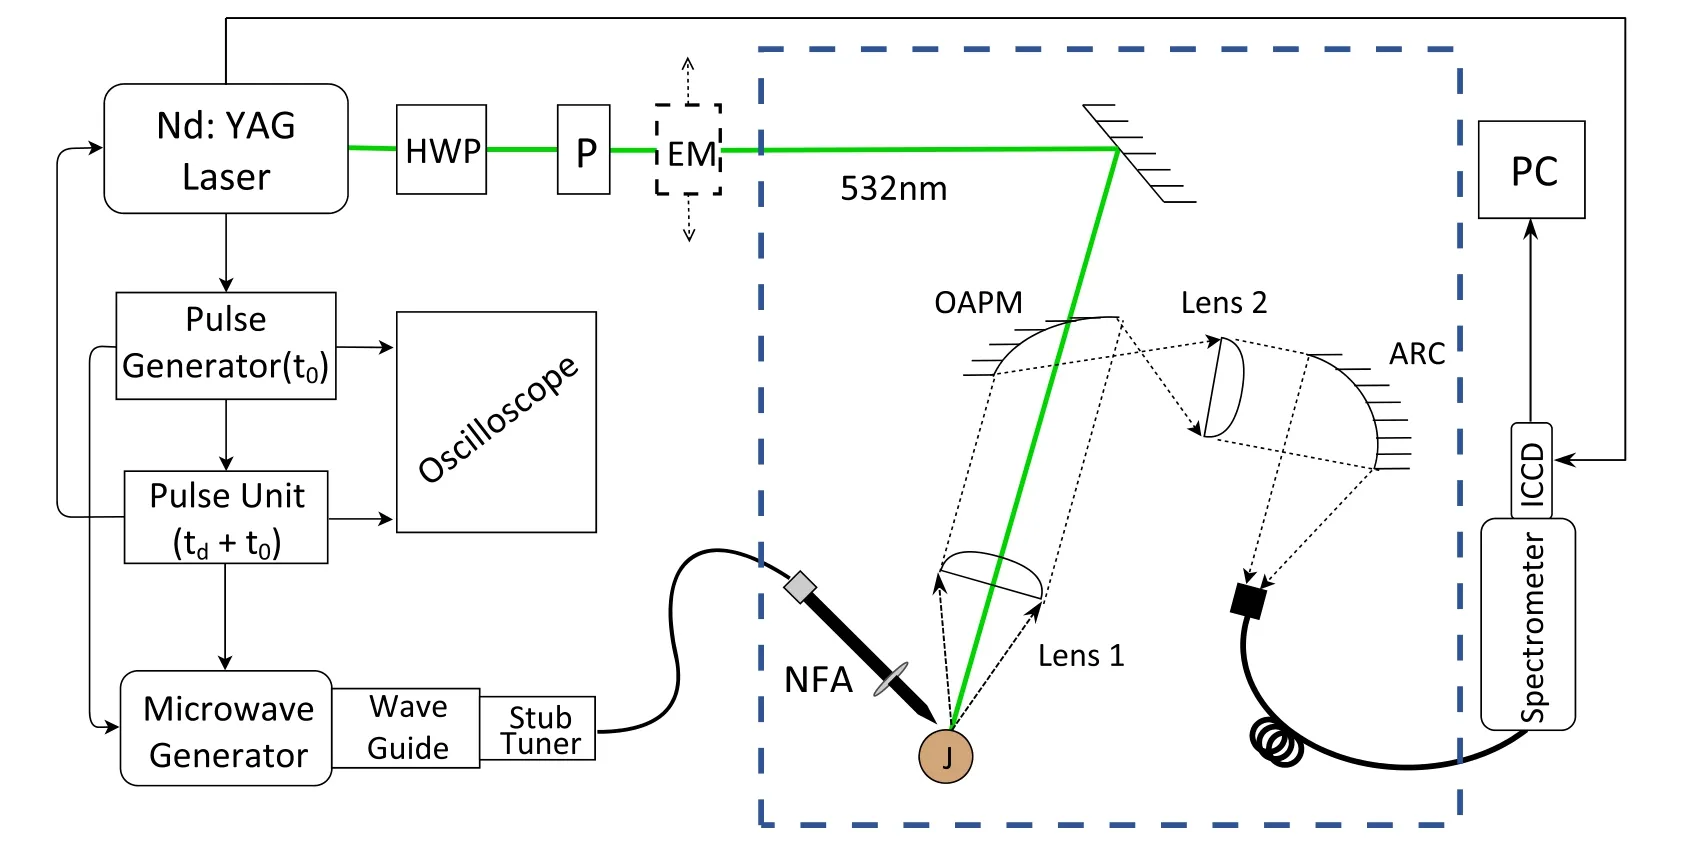
Figure 1.Schematic of apparatus setup.HWP:half-wave plate,P:polariser,EM:energy meter,NFA:near-field applicator,OAPM:off-axis parabolic mirror,ARC: achromatic reflective coupler,ICCD: intensifier camera,J: jet.
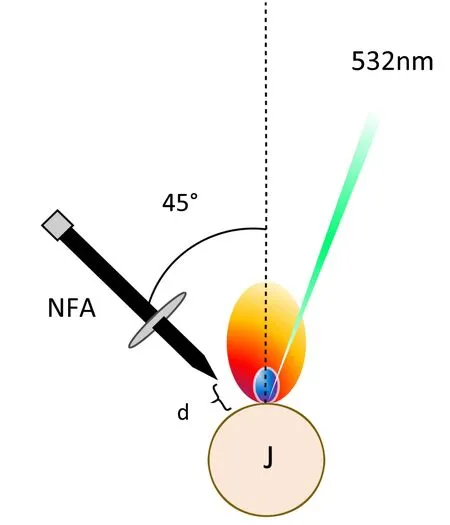
Figure 2.NFA’s orientation schematics,J is the jet,d ∼ 1 mm.
The emission was channelled into a seven-fibre bundle(Thorlabs,BFL200HS02) connected to a spectrometer (Andor,Shamrock 500i with 2,400 lines mm−1diffraction grating)equipped with an intensifier camera ICCD (Andor,iStar).
As shown in figure 1,an aluminium box(dotted line)was used to minimize the residual microwave radiation.One side of the aluminium box was covered with metal mesh acting as an observation window.
Pulsed 2.45 GHz microwave radiation was generated by a 3 kW water-cooled Sairem microwave system.The microwave reflected power was monitored by a crystal detector consisting of a generator coupled to an isolator.A WR340 waveguide was utilized to guide microwave radiation to a three-stub impedance tuner.Radiation passed a quartz window where a tuner was connected to a waveguide-to-coaxial adaptor (WR340RN).This adaptor was attached to a 1 m flexible coaxial cable (50 Ohms NN cable with 0.14 dB insertion loss at 2.45 GHz).The end of this coaxial cable was connected with a near-field applicator (NFA) [32].The tip of the NFA was located ∼0.5 mm horizontally and vertically,at an angle of 45° from the liquid jet containing the ruthenium sample,as shown in figure 2.The microwave pulse,duration and power were controlled by a pulse generator (Aim-TTi).This allows the microwave pulse to initiate 200 μs prior to the laser pulse and was held for 1 ms.When this happens,the premature triggering of the microwave radiation allows it to reach its full power before the laser pulse occurs,and thus,ensuring proper coupling.
A steady liquid circulation system needed to be arranged in the apparatus.To achieve this,a peristaltic pump(Ismatec,MW-MSC 1),a 25 ml syringe as a sample reservoir,a circular nozzle with 0.8 mm diameter and a collection funnel were connected with plastic tubing (Masterflex,6485-16) to create the flow pumping system,as shown in figure 3.At 300 rpm pump operation,50 ml of sample was periodically added to the syringe reservoir to allow a steady jet of solution and avoid air bubbles in the system.It is worth noting that distilled water was used to wash out the Ru sample in the flow after each test to avoid contamination.A liquid stock solution of ruthenium,dissolved in 5% (v/v) aqueous hydrochloric acid,was supplied by Choice Analytical,Australia.
The stock contained 10,000 ± 50 ppm of ruthenium solution and was used to prepare samples ranging from 50 to 2000 ppm.These samples were diluted with distilled water using a 1 ml volumetric pipette and 50 ml beaker.Additional uncertainties will occur from the equipment used,yielding±0.005 ml and ±5 ml respectively.These errors were assumed to be independent,and the root sum square method was used to determine the absolute uncertainties corresponding to each concentration analyzed.
3.Results and discussion
Table 2 shows the wavelengths,transition probability,and energy levels of a few Ru I lines [43].It was found that the three Ru lines,with a ground state as a common level,produce the best signal-to-noise ratio,at laser energy and microwave power ranges of (7.5–15) mJ and (450–750) W,respectively.Further analysis was performed based on these three regions of bound-to-bound transition depending on the concentration used,the significance of self-absorption during the experiment and overall noise present during the period of the experiment,and the purpose of the analysis.
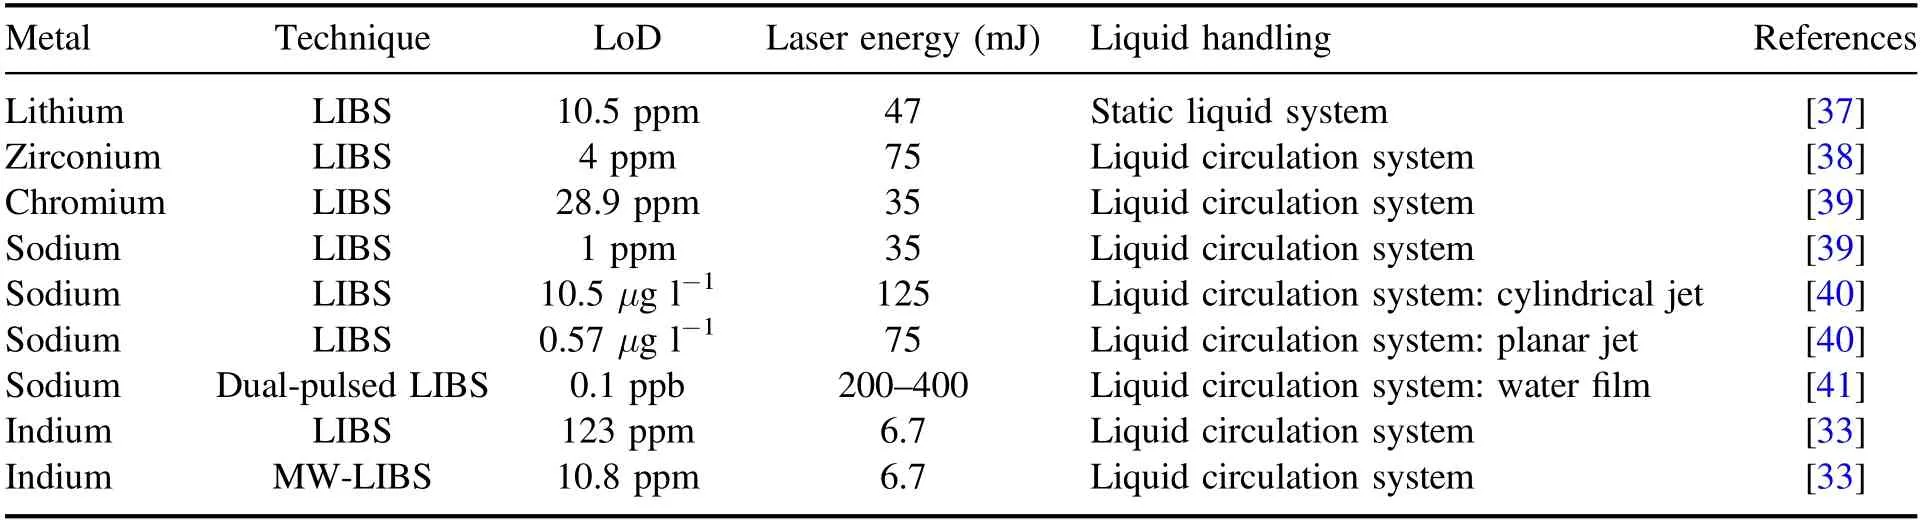
Table 1.Limit of detection of various metals using LIBS and MW-LIBS for the aqueous phase.
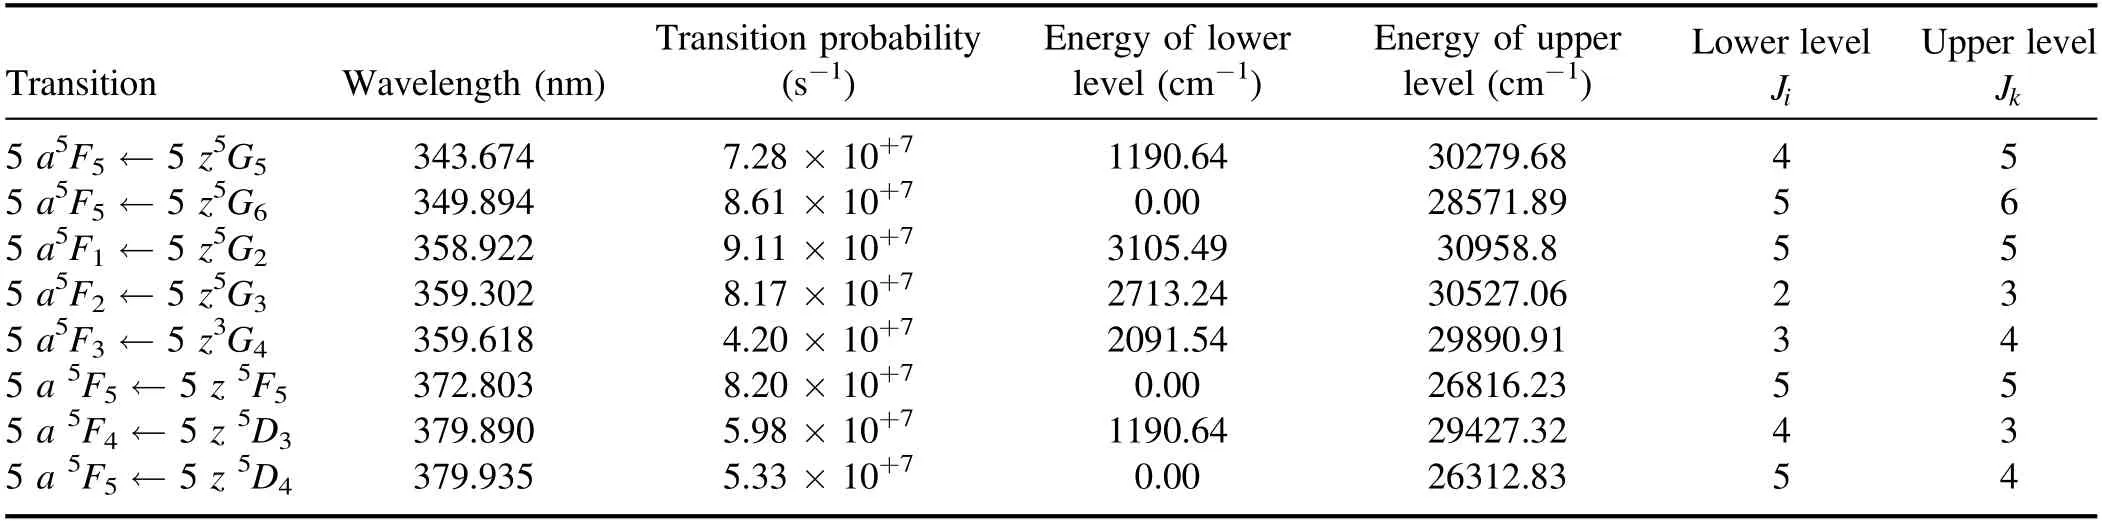
Table 2.Spectral parameters of ruthenium [40].
Figure 4 presents the difference in the signal intensity with and without microwaves.The two spectra were recorded using 100 accumulations,at 1 ms gate width and without any gate-delay prompt.The laser energy and microwave power were held constant at 10 mJ and 750 W,respectively.As can be seen from figure 4,using MW-LIBS allows the observation of clear and distinctive peaks compared to using just LIBS.This was observed even for a line with low transition probability,for example,the 379.935 nm transition.With LIBS only (microwave off),the Ru(aq) was essentially undetectable at 600 ppm.

Figure 3.Schematic of liquid circulation system.
To study the microwave power and the laser energy dependence,Ru(aq) concentration of 2000 ppm was chosen.The signal was taken based on the emission spectrum around 372.80 nm,in an attempt to circumvent the effects of selfabsorption,while the noise was computed from the standard deviation of regions that do not correspond to any elements that could be present.75 accumulations with a gate-delay of 0 s and 1 ms gate-width were set in order to obtain the results in figures 5 and 6.Accordingly,in order to determine the effects of laser energy on the signal-to-noise ratio (SNR),the microwave power was held constant and the laser energy was increased from 8 mJ to a maximum of 15 mJ.It is worth noting that the microwave power was kept below 750 W as it was apparent that the degree of liquid splash increased with microwave power.This is a direct result of a more violent ablation as the microwave power was increased.All the tests were conducted at 750 W as it was predicted from the literature [33]that higher microwave power yields consistently higher SNR.
Figure 5 shows that the SNR peaks at 10 mJ laser energy,at which the signal was found to be presented at 76 times the noise.This is to be expected as both the signal and the noise increase with laser energy.The only difference is the rate at which it increases [44].
Consequently,a point where the signal escalates faster than the noise was sought in a laser ablative study.Since it was found that a relatively low laser energy is needed to attain a high SNR,there is no practical reason to increase the laser energy further than the maximum point,10 mJ.This outcome was accompanied by several benefits,one of which is the reduction of sample destruction.This is always a useful trait because some samples are precious,either due to their rarity or their antiquity,and need to be preserved.After the optimum laser energy has been determined,the relationship between microwave power and SNR was then confirmed and the data were compared with the literature.This analysis was carried out at two different laser energies (10 mJ and 15 mJ)to improve the clarity of the results.
Figure 6 shows an increasing trend of SNR improvement with microwave power,even at two different laser energies,indicating that the coupling of microwave radiation improves the SNR for the detection of Ru in aqueous solution.It should be noted that at zero microwave power the SNR was taken to be 1 for the graphical presentation of results.
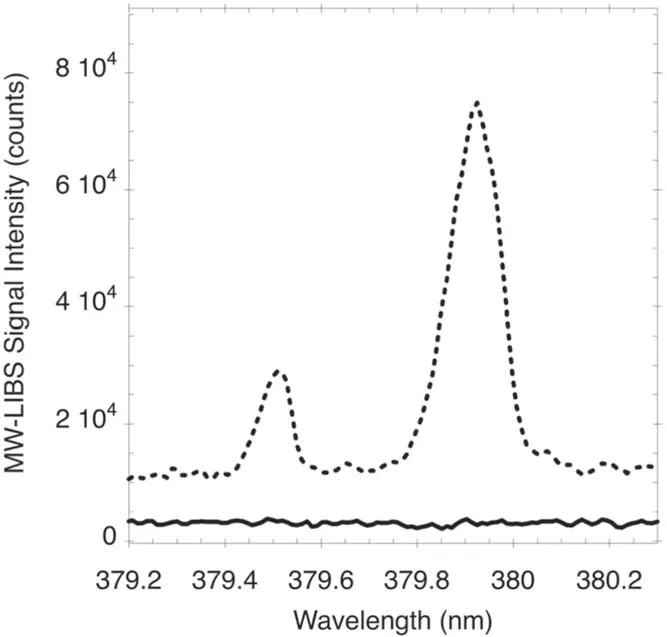
Figure 4.Signal intensity of a flow with a 600 ppm Ru(aq) without microwave,solid line,and with microwave,dotted line,at 750 W.
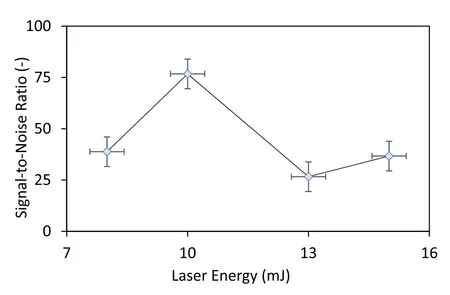
Figure 5.Signal-to-noise ratio versus laser energy at a constant microwave power of 750 W.
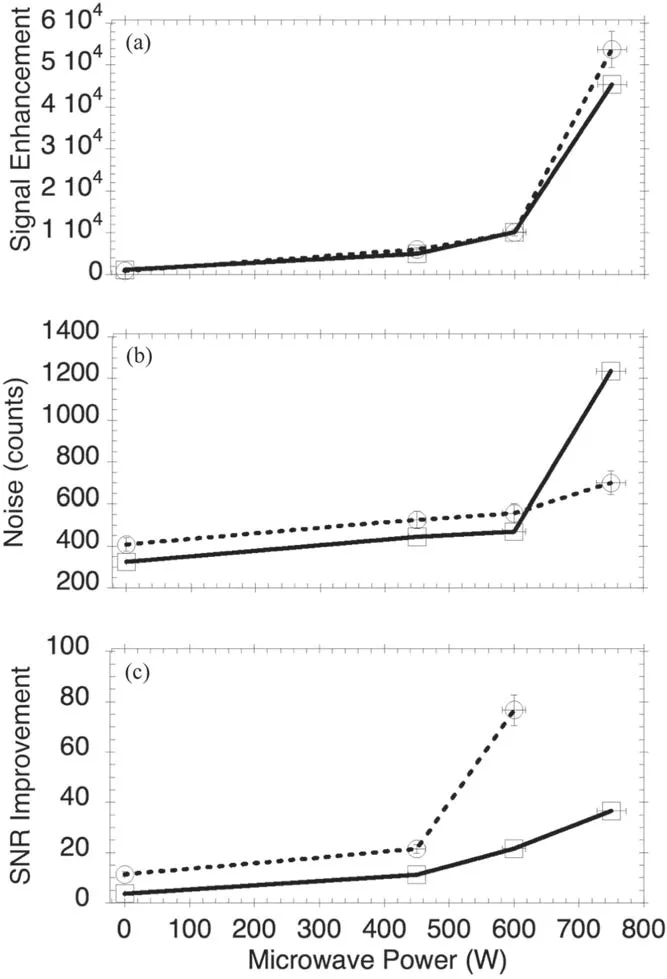
Figure 6.Microwave dependence,signal enhancement versus microwave power,(a) noise count versus microwave power,(b)signal-to-noise ratio versus microwave power,(c) recorded at laser energy of 15 mJ (solid line),and 10 mJ (dotted line).
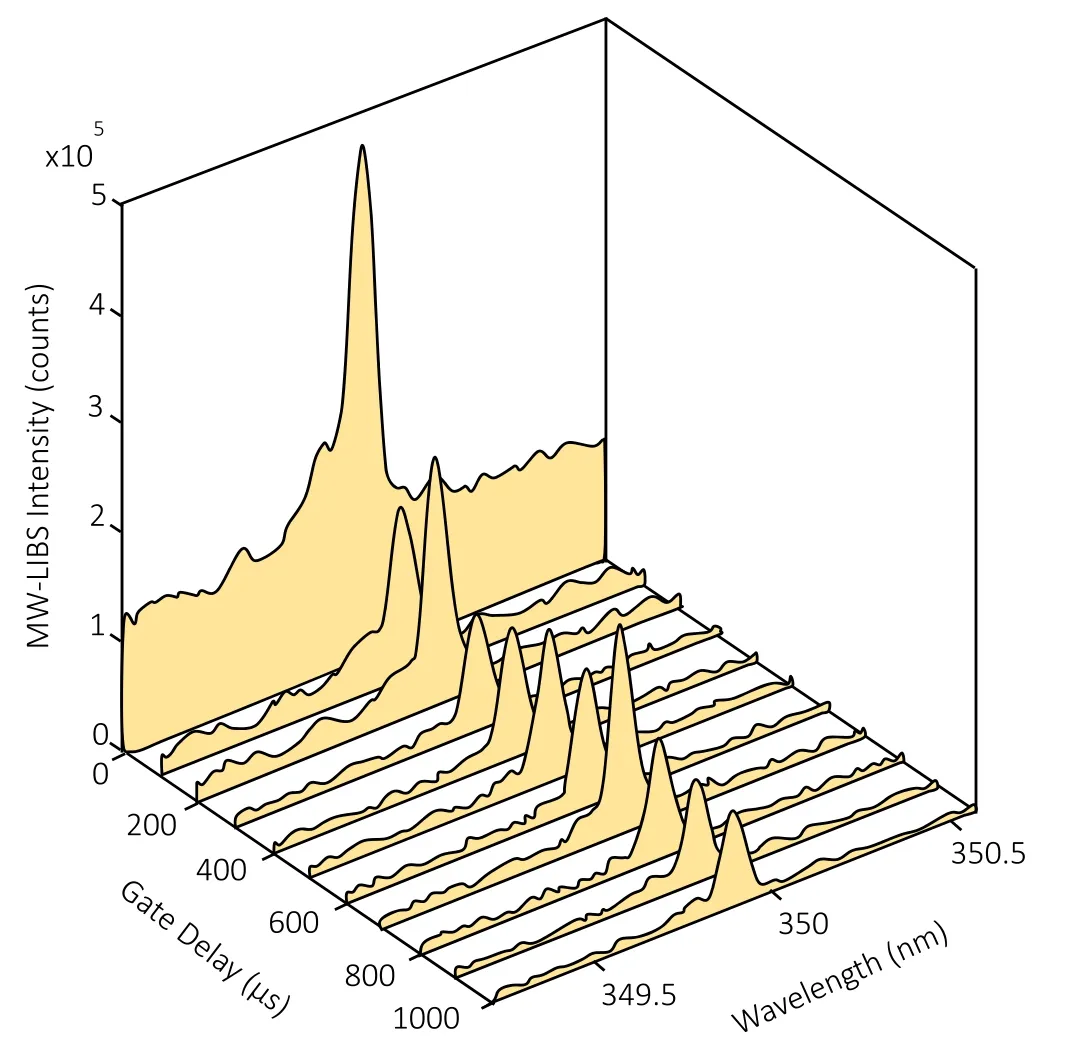
Figure 7.Temporal evolution of MW-LIBS Ru spectra recorded with a fixed gate-width of 100 μs,and a laser energy and microwave power of 10 mJ and 750 W,respectively.
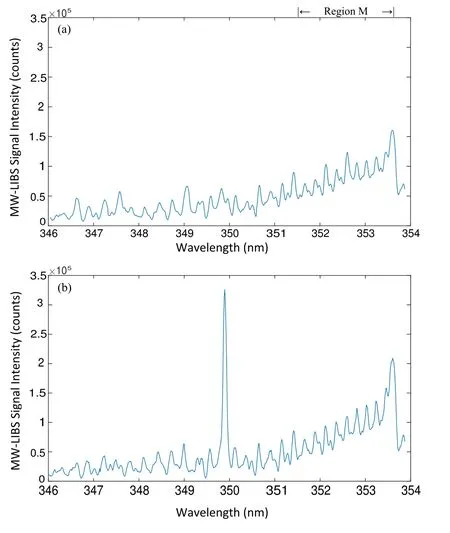
Figure 8.MW-LIBS spectra of a flow without Ru (a),and with 100 ppm Ru(aq) (b),recorded at similar laser energy and microwave power.
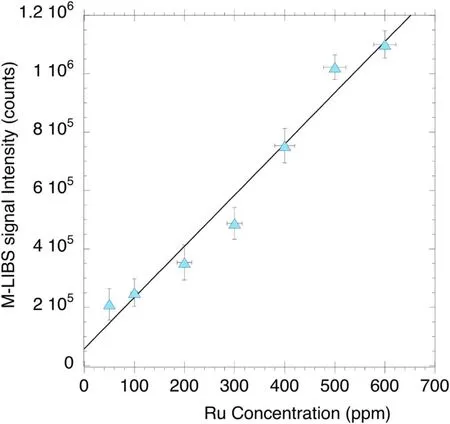
Figure 9.MW-LIBS signal intensity versus [Ru].
As mentioned earlier,the maximum microwave power is not to exceed 750 W so as to maintain the safety and integrity of the equipment.This will inevitably limit the extent to which the variable can be manipulated.From a comparably similar study that was undertaken for indium detection in aqueous solution [33],it was found that the highest microwave power used was 1.2 kW,which resulted in the highest SNR.It is worth noting that using higher microwave power can result in an unstable plasma,leading to a lower signal-tonoise ratio.To present the capability of microwaves as an enhancement tool,the temporal evolution of the MW-LIBS signal was investigated with a 1000 ppm ruthenium sample.The Ru transition at 349.894 nm was detected with a scanning gate-delay from 0 s to 1000 μs at a step width of 100 μs and an accumulation of 100 shots.The laser energy and microwave power were 10 mJ and 750 W,respectively.
As can be seen from figure 7,after the background emission at 0 s,the signal persists all the way up to 1 ms.This result was supported by other studies whereby the signal continues up to 700 μs and 800 μs,for indium(aqueous)and copper(in solid matrix),respectively,due to the extension of plasma lifetime by the microwave [33,34].It was expected that the MW-LIBS signal remains constant as the gate delay is scanned from 200 to 800 μs.It was observed,however,that the signal level has some fluctuation.The reduction of the MW-LIBS signal at a few gate-delay times is due to the reduction in the NFA performance as a result of contact with water droplets.
Before the quantitative analysis of Ru(aq) detection with MW-LIBS was undertaken,two pilot experiments were performed on the liquid matrix sample,distilled water,and the microwave coupling rate based on shot-to-shot spectra.The reason for this was that an emission was found to be due to molecular transitions that occurred near the 349.894 nm line.This was then carried out at 100 accumulation shots,100 ns gate-delay and 1 ms gate-width as shown in figure 8.The laser energy and microwave power were 10 mJ and 750 W,respectively.As shown in figure 8,in addition to clarifying the absence of signals at the 349.84 nm transition line of Ru in the zero concentration sample,band signals were received by the spectrometer at a wavelength range denoted as region M,∼351.43–353.6 nm.
Since the blank sample mainly contains the elements of hydrogen (H) and oxygen (O),it is most likely that this emission is a result of the OH*radicals [45].The laserinduced plasma on H2O produces electronically exited hydroxyl radicals (OH*).OH*emits UV radiation in the 350–354 nm range due to the A2Σ(v=1)→X2Π(v=2)transition,as shown in figure 8.Given this circumstance,as the time-related emission of the decaying plasma studied previously was also at the same span of wavelength,the intensity of the Ru(aq) signal relative to the OH*band,both taken as the average peak values,was also investigated.
It should be noted that the spectrum at 0 μs delay was brought to the baseline for this.All points were shown to have a negligible increase as time progresses.With respect to this finding,the molecular emission of the OH*band was found to have no substantial effect on the detection of Ru(aq),implying that higher energy from the laser and microwave was absorbed for the excitation of the chemical species of interest instead of by the liquid matrix.
Previously,it has been observed that not every microwave pulse produces optimum microwave–plasma coupling.This outcome is because some small water droplets may reach the tip of the NFA,reducing its efficiency.The success rate of the microwave coupling on the laser-induced plasma was investigated based on 100 single laser shots at 10 mJ and 750 W laser energy and microwave power pair,and 0 ns gatedelay with 1 ms gate width.The deciding factor of what is a coupled plasma and what is not was determined from the presence or absence of the emissive signal at the 379.935 nm line.To quantify the coupling efficiency between the microwave and the laser-induced plasma,100 single laser shots were used to capture a single MW-LIBS signal.It was found that only 43 out of the 100 pulses generate a MW-LIBS Ru signal.It was concluded,for liquid detection,the coupling efficiency between the microwave and the laser-induced plasma is 43%.
In order to quantitatively detect the presence of Ru(aq)using MW-LIBS,a calibration curve was constructed using varying concentrations of Ru(aq) ranging from 50 to 600 ppm.To ensure no background emission,100 accumulated shots,at 100 ns and 1 ms of gate-delay and gate-width respectively were made.The transition at 349.894 nm was used due to its greater emission response and the highest transition probability of the three lines chosen for this study.Furthermore,at 349.894 nm there is no overlaps with a headband of OH*radicals A2Σ(v=1)→X2Π(v=2)at ∼353.6.
In addition,the laser energy and microwave power used were 10 mJ and 750 W respectively.It is also worth noting that the signals corresponding to each concentration were corrected for any possible convoluted noise based on an average of three peak points in close vicinity to the line,all of which accommodate for the worst-case scenario.Thus,figure 9 represents the calibration curve for ruthenium detection using MW-LIBS.
Figure 9 shows an increasing trend of signal with the concentration of Ru(aq).The regression has a high R2value,0.9616,for the regression analysis with an intercept set to the origin and this suggests that the plot is statistically valid.Since three independent [Ru(aq)]measurements were performed,the vertical error bars were based on the deviation in signal intensity of these three measurements whilst the horizontal error bars were calculated based on equipment error during standards preparation.Thus,the LoD was calculated using;LoD=wherekis the implemented confidence level (95%) which yields a magnitude of 3;is the average background standard deviation;bis the slope of the calibration curve[22,25].The error in the LoD was then taken from the deviation in the slope,which specifically is a slope constructed from the extremum points of the error bars.Consequently,the LoD of Ru(aq) for this study is 957 ± 84 ppb.
4.Conclusion
The detection of Ru(aq) using MW-LIBS was successfully demonstrated in real-time,and at ambient pressure and temperature conditions,for the first time.This was achieved by directing the laser and microwave towards an open jet aqueous liquid sample of ruthenium at varying concentrations ranging from 50 to 2000 ppm.It was found that the high sensitivity detection of ruthenium using LIBS at ambient conditions was insufficient and required the enhancement of microwave injection.Furthermore,an optimum laser energy and microwave power combination of 10 mJ and 750 W was determined but in the absence of a maximum turning point for the microwave power analysis.It was observed that,for liquid detection,the coupling efficiency between the microwave and the laser-induced plasma is 43%.Based on the plot of MWLIBS signal intensity versus [Ru],the Ru(aq) LoD was determined to be 957 ± 84 ppb.This first example for realtime aqueous ruthenium detection paves the way for the online monitoring of the low concentration of Ru in industrial processes.Thus,the MW-LIBS technique is suitable for the online monitoring of ruthenium traces with a concentration down to ∼957 ppb under ambient conditions.
ORCID iDs
 Plasma Science and Technology2022年8期
- Plasma Science and Technology的其它文章
- Image-based plasma morphology determination and LIBS spectra correction in combustion environments
- Rapid identification of volatile organic compounds and their isomers in the atmosphere
- Fast identification of mural pigments at Mogao Grottoes using a LIBS-based spectral matching algorithm
- Effect of lens-to-sample distance on spatial uniformity and emission spectrum of flat-top laser-induced plasma
- Quantitative analysis of the main components in ceramic raw materials based on the desktop LIBS analyzer
- Elemental and proximate analysis of coal by x-ray fluorescence assisted laser-induced breakdown spectroscopy