
Effect of Solid Heat Conduction on Accuracy and Efficiency in Steady-state Liquid-crystal Measurement of Flat Gas Film Heat Transfer Coefficient*
2021-12-17 03:23QichaoXueHongyuGaoXueingLiJingRen
风机技术 2021年5期
Qi-chao Xue Hong-yu Gao Xue-y ing Li Jing Ren
(Department of Energy and Power Engineering,Tsinghua University)
Abstract:Film cooling is an effective and widely used cooling method in industrial turbine.The heat transfer coefficient is one of the main characteristic of film cooling,which directly affects the wall temperature of the hot end part.The development of high-precision and high-efficiency measurement methods for the heat transfer coefficient of the film cooling is of great significance for the study of gas film cooling characteristics and cooling design.In this paper,the steady-state measurement method of flat film cooling coefficient is studied.Through the numerical simulation of Reynolds time-averaged (RANS),the influence mechanism of solid heat loss on the accuracy of the heat transfer coefficient measurement and the efficiency of the measurement process is studied.It is shown that the thickness of the back insulation material directly affects the solid heat conduction process on the back of the plate,which further leads to the influence of the accuracy of the test results and the time when the system reaches steady state(ie,measurement efficiency).For a specific film heat transfer coefficient measurement experiment,there is a range of insulation thicknesses that performs well.Based on this observation,this paper proposes a method to further balance the steadystate measurement accuracy and efficiency of the flat film cooling heat transfer coefficient.
Keywords:Film Cooing;Heat Transfer Coefficient;Steady-state Measurement;Liqiud Crystal;Solid heat Conduction
Nomenclature
Ttemperature(K)
qheat flow density
λ thermal conductivity
bthickness of solid
σ Boltzmann constant
ttime
pgas film hole spacing
dgas film hole diameter
α gas film hole jet angle
Mblow ing ratio
xcoordinates of the direction of the main flow
ylateral coordinates
rsteady-state time measurement coefficient
Superscripts
ccool air
∞main flow
fgas film
wwall
conduction solid coduction loss
radiation radiation loss
iarray
rconvective heat transfer
ssteady state
0initial state
1 Introduction
Gas turbine plays an important role in national economic development and national defense construction.Increasing turbine inlet temperature has a significant effect on improving turbine power and efficiency.It is necessary to develop turbine cooling technology because of the existence of the upper lim it of thermal temperature of materials.Film cooling is a widely used turbine cooling technology.The heat transfer coefficient is one of its main performance parameters,and the accuracy of measurement results is directly related to the reliability of turbine.
The measurement of heat transfer coefficient can be obtained by indirect measurement of temperature,so there are many measurement methods based on different means of temperature measurement.
Thermocouple is a kind of traditional temperature measurement technology,which is often used in the early stage of gas film cooling research.The advantage of this method is simple and reliable,but the disadvantage is that the error is large and the temperature field distribution is not continuous.Eriksen and Goldstein [1]used thermocouple temperature measurement method to study the heat transfer coefficients in a single row and rows.Liu [2]mentioned in the work of the gas film group of the institute of mechanics of the Chinese academy of sciences finished that in their experiment,22 pairs thermocouples were welded on the back to measure the temperature,and they did not consider the loss of heat conduction on the back of the gas film plate.
Liquid crystal measurement technology is a method to measure the distribution of temperature field.The advantage of liquid crystal measurement technology is that it can measure the two-dimensional distribution of temperature field,the accuracy and resolution are satisfactory,and it can be used repeatedly.The limitation lies in that the customization of liquid crystal materials is troublesome and the requirements for the environmental temperature range are strict.In China,Wang and He[3]put forward the idea of applying liquid crystal temperature measurement technology to heat transfer in the early stage.At this time,liquid crystal measurement technology mainly applied narrow-band liquid crystal transient measurement.Internationally,Vennemann and Butefisth [4]applied this technology to the measurement of temperature distribution in high-speed air-flow power heating devices.Ekkad et al]5],Ekkad &Han [6]used steadystate liquid crystal technology and transient liquid crystal technology to conduct a large number of studies.When using steady-state liquid crystal technology to measure the heat transfer coefficient of the gas film,they also ignored the consideration of heat conduction loss on the back of the gas film plate.Han [7]made a comprehensive and detailed summary of the measurement method of thermosensitive liquid crystal.Li [8]further developed the steady-state liquid crystal technology for measuring the heat transfer coefficient of the gas film.He believed that the deviation of heat conduction loss of the back should be taken into account in the measurement,and the experiment time was relatively longer after the insulation material was added to the back.
It can be seen that the increasingly strict requirements on the measurement accuracy make various error sources need to be considered,among which the back heat conduction loss has a significant impact on the result accuracy.The thickness of thermal insulation layer is an important factor influencing the heat conduction loss of the back,and it also affects the time needed to reach the steady-state condition,that is,the measurement efficiency.Measurement accuracy and measurement efficiency are important constraints in measurement experiments,especially in high-precision measurement.Therefore,this paper mainly adopts RANS numerical simulation,and studies the effect of solid thermal conductivity of back insulation material on measurement accuracy and measurement efficiency respectively in the test of steadystate liquid crystal measurement of flatbed gas film heat transfer coefficient.On this basis,it further explores a method to give consideration to both.
2 Experimental Methodology and Rig
2.1 Experimental Rig
The measurement experimental system is mainly divided into the mainstream wind tunnel system,the secondary cold airflow system,the experimental section and the measurement system.
The main wind tunnel system includes an 11kW centrifugal fan.The main flow air passes through an expansion section and a honeycomb rectifier section to reduce its velocity and turbulivity and make it uniform.The experimental section is then entered through a contraction section.At the exit of the contraction section,a turbulent grille is provided to ensure the uniformity of the incoming flow.The fan flow is controlled by adjusting its regulating valve.
Experimental section is a common gas film cooling plate,the arrangement of thermocouple in the mainstream and the cooling chamber to measure the mainstream and the temperature of the air conditioning,decorate in the gas film plate back thermocouple to measureTi,measuring the total pressure at the exit after the experimental section to calculate wind speed of the wind tunnel,the mainstream in the main section of a hot wire anemometer is used to measure the turbulence degrees,is set in the front of the gas film plate lights and cameras to record changes the color of the liquid crystal.
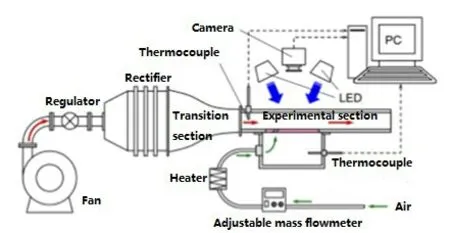
Fig.1 A diagram of experimental rig
A simple schematic diagram of the experimental system is shown in Fig.1 Fig.2 is the actual picture of the experimental section.
2.2 Experimental Methodology

Fig.2 A picture of experimental rig
In the measurement of the cooling heat transfer coefficient of the flat gas film,the hot film with constant thermal power and uniform distribution of power density is pasted on the gas film plate,and the heat transfer temperature difference between the wall surface and the gas film is caused by the heating of the hot film.A layer of thermal conductive black paint is sprayed on the hot film as the base color for displaying the liquid crystal,and a layer of liquid crystal with larger color width is sprayed on the black paint for temperature measurement.In the experiment,the cool air was kept at the same temperature as the main stream.
The measurement principle of heat transfer coefficient of flat film cooling can be seen intuitively from Fig.3 and Fig.4.
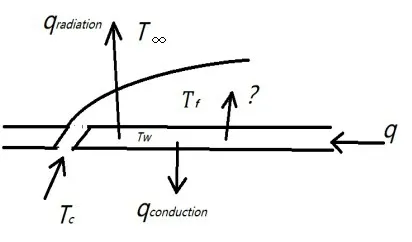
Fig.3 Principle diagram for measurring heat transfer coefficient of fat gas film

Fig.4 Diagram of Steady-state liquid crystal tech that measures heat transfer coefficient
Here,Tcis the air conditioning temperature,T ∞is the mainstream temperature,Tfis the temperature of the gas film,Twis the front wall temperature.The hot film needs to be pasted on the front of the plate,qis the thermal film heat flux density,qconductionis the loss of heat conduction on the back of the film,qradiationis the gas film board radiation loss.Obviously,qr=q-qconducion-qradiationis heat transfer by convection through a gas film.In the experiment,TcandT∞are controlled to keep the same follow state,so the gas film temperatureTfis equal to the cool air temperatureTc,andT∞can be used to represent the temperature at one end of the gas film in the gas film heat transfer.
The heat transfer process is described by governing equations(1)to(3):

Here,Tfis the gas film heat transfer coefficient,λ is the thermal conductivity of the gas film plate material,bis the thickness of the gas film plate,TwiandTiare the temperatures on the front and back of the gas film plate at different measuring points.According to the previous experience,we assume that the heat transfer in the gas film plate is dominated by the heat conduction in the thickness direction,while in the gas film area,the expression of the heat transfer coefficient is given by the Newton cooling formula.
The measurement of the whole experiment needs to be carried out under the condition of thermal steady-state.Here,we use the wide-band liquid crystal to measure the temperatureTwion the front of the plate and the thermocouple to measure the temperatureTion the back of the plate.Before using the liquid crystal to measure the temperature,we need to calibrate the liquid crystal.The purpose of calibration is to give the functional relationship between the liquid crystal Hue value and the temperature.A curve as shown in Fig.5 can be obtained by fitting the relationship with a cubic polynomial.In his research work,Li [8]gave the conclusion that there was no significant relationship between the liquid crystal thickness and the calibration result,so we could not strictly control the liquid crystal thickness in the experiment.

Fig.5 The relationship between liquid crystal temperature and color change
3 Numerical Methodology
In this paper,the numerical simulation used commercial software for flat film cooling heat transfer coefficient measurement experiment condition.A numerical simulation using ANSYS ICEM software to real the reconstruction of the geometric model establishment and numerical simulation of the grid division,using ANSYS FLUENT solver to numerical simulation example of solving and post-processing,this chapter mainly introduces the geometry model and solving domain and boundary condition,meshing of calculation and the numerical model for verification.
3.1 Solution Domain and Boudary Condition
In this paper,the simplified geometry of a classical flat film cooling experiment is used as the solution domain.
In the actual numerical simulation,the experiment plate has many gas film holes and its periodic performance is good.Therefore,the regions with the width of 6mm on the left and right sides of the middle line of the gas film plate were selected as the geometric solution domain.The solving domain are applied to solve the assignment with periodic boundary conditions on both sides.The solving domain includes three parts:the fluid part is named as "FLUID",the gas film plate part is named "PANEL" and is the part of the heat insulation material is named as"MATERIAL".After importing into ANSYS ICEM,the solution domain is shown in Fig.6.
The thermal conductivity of the film plate here is 0.2 W/(m·K),the thickness of the heat insulation material layer is among 0~25mm,the thermal conductivity is 0.02 W/(m·K),and the medium in the fluid domain is air.
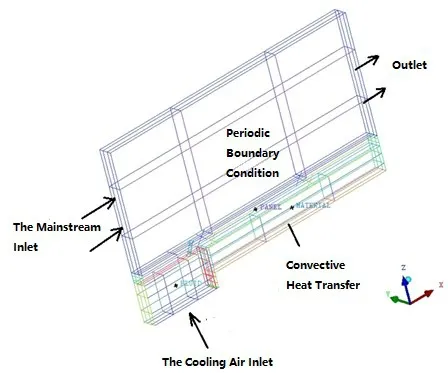
Fig.6 A simple diagram of the solution domain and the boudary condition
For grid-independent verification,the setting of boundary conditions is simply shown in Fig.6.The main flow and cool air inlet are given the static temperature and velocity,the outlet is given the static pressure condition,the thermal insulation material and air contact part is given the convection heat transfer boundary condition,the external wall is given the adiabatic boundary condition,the front of the inner wall degeller film plate simulation fixed power density hot film exists,and the rest are given the simple coupling relationship.The specific boundary conditions are given in Tab.1.

Tab.1 Main boudary condition
The requirement of wall y+in the SST turbulence model adopted in this paper is around 1.Therefore,a mesh encryption method is adopted on the wall surface of the fluid boundary layer.After several calculations and adjustments,y+distribution of the cooled plane close to the downstream of the gas film hole is approximately 1,and the thickness of the mesh of the bottom layer is about 0.013mm.The ratio of adjacent mesh lengths in the same topology block is set to be no more than 1.2.At the same time,due to the use of the o-grid generating method for the circular gas film hole,which can significantly improve the quality of the circular channel mesh,the qualified mesh quality is finally obtained.
Fig.7 shows in some key parts for the division of grid,it can be seen that the quality of the grid is better,the disadvantage is that in the cold air cavity and mainstream part Ogrid extension is too long,cause some unnecessary grid refinement,led to a slight computational resources waste.However,no great influence for the calculation results.This topology partitioning method is still used.

Fig.7 Mesh Details
In this paper,the grid independence is verified before the numerical simulation.Under the condition that the wall surface y+is approximately 1,the FLUENT ANSYS solver and the grid generation method as shown above are used to calculate three grids with the number of grids at 0.6 million,1.3 million and 2.7 million,respectively.The steady-state temperature of the front center line of the air film plate was used as an independent parameter,and the boundary conditions were selected from Tab.1 when the inlet velocity of cool air was 0.4908m/s.The results are shown in Fig.8.

Fig.8 Steady-state temperature distribution of the center line on the front of plate
As can be seen from Fig.8,in the simulation of the far downstream of the gas film hole,the simulation of the three mesh Numbers almost completely overlapped.For the simulation at the close downstream of the gas film hole,the three are slightly different.However,in the volatility of the temperature distribution,the characteristics are the same.Therefore,the information presented by the three meshes in the simulation of heat transfer and flow is essentially the same,with slight numerical differences.Therefore,all three grids can meet the requirements of the numerical simulation task.Considering the computing efficiency,this paper uses the grid number of 0.6 million to carry out the subsequent computing work.
3.2 Verification of Numerical Results
3.2.1 Verification by Correlations
The correlations of heat transfer coefficients published by Baldauf [9]are used in this paper to verify the results.Due to the complexity of the correlations,they are not listed here
A curve is generated from the correlation to show the change of the laterally average heat transfer coefficient downstream of the gas film hole with x/d in range of 0~30.Therefore,in the verification,the numerical simulation prediction results should be processed in the same way,and such curves should be obtained,and the two should be compared.Here,p/d=4,hole jet angleα=60°,and blowing ratioM=1 were used for comparison and verification.The result is shown in Fig.9.

Fig.9 Comparison of correlation results with numerical results
It can be observed that there is a big difference between the two curves in the figure.Through analysis,in the most upstream region,when thex/drange is 0~5,the error is 15%~22%,and the closer it is to the gas film hole,the greater the error is.Whenx/dis greater than 5,the error is 9%-15%.Therefore,it can be considered that the numerical model can not well reflect the accurate description of this physical problem quantitatively.But they are similar in trend,and can reflect the characteristics of the fluid-thermally coupled problem qualitatively.
The numerical model meets the expected requirements.In the work of Liu[10],it can also be seen that in the numerical simulation of gas film cooling,the gas film cooling efficiency also has such a result that the upstream deviation is large and the downstream deviation is small,and the average error of the gas film cooling effect is around 15%.The average error in this paper is less than 15%.
4 Effect of Solid Thermal Conductivity on Experimental Accuracy
In this paper,the research region is shown in Fig.10 It is a surface of the gas film plate located downstream of the gas film hole and adjacent to the gas film hole.Thex/drange is 0 to 30,and they/drange is-2 to 2.The area of this region is about 1.08×10⁻³m2.Taking the insulation material thickness of 20mm as an example,the numerical prediction result of heat conduction loss heat flux in the back of this area is obtained by surface integration.The heat conduction loss is 0.027 W.The error is about 1.27%,which indicates that the insulation material with a thickness of 20mm has a good insulation function.

Fig.10 Research region
For the range of insulation material thickness from 0 to 25mm,six points:0,5,10,15,20,25(mm)were selected for the study.The total heat conduction loss power of the back of the study area can be obtained by surface integral.After the normalization treatment,the results as shown in Fig.11 were obtained.As can be seen from the figure,with the increase in the thickness of the insulation material,the power of solid heat conduction loss is decreasing,and the decreasing trend is also slowing down.When the thickness of thermal insulation material is greater than 10mm,the increase of thickness is not particularly drastic for the improvement of thermal insulation effect,and the decline trend is obviously slowed down.Further processing results in the ratio of lost thermal power to total power as shown in Tab.2.
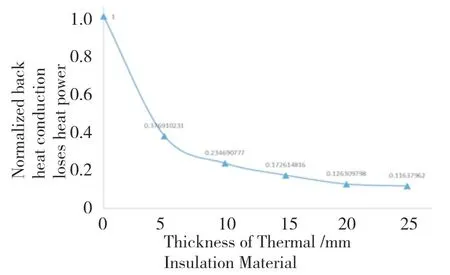
Fig.11 Normalized back heat conduction loss power

Tab.2 Heat conduction loss of solid under different thickness of insulation material
As can be seen from the results in Tab.2,when the thickness of thermal insulation material is greater than 10mm,for every 5mm increase in the thickness,the proportion of solid heat conduction loss decreases by less than 1%.At this point,the effect of increasing the thickness of the insulation layer has become less obvious.However,the percentage of improvement effect between the two adjacent items can be found that when the insulation layer thickness is greater than 20mm,the percentage of improvement is less than 10%,significantly less than the previous item.At this point,the thermal insulation effect of increasing the insulation layer thickness is limited.This phenomenon can also be observed from the change of the steady-state temperature at the monitoring point on the back with the thickness of the insulation material as shown in Fig.12.It is easy to judge from the one-dimensional heat conduction formula that the decrease of lost heat power directly leads to the decrease of the average temperature difference between front and back.The heat source is on the front of the experimental plate.Therefore,the steady-state temperature on the back rises.When the thickness of the insulation material increases,the steadystate temperature keeps rising,and the rising trend keeps slowing down.When the thickness is greater than 20mm,the rise of the steady-state temperature is already around 0.1℃,which is negligible.
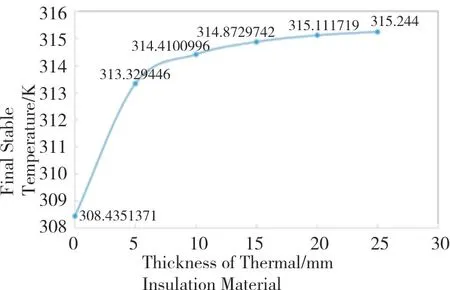
Fig.12 Final steady-state temperature under different material thickness
5 Effect of Solid Thermal Conductivity on Experimental Efficiency
The research is carried out when the thickness of insulation material is six value points.The time step is 2s.The transient numerical simulation is performed to obtain the prediction results for the process of heat conduction.The temperature of several points on the back of the experimental plate was taken as the monitoring basis.Since the actual experimental time was 30~40min,the temperature after 60min was taken as the final steady-state temperature.When the temperature of the monitoring point met the conditions,the experimental conditions were deemed to have reached steady state.Fig.13 shows the simulation results ofp/d=4,α=60°,M=2.0,and insulation material thickness of 20mm.It can be seen from the figure that the temperature change of each monitoring point is basically the same.Thus,the temperature stability of one of the points can be used as the criterion for the system to reach thermal steady state.

Fig.13 Temperature of the monitoring point changes with time
The temperature atx/d=7.5 is monitored.The initial temperature isT0=300K,and the steady-state temperatureTsis the average value obtained from 20 data points near 3600s.The time when the monitered point temperatureTreaches the temperatureT0+r(TS-T0) is defined as the steady-state timets.Thervalue in the expression is a scale value that can be selected by the user according to the accuracy of the experiment.
The three values ofr=0.995,0.999 and 0.9995 were taken to judge the steady-state time,and the results in Figure 14 were obtained.
By observing the curve in Figure 14,we can see that the trends of the three curves are consistent.The closerrvalue is to 1,the longer the steady-state time is defined.The results show that there is no essential difference in the steady-state time estimation with differentrvalues,and the steady-state time does not have an obvious influence on the variation of insulation material thickness.

Fig.14 Steady-state time under different material thickness
The steady-state time decreases gradually as the thickness of the insulation material decreases,and this change is non-linear.As the thickness increases,the absolute value of the rate of change decreases,and the influence of thickness on the steady-state time decreases.When the thickness is large,the increase of thickness will not significantly prolong the steady-state time.On this result,due to gas film plate inside solid heat conduction process is similar to one dimensional solid heat conduction(similar does not mean the same here,the author also studies showed that 3-dimension heat conduction effect of intraplate evident when heat insulation material thickness is larger),the expression for the internal temperature distribution of a semi-infinite body under constant heat fluxcan be used to analyze the reason.By changing the thickness coordinatexand keeping the temperature constant,it can be found that the corresponding time valuethas a similar change trend.In short,this formula shows that,when the thickness increases,the influence of thickness on temperature distribution decreases gradually,because the steady-state time reflects the degree of influence of hot film on the whole insulation material.Therefore,it is easy to understand that when the material thickness increases,the change of steady-state time becomes less sensitive to the thickness.
When the thickness of the insulation material is less than 5mm,reducing the thickness has a very significant effect on reducing the steady-state time.However,when the thickness is between 5 and 20mm,the stable change is close to linear,while when the thickness is greater than 20mm,increasing the thickness has little effect on the steady-state time.
6 Conclusions
The research in this paper shows that the thickness of thermal insulation material can significantly affect the accuracy and efficiency of the measurement experiment for the heat transfer coefficient of flat gas film.The thickness of thermal insulation material increases,the heat conduction loss of the back decreases.However,when the thickness is large,the decreasing trend becomes flat,and the effect of thickness on the decreasing effect becomes insignificant.When the thickness is greater than 20mm,the effect of increasing the thickness is very limited,and the effect on the steady-state time is not obvious enough.Therefore,the maximum meaningful thickness is around 20mm.When the thickness of insulation material is reduced,the experiment time is shortened accordingly.When the thickness is small,the effect of shortening the stability time is more obvious.However,when the thickness is less than 10mm,the heat conduction loss of the back becomes more obvious.In the experiment,it is advisable to choose the thickness of insulation material between 10 and 20mm if we want to ignore the influence of heat conduction loss on the back without having a huge impact on the accuracy of the experimental results.

Fig.15 Comparison of Experimental Results and Correlation
In addition,this paper also carried out several experiments including different blowing ratios on the experimental rig mentioned above.The experimental result that the experimental condition is:p/d=4,hole inclination angle=60°,blowing ratioM=1,and the thickness of insulation materialb=20mm is shown in Fig.15 As the comparison of the experimental results and correlation shown,whenx/drange is 0~5,the error is no more than 15%;whenx/drange is no more than 5%.It can basically meet the requirements of the experiment.The steady-state time is about 40 minutes.Considering that the complete cooling time between two experiments with different conditions is about 20 minutes,when doing experiments in batches,each experiment takes less than an hour.Under such circumstances,it is possible to complete a batch experiment quickly.
