
Thermo-Rheological Structure and Passive Continental Margin Rifting in the Qiongdongnan Basin,South China Sea, China
2022-02-24 08:11LIChaoyangJIANGXiaodianandGONGWei
LI Chaoyang JIANG Xiaodian andGONG Wei
Thermo-Rheological Structure and Passive Continental Margin Rifting in the Qiongdongnan Basin,South China Sea, China
LI Chaoyang1), JIANG Xiaodian2),3), andGONG Wei2),3),*
1),,124221,2),,,,266100,3),,266237,
To investigate the thermo-rheological structure and passive continental margin rifting in the Qiongdongnan Basin (QDNB), thermo-rheological models of two profiles across the western and eastern QDNB are presented. The continental shelf of western QDNB, having the lowest crustal extension factor, is recognized as the initial non-uniform extension crust model. This regime is referred to as the jelly sandwich-1 (JS-1) regime, having a lower crustal ductile layer. The oceanward part of the western QDNB changes from the relatively strong JS-1 to the weak crème brûlée-1 (CB-1) regime with a significantly thinned lower crust. However, the crustal extension in the eastern QDNB is significantly higher than that in the western QDNB, with conjugate faults extending deep into the lower crust. The central depression zone of the eastern QDNB is defined as the much stronger JS-2 regime, having a brittle deformation across the entire crust and upper mantle and characteristics of a cold and rigid oceanic crust. Unlike the widespread lower crustal high-velocity layers (HVLs) in the northern margin of the South China Sea, the HVLs are confined to the lower crustal base of the central depression zone of the QDNB. The HVLs of QDNB are the results of non-uniform extension with mantle underplating during the lower crustal-necking stage, which is facilitated by the lower crustal ductile layer and derived by mantle lateral flowing. The gigantic mantle low-velocity zone related to the Red River Fault should be a necessary factor for the east–west differential margin rifting process of QDNB, which may drive the lateral flowing in the mantle.
Qiongdongnan Basin; thermo-rheological structure; continental margin rifting; high-velocity layer
1 Introduction
As the largest continental marginal sea along the East Asian continental margin, the South China Sea (SCS) is the key region of interaction between the Pacific and Te- thyan Tectonic Domains (Guo., 1983; Sun., 2005; Zhu., 2015; Wang., 2020). Three major hypo- theses have been proposed to explain the rift initiating mechanism of the SCS: 1) Tectonic extrusion related to the sinistral motion on the Red River Fault (RRF) (Tapponnier., 1986); 2) slab-pull arising from subduction of the proto-SCS (Taylor and Hayes, 1983; Hall, 2002), and 3) the opening of the SCS initiated by the Hainan plume (Xu., 2012). It is generally accepted that the adjacent areas of the SCS could be divided into collision- extrusion and proto-SCS slab-pull tectonic provinces (Renand Lei, 2011). Situated in the northwestern SCS continental margin at the intersection of two tectonic provinces, the Qiongdongnan Basin (QDNB) shows obvious variations in the west–east crustal extension, and preserves a wealth of information for understanding the lithospheric extension and breakup mechanism of the SCS (Fig.1; Zhang., 2009; Zhang., 2019). The difference in the west–east lithospheric extension of the QDNB appears to be related to lateral variation in the gigantic mantle low- velocity zone along the RRF, a lower crustal high-ve- locity layer (HVL), and detachment faults extending deep into the lower crust (Shi and Zhou, 2000; Yao., 2005; Zhang., 2007; Franke, 2013; Qiu., 2019). The Changchang Sag of the eastern QDNB features an extre- mely thin crystalline crust, an HVL occurring at the crus- tal base of the central sag, and uncorrelated magmatic activities with the rifting of SCS suggested by deep reflection seismic profiles. Accordingly, the Changchang Sag is generally regarded as part of the ocean-continent transition zone along the northwestern margin of the SCS, which has been identified as a non-volcanic or magma- poor passive margin (Wu., 2001; Qiu., 2003; Gao,2015; Zhou, 2018). However, mantle serpentinization, which is usually regarded as one of the typical features occurring at magma-poor passive margins, is not observed in the northwestern margin of the SCS (Dean., 2000; Li, 2011; Ren., 2015). The lower crustal HVLs, which are also widely observed beneath the eastern part of the northwestern margin of SCS, are often recognized as the makeable feature of volcanic margins (Gao., 2016). Numerous studies have been conducted on the origin of the lower crustal HVLs and their relationship with the pro- cess of margin rifting (Nissen., 1995; Ding., 2016, 2018; Lei and Ren, 2016; Wang, 2020). In addition, the tectonic setting of the western QDNB is also undefined. Although its direction of lithospheric expansion is similar to that of the eastern QDNB, its rifting stages have been significantly remolded by the boundary fault of the RRF (Yuan., 2008; Luan and Zhang, 2009; Liu., 2015). Research on the difference in the west–east lithospheric extension of the QDNB could provide additional information toward an understanding of the passive continental margin rifting process.
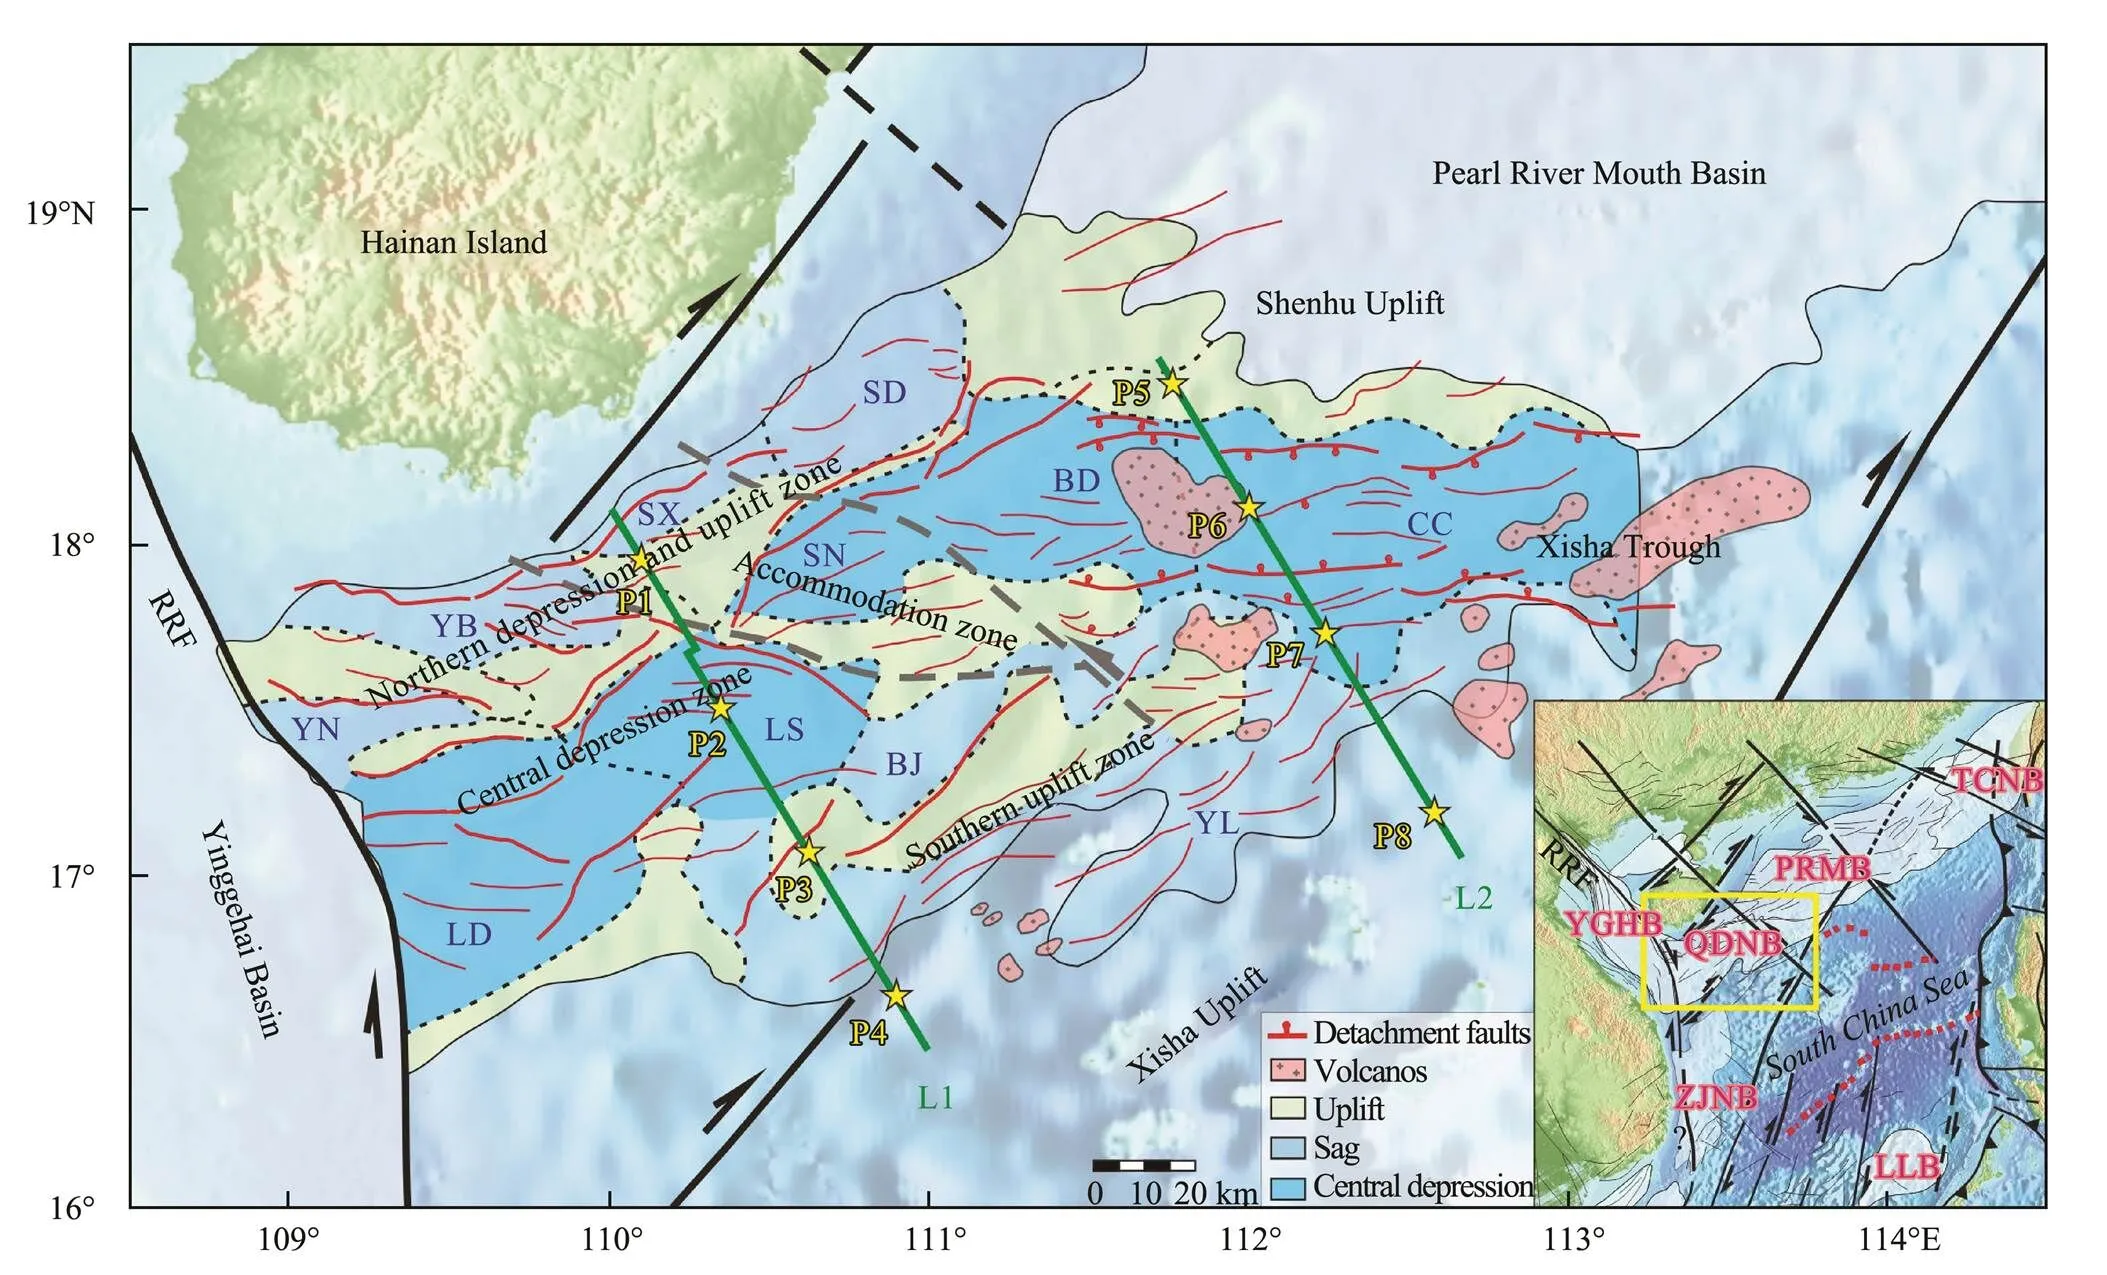
Fig.1 Tectonic map of Qiongdongnan Basin and the surrounding regions. Green lines (L1 and L2) represent profiles constructed for examining the thermo-rheological structures (Qiu et al., 2014). Yellow stars denote typical locations at which the lithospheric rheological strength was calculated, as shown in Figs.7 and 8. YGHB, Yinggehai Basin; QDNB, Qiongdongnan Basin; PRMB, Pearl River Mouth Basin; TXNB, Taixinan Basin; ZJNB, Zhongjiannan Basin; LLB, Lile Basin; RRF, Red River Fault; YN, Yanan Sag; YB, Yabei Sag; SX, Songxi Sag; SD, Songdong Sag; LD, Ledong Sag; LS, Lingshui Sag; SN, Songnan Sag; BD, Baodao Sag; CC, Changchang Sag; BJ, Beijiao Sag; YL, Yongle Sag.
Lithospheric rheology plays a key role in controlling the behavior of multiple-phase rifting of passive margins (He., 2001; Liu., 2006; Peron-Pinvidic and Ma- natschal, 2019). According to the different rheological struc- tures of the lithosphere, the non-volcanic passive margins have been divided into two end-members known as the crust-mantle coupled model and the crust-mantle decoupled model (Huismans and Beaumont, 2011; Ren., 2015). The former proposes one hard, brittle layer of crust and upper mantle and the breakup of the crust before the mantle lithosphere with exposure of serpentinized mantle li- thosphere. The latter considers a sandwich form with a soft, ductile lower crust occurring between two hard layers, leading to non-uniform extension with significant delays in the crustal breakup and HVL and magmatic under- plating (Huismans and Beaumont, 2011; Ren., 2015). In addition, varying amounts of ductile behavior also result in differences in the extent of lithospheric thinning (Zhang., 2007; Tetreault and Buiter, 2018). Therefore, the construction of rheological structures is effective for exploring the dynamic deformation occurring at the north- western margin of the SCS.
Owing to difficulties associated with deep-water explo- ration, most studies on the lithospheric thermo-rheological structure focus on the shallow-water areas of the Pearl River Mouth Basin (PRMB), Xisha Trough, or Yinggehai Basin (YGHB) (Zhang and Wang, 2000; Shi., 2002; Tang., 2018). Reliable thermo-rheological structuresacross the QDNB have been modeled on the basis of abundant crustal-scale structural models constructed from high resolution seismic reflection in addition to heat flows calculated from deep-well drilling (Qiu., 2014, 2019; Shi., 2017). In this study, the results of previous research combined with the two thermo-rheological profiles calculated across the western and eastern QDNB are used to evaluate the continental margin rifting process of the SCS.
2 Geological Setting
Located in the northwestern passive rifted continental margin of the SCS, the QDNB is surrounded by PRMB extension structures to the east, the YGHB strike-slip sys- tem to the west, and the Xisha Trough to the southeast (Fig.1; Li., 2012; Wang., 2014). With the combined control of the two tectonic provinces, the QDNB fault system is divided into two parts by the accommodation of a strike-slip zone, NE-trending normal faults to the west, and nearly W–E-trending detachment faults to the east (Zhang., 2019). Controlled by the stretching stress introduced by the rollback of the paleo-Pacific plate and the slab pull of the paleo-SCS, the QDNB entered the syn-rift stage during the late Cretaceous (Doust and Sum- mner, 2007; Yin, 2010). With the 500–700km sinistral slipof the RRF and the seafloor spreading of the SCS at nearly 34–32Myr, the QDNB exhibits a different W–E tectonic rifting process that activated the central accommodation zone (Barckhausen., 2014; Xie., 2015). In response to the ridge jump of the SCS at 23Myr, the strike- slip inversion of the RRF and the SCS spreading ended at about 17Myr, and the western and eastern QDNB successively entered the post-rift stage (Wang., 2006; Sun., 2009; Xie., 2015). The reactive 5.3–57km dextral slip of the RRF at 5Myr contributed to the rapid subsidence of the western QDNB (Guo., 2001; Yuan., 2008; Cai., 2010; Wang., 2011). Therefore, the different rifting processes occurring in the western and eastern QDNB show genetic connection with the RRF strike-slip system and extensional movement related to the SCS spreading (Li., 2012; Gong., 2017).
For the lithospheric structure, deep seismic reflection profiles suggest a roughly southeastward decreasing trend from 30km at Hainan Island to 13km at Changchang Sag with a Moho upheaval of 4–6km at the central depression zone (Zhang., 2007; Tong., 2009; Zhao., 2011). Similarly, the entire crustal extension factor of the central depression zone is 1.9–3.2, which is higher than that in the surrounding areas showing a roughly west-to- east decrease (Zhang., 2010). Notably, depth-depen- dence extension is also obvious throughout the QDNB, and the contribution of the lower crust is significantly greater than that of the upper crust. This suggests that the plastic flow of the lower crust is related to mantle exhumation (Zhang., 2007; Tong, 2009; Zhang., 2010). Furthermore, igneous petrology and geophysical data indicate that the continental marginal rifting and mantle exhumation were derived likely from the extensional collapse of the Cathaysian continental marginal orogenic belt (Zou, 2011). However, the seismic tomography and analog modeling indicate a NW-trending gigantic mantle low-velocity zone 200km wide from the RRF to the SCS, suggesting another mechanism driving the lithospheric rifting and mantle exhumation (Sun., 2005; Yao., 2005). In contrast to the widespread HVL in the northern margin of the SCS, a 2–6km-thick anomalous HVL has been investigated only beneath the central depression zone of the QDNB. This layer could be considered as mantle underplating or the residual mafic layer of the extended Cathaysian lower crust (Zhang., 2009; Qiu., 2014). The rheological properties of the HVL remain unclear. It has been defined as a strong, brittle layer occurring at the crustal base of Xisha Trough (Shi., 2002) and as a weak, ductile layer at the PRMB (Hu., 2020). Therefore, the construction of thermo-rheological structures in this study will provide a better understanding of the origin of the HLV and the continental margin rifting of the SCS.
3 Data and Methods
3.1 Data
The data used to construct the lithospheric thermo-rhe- ological model in this study are based on surface heat flow, P-wave velocity from seismic reflection profiles, and rock density structures inversed by gravity anomalies.
The heat flow data include the heat flow probe and oil- gas drilling data of 154 observations reported previously (Zhang and Wang, 2000; Mi., 2009; Li., 2010; Wang., 2014; Shi., 2017). The heat flow map of the QDNB and its adjacent area was compiled with 0.5˚× 0.5˚ grid accuracy (Fig.2). Significant seaward variations include a low heat flow of 50–60mWm−2in the northern depression and uplift zone to a high heat flow of >70mWm−2in the central depression zone and southern uplift zone. Different from the roughly seaward increasing trend, the Xisha Uplift shows a lower heat flow of 50–70mWm−2, which is similar to that in the northern continental shelf. Along the NE-trending high heat flow near the central depression zone, the highest heat flow range of 85–105mWm−2was observed in the eastern QDNB near the central accommodation zone, Shenhu Uplift, and Xisha Trough.
For the P-wave velocity, two deep seismic reflection pro- files across the western and eastern QDNB were used to constrain the structure, velocity, and composition of the crust and upper mantle (L1 and L2 in Figs.1 and 2; Wang., 2013; Qiu., 2014). According to the initial crustal structure model taken from seismic refraction profiles, well constraints from standard velocity-density relationships, and high resolution free-air gravity anomalies, the density model was inversed along profiles L1 and L2 (Figs.3 and 4; Zhang., 2009; Qiu., 2014; Gao, 2015). Corresponding to the lower crustal HVLs>7.0kms−1, significant density anomalies >2.80gcm−3were also observed at the crustal base of the central depression zone. This layer is strongly thinned and was likely underplated by magma during margin rifting (Fan., 2019). Notably, the scope of the HVLs is more widespread than that of the high-density bodies owing to the limited resolution of the density inversion.
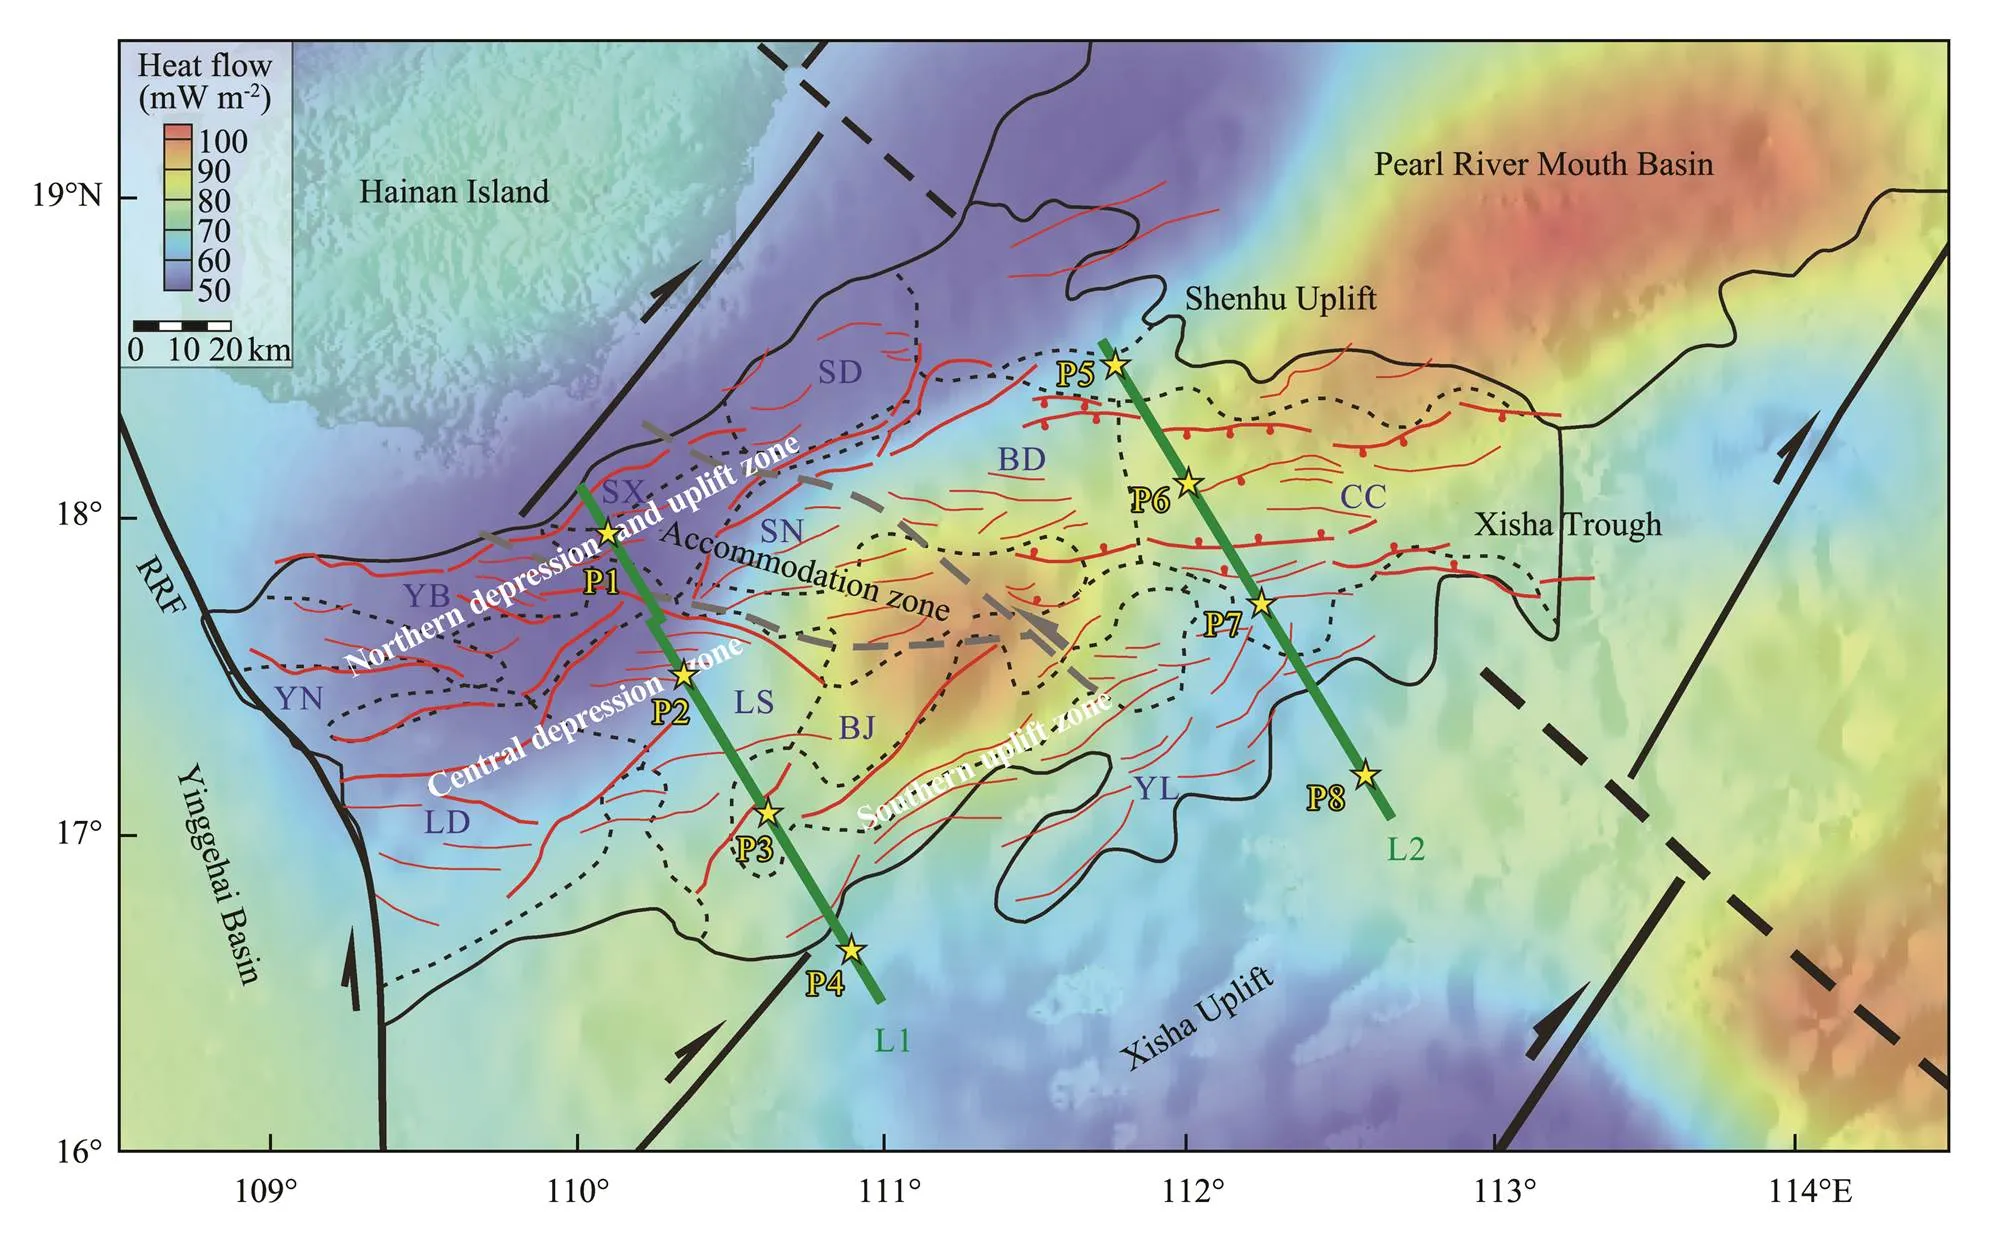
Fig.2 Heat flow map of Qiongdongnan Basin and the surrounding regions (Zhang and Wang, 2000; Mi et al., 2009; Li et al., 2010; Wang et al., 2014; Shi et al., 2017). Lines, stars, and tectonic units are consistent with those described in Fig.1. NDUZ, northern depression and uplift zone; CDZ, central depression zone; SUZ, southern uplift zone; XSU, Xisha Uplift.
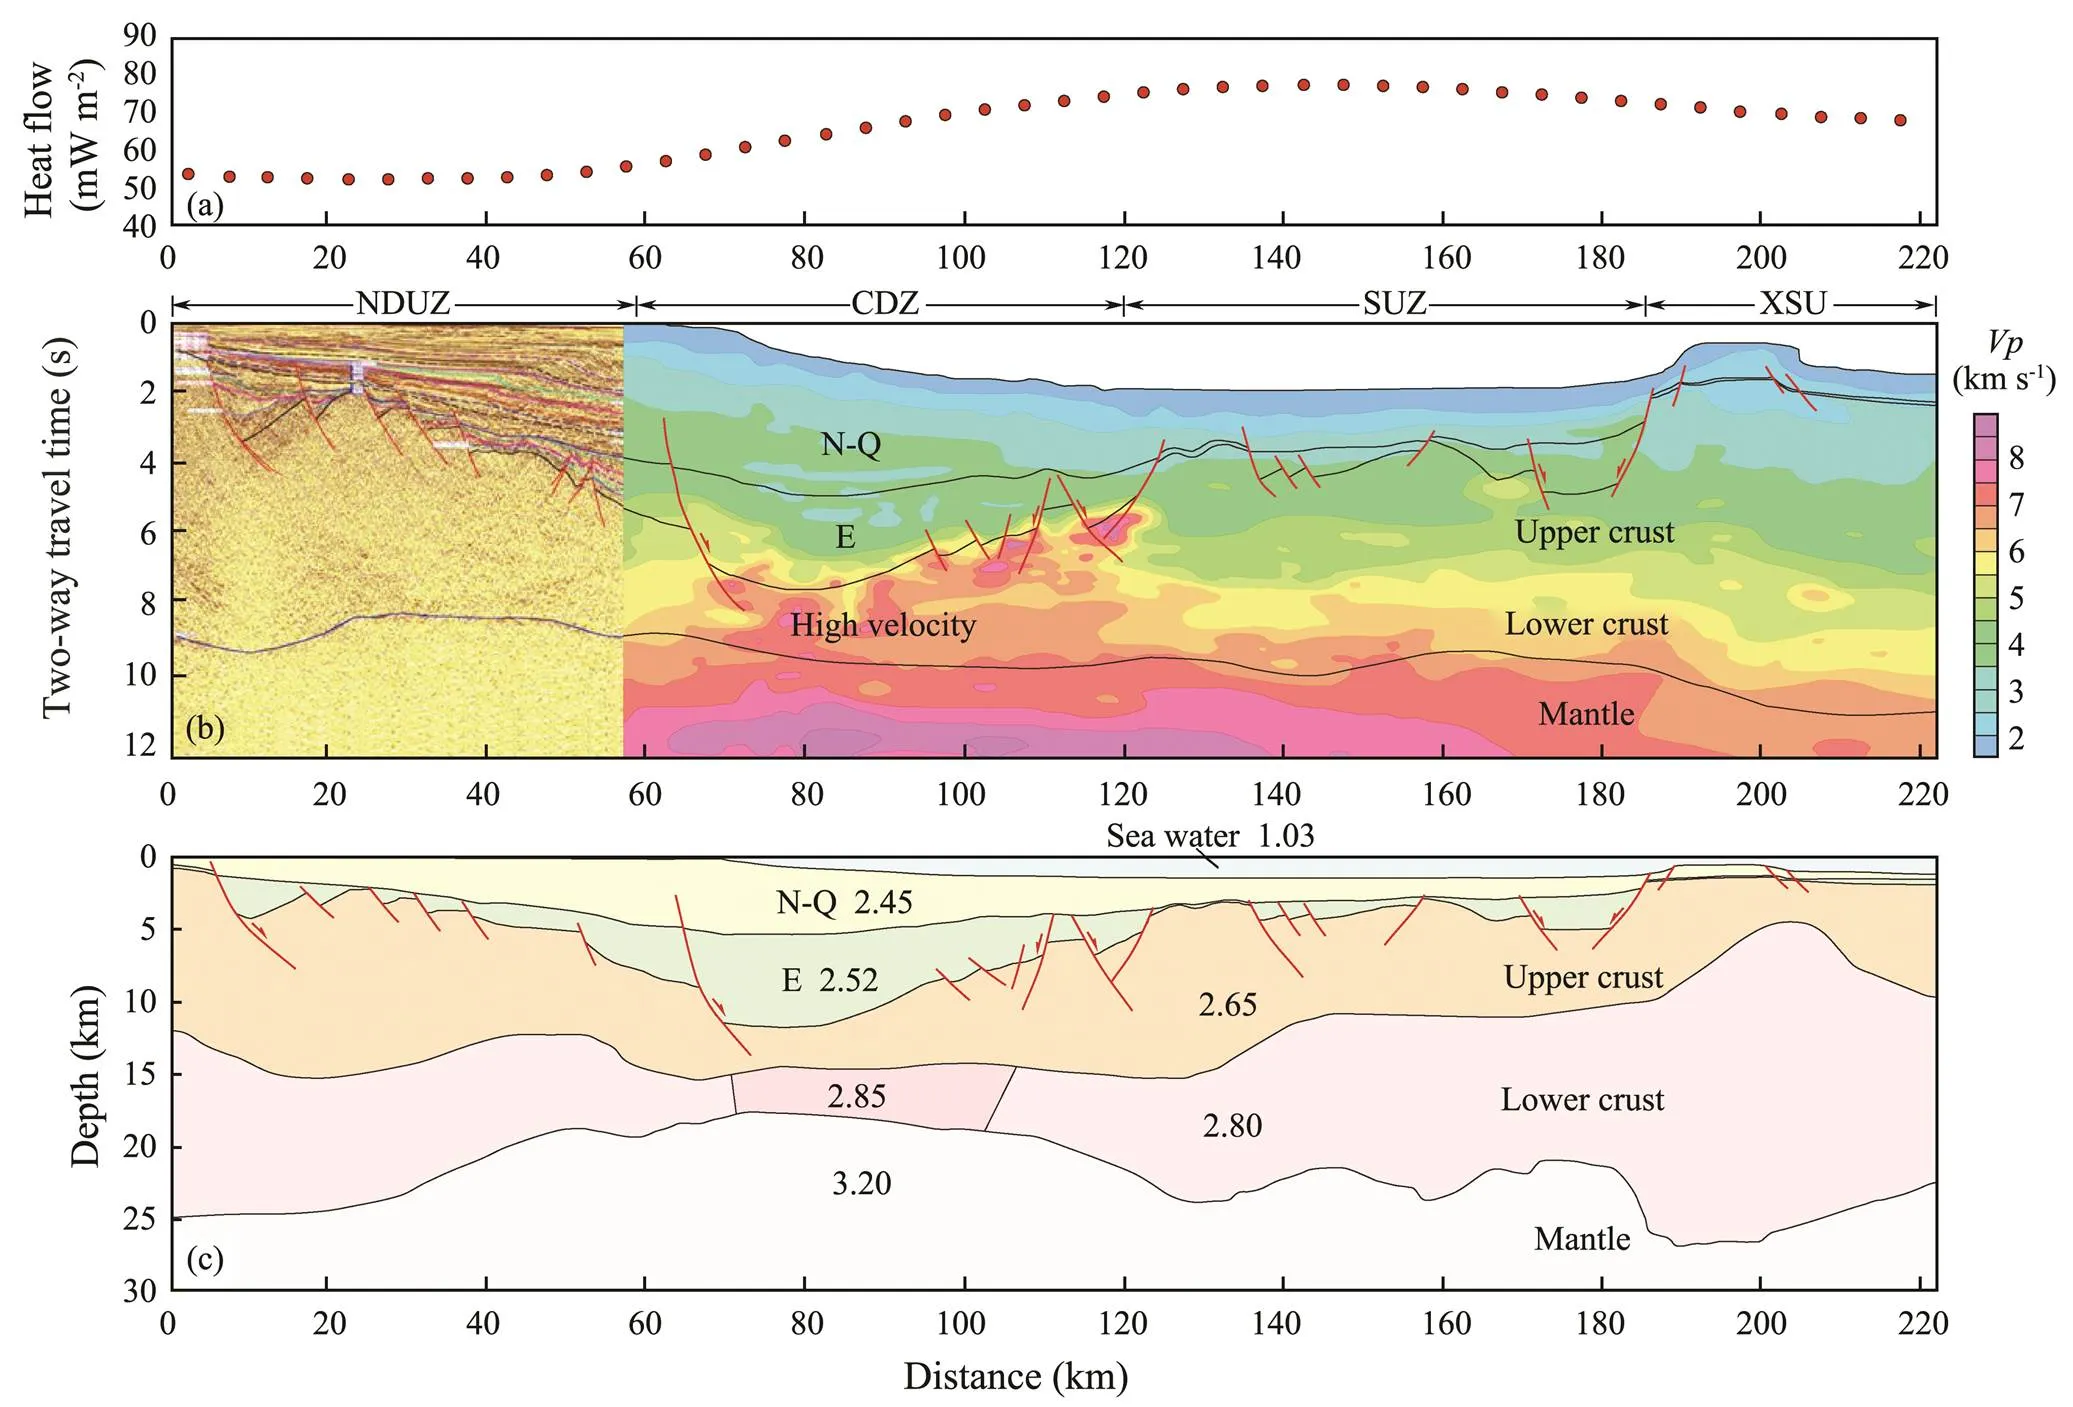
Fig.3 (a), Surface heat flow along profile L1 digitized from Fig.2. (b), Geological interpretation from multichannel seismic reflection and P-wave velocity (Vp) structure from the deep seismic reflection across profile L1 (Qiu et al., 2014). (c), 2D density structure of the crust and upper mantle along profile L1 (Qiu et al., 2014). The location of profile L1 is shown in Fig.1. E, Paleocene–early Oligocene; N–Q, late Oligocene–Holocene. NDUZ, CDZ, SUZ and XSU are same as those in Fig.2.

Fig.4 (a), Surface heat flow along profile L2 digitized from Fig.2. (b), Geological interpretation and P-wave velocity (Vp) structure from the deep seismic reflection across profile L2 (Qiu et al., 2014). (c), 2D density structure of the crust and upper mantle along profile L2 (Qiu et al., 2014). The location of profile L2 is shown in Fig.1. E, Paleocene–early Oligocene; N–Q, late Oligocene–Holocene. NDUZ, CDZ, SUZ and XSU are same as those in Fig.2.
3.2 Thermal Model
We adopted a four-layer model consisting of the sedimentary, upper crust, lower crust, and upper mantle layers (Ma., 2012; Zhang., 2017) based on interpreted seismic reflection profiles. The two-dimensional (2D) steady heat conduction equation was used to calculate the temperature given by Zhang. (2016) as
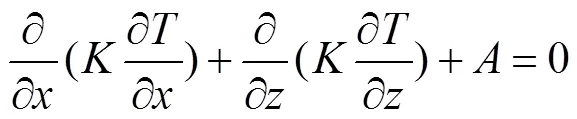
whereis temperature (K),is depth (km),is thermal conductivity (WmK−1), andis heat production (μWm−3). Furthermore,
, (2)
where0is the depth of the seabed,zis the depth of bottom boundary, at 50km in the models,0is the left boun- dary,1is the right boundary,0is the surface temperature at the seabed,0is the surface heat flow (mWm−2), andQis the bottom heat flow (mWm−2) at the depth ofz.The 2D calculation of temperature distribution was per- formed using COMSOL Multiphysics 5.5 software and was solved by optimizingQto fit the surface heat flow0. The root-mean-square error (RMSE) between inversion surface heat flow and observation surface heat flow is only 1.74 and 3.18 along profiles L1 and L2, respectively (Figs.5a and 6a). Ifzis equal to the depth of Moho, theQis defined as the mantle heat flow. The crustal heat flow (Q) could be obtained by simple subtraction of surface heat flow0) from mantle heat flow (Q). The ratio between them (QQ) is used to describe the vertical distribution of the heat flow within the lithosphere and to estimate the main heat flow source.
The thermal conductivityand the heat production rateare the basic thermophysical parameters of the li- thospheric thermal structure (He, 2014). Because of the thick sediments in the basin, we assumed thatand,acquired from well tests, remained constant in the sedimentary layer (Cai., 2019). For the deeper crust,is a function of temperature; the temperature effects are listed in Table 1 (Shi., 2002). The rate of heat production,, is also inhomogeneous within the lithosphere. The most widely accepted model for heat production within the crust is the exponential decrease model (Cermák, 1989):
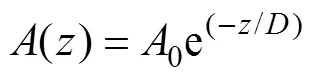
whereis the characteristic depth within which most of the radiogenic elements are distributed (Zhou., 2017). Owing to its poor applicability, the exponential decrease model was used only for the top 10km of the upper crust, referred to as the UTK layer; the heat production for the middle and lower crust was estimated according to the crustal velocity (Tang., 2018). These values are also listed in Table 1.
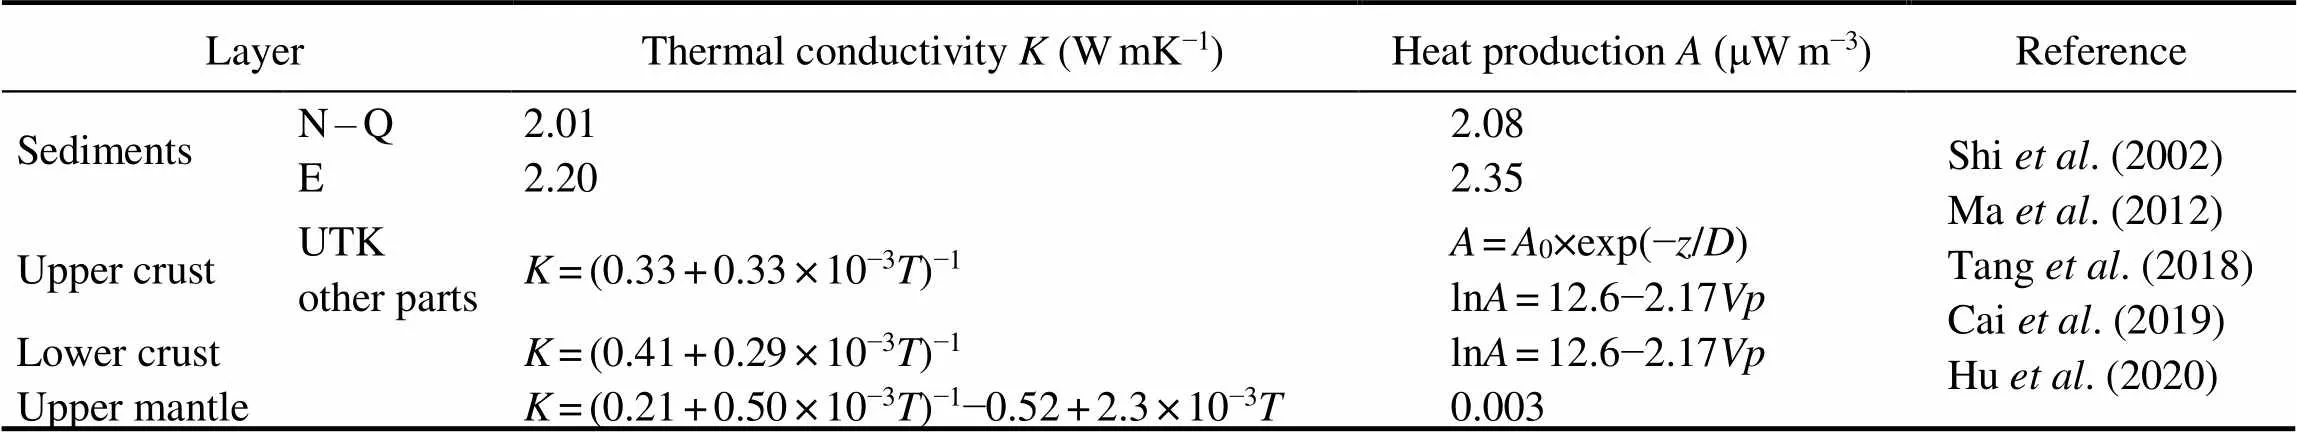
Table 1 Parameters of thermal conductivity and heat production of the lithosphere used in geothermal calculations
3.3 Rheological Structure
Yield stress envelopes (YSEs) are widely used to characterize the rheology of the lithosphere (Jackson, 2002; Burov and Watts, 2006; Burov and Diament, 2011; Zhang, 2013b). The rheological structure can be divided intoupper brittle and lower ductile parts; the brittle regime for most rocks can be adequately described by Byerlee’s law (Ranalli, 1991) in the calculation of lithospheric strength:
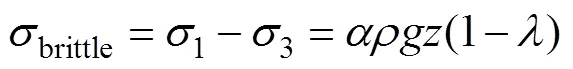
where1and3are the maximum and minimum principal stresses, respectively;is the average density set by the density model (kgm−3);is acceleration owing to gravity (ms−2);is the pore fluid factor; andis a parameter depending on the type of faulting, with values of 3, 1.2, and 0.75 used for thrust, strike-slip, and normal faults, respectively.
The study area is clearly controlled by normal faulting; hence, α was set to 0.75. The acceleration owing to gra- vityand the pore fluid factorwere set to typical values of 9.81 and 0.37, respectively (Wang, 2001). The creep strength for plastic deformation in the crust is dominated by the power-creep law (Kirby, 1983):
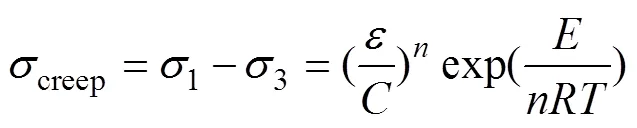
whereis the strain rate depending on geological data;is temperature;is the gas constant, set as 8.13447Jmol−1K−1; and,, andare material rheological parameters determined by the laboratory (Wang, 2001).
The total strength of the lithosphere with depth-depen- dent rheology is estimated by integrating the yield envelope (Williams., 2011):
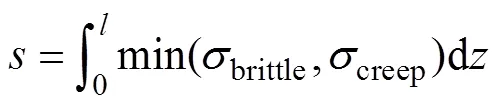
whereis the lithospheric strength per unit width andis the thickness. Therefore, we could obtain the curve sharp of YSEs by calculating the value of lithospheric strength ().
Owing to the clear inhomogeneous deformation in the study area, the strain rate was set roughly as 10−16, following Hu. (2020). The creep parameters were selected by careful testing considering the significant function of HVLs for the lower crust strength. Compared with the mafic lower crust in the eastern part of the northern margin of the SCS, the lower crust beneath the QDNB is generally described as an intermediate composition (Shi., 2002; Wang, 2007). The values of the rheological parameters used in the construction of the rheological model are given in Table 2.
4 Results
4.1 Temperature Distribution Within the Lithosphere
The calculated temperature distribution of the lithosphere along profiles L1 and L2 with surface heat flow, heat flow from the deep mantle, and the ratio between them are shown in Figs.5 and 6. Obvious lateral changes in a temperature controlled by the surface heat flow ranged from the northern continental shelf to the southern continental slope, as presented along profile L1. Although the Moho temperature beneath the southern uplift zone exceeded 600℃, that beneath the northern depression and uplift zone is only 360℃, with a sharp temperature gradient occurring at the central depression zone. The vertical distribution of the heat flow within the lithosphere is described by the ratio of crust/mantle(Q/Q), which showed a trend approximately opposite that of the surface heat flow (Fig.5). The lowerQ/Qof 0.20–0.60 in the southern uplift zone and Xisha Uplift contrasts with the higher values of 1.00–1.20 in the northern depression and uplift zone, which indicates more heat from the shallow crust. Therefore, the central depression zone of the QDNB can be regarded as a transition region from the cold continental shelf to the warm deep-water ocean. These conclusions are supported by previous studies conducted in the PRMB (Tang., 2018; Hu., 2020).
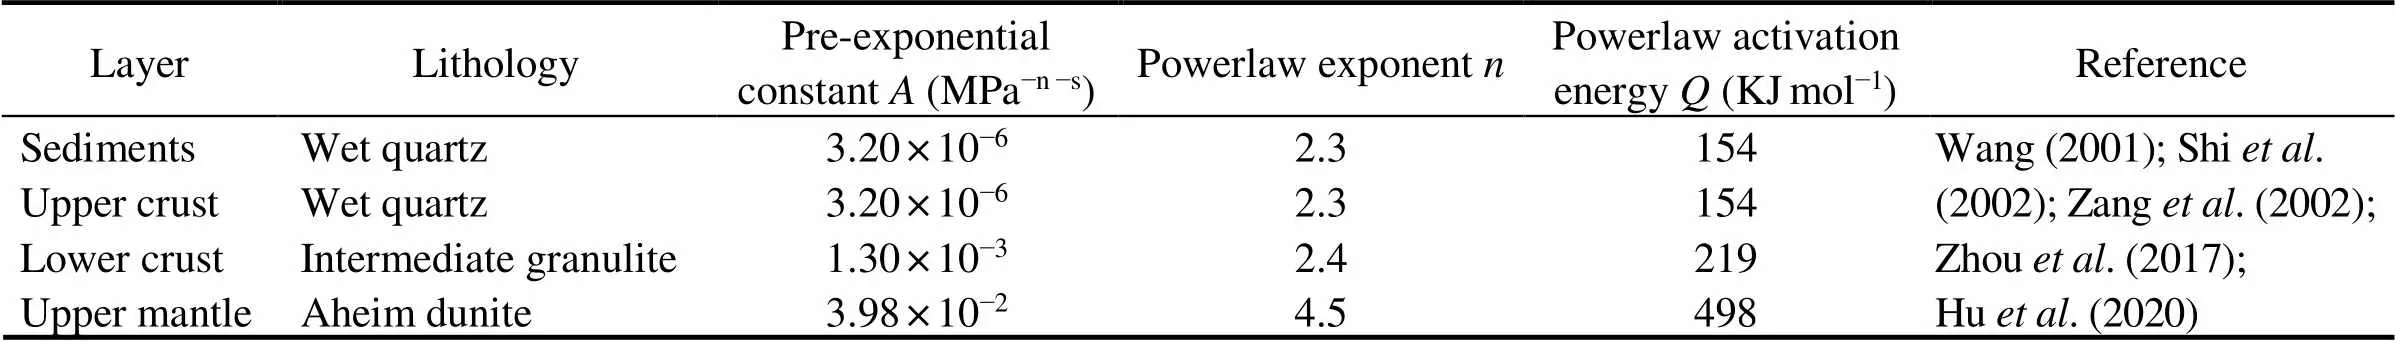
Table 2 Material properties used for rheology models

Fig.5 Estimated thermal structure along profile L1. Surface heat flow and Qc/Qm are shown by red and blue points, respectively. Qc, heat flow from crust; Qm, heat flow from the mantle; NDUZ, northern depression and uplift zone; CDZ, central depression zone; SUZ, southern uplift zone; XSU, Xisha Uplift; RMSE, the root-mean-square error between inversion surface heat flow and observation surface heat flow.

Fig.6 Same as Fig.5 but for profile L2.
A more complex but gentle lateral temperature change is exhibited along profile L2, which extends almost to the high heat flow areas (Figs.2 and 6). With Moho temperatures of about 400℃, the southern uplift and central depression zones are colder than the Xisha Uplift, northern depression, and uplift zone. However, the Moho tempera- ture distribution is not in perfect agreement with that at depths of 40–50km. Compared with the lower Moho tem- perature of the central depression zone, the highest temperature at depths of 40–50km was observed at the nor- thern part of the central depression zone, which could be related to mantle magma upwelling (Fig.6). These features are slightly different from the temperature distribution in the Xisha Trough conducted by Shi. (2002). In the previous research, the highest temperature is right in the central part of Xisha Trough (Shi., 2002). In contrast to the lateral variation ofQ/Qalong profile L1, little change was observed along profile L2, with all va- lues below 1, at 0.28–0.49. These results suggest more heatfrom the deep mantle. Considering the strongly thinned low- er crust in its central zone, the Xisha Trough is usually re- garded as the result of a depth-dependent lithospheric scale thinning, and its rifting is usually triggered by mantle flow (Lei and Ren, 2016).
4.2 Rheological Structure
The geodynamic processes of lithospheric deformation can be evaluated by considering the flux of material in the deeper crust, which can be inferred from the rheological structure of the lithosphere (Panza and Raykova, 2008; Brandmayr., 2011; Zhang., 2013b). The degree of brittle deformation shows an obvious decrease from the northern depression and uplift to the Xisha Uplift along profile L1, particularly at the upper mantle (Fig.7). The relatively strong central depression zone along profile L1 is divided into four load-bearing layers, including a weak lower crustal ductile layer sandwiched between two hard, brittle layers of the upper crust and upper mantle (P2 in Fig.7c). The HVL is recognized as the ductile layer, whichis consistent with that reported by Hu. (2020). A stiffer lithosphere is present at the northern depression and uplift zone of the QDNB, with peak strength exceeding 800MPa at the topmost part of the upper mantle; however, a relatively weak ductile layer is present at the base of the lower crust (P1 in Fig.7c). In contrast to that in the northern part of the QDNB showing limited, thinned continental crust (P1 and P2 in Fig.7c), the southern uplift zone and Xisha Uplift (P3 and P4 in Fig.7c) exhibit significant weakness in the lower crust and upper mantle, with a higher heat flow of 65.0mWm−2. This heat originated from the mantle and is likely related to mantle upwelling. The southern uplift zone and Xisha Uplift also exhibit characteristics of a strongly thinned crust, with brittle deformation of P3 and P4 restricted to the topmost 15km of the upper crust and more ductile extension deformation occurring in the lower crust and upper mantle. These features appear to be consistent with the crustal extension factor discussed by Zhang. (2007) and Zhang. (2010).

Fig.7 (a), Surface heat flow (red points) and Q0/Qm (blue points). (b), Estimated rheological structure along profile L1. The σ1 and σ3 are the maximum and minimum principal stresses, respectively. (c), Typical thermo-rheological models at the locations of P1–P4. Red and green lines indicate the YSEs and the geothermal curve, respectively. The rheological models along profile L1 are marked by pink and light blue rectangles corresponding to CB-1 and JS-1, respectively. Q0, surface heat flow; Qm, heat flow from the mantle; JS-1, jelly sandwich regime with weak lower crust; CB-1, crème brûlée regime with weak lower crust. UC, upper crust; LC, lower crust; M, upper mantle; NDUZ, northern depression and uplift zone; CDZ, central depression zone; SUZ, southern uplift zone; XSU, Xisha Uplift.
Obvious lateral variations are also presented along profile L2, although the overall rheological strength is lower (Fig.8). The central depression zone shows a significantly higher percentage of brittle deformation than that occurring in the other regions. The northern part of the central depression zone (P6 in Fig.8c) is also divided into four load-bearing layers with strong rheological anomalies, with a significant lower crustal ductile layer occurring at the location of the HVL. In particular, the southern part of the central depression zone (P7 in Fig.8c) is characterized by a very stiff lithosphere with brittle deformation occurring in almost the entire crust and upper mantle; these features are similar to the typical rigid and cold characteristics of oceanic crust (Hu., 2020). Similar to P3 and P4 along profile L1, the brittle load-bearing layers of the Xisha Up- lift, northern depression, and uplift zone are located in the topmost 15km of the upper crust, and ductile deformation occurs in the lower crust and upper mantle (P5 and P8 in Fig.8c).
5 Discussion
5.1 East–West Differential Thermo-Rheological Structure of the QDNB
The geodynamic processes and patterns of lithospheric deformation can be evaluated by the thermo-rheological structure(Burov and Watts, 2006). Two main rheological regimes are generally applied to the lithosphere. The first is the jelly sandwich (JS) regime, which suggests that the continental lithosphere consists of a weak lower crust sand-wiched between the relatively strong upper crust and strong upper mantle layers (Burov and Diament, 1995; Zhang., 2013b). The second is the crème brûlée (CB) regime, which suggests that the strength of the continental lithosphere is contained entirely in the crust and that the upper mantle is significantly weaker owing to high temperatures and weakening by water (Jackson, 2002; Zhang., 2013b). The JS and CB regimes can be further divided into two sub-groups of JS-1 and CB-1, characterized by a weak lower crust and JS-2 and CB-2 regimes with relatively strong lower crusts (Burov and Watts, 2006; Zhang., 2013b). A further JS regime, JS-2, which is also known as the Christmas Tree regime, contains only one hard, load- bearing layer overlying a ductile mantle (Jackson., 2008). The rigid oceanic lithosphere is usually regarded as a Christmas tree regime with uniform deformation (Hu., 2020).
From the calculated YSEs along profiles L1 and L2, three rheological regimes are recognized in this study (Figs.7, 8, and 9). The first is a typical JS-1 regime in the continental shelf and in most parts of the central depression zone corresponding to typical continental crust or li- mited thinned crust, with Moho temperatures falling 400℃ (P1, P2, and P6 in Figs.6 and 7). Unlike the dominant heat flow originating from the shallow crust at P1 of the continental shelf, more heat flow is derived from the deep mantle at P2 and P6 of the central depression zone, suggesting continental-oceanic transition characteristics with a weaker lower crust and upper mantle. In contrast, the se- cond group, which includes the southern uplift zone, Xisha Uplift, and some part of the northern uplift zone (P3–P5 and P8 in Figs.7 and 8), falls within the CB-1 regime with high Moho temperatures >600℃, significantly weak lower crust, and weak upper mantle. For the CB-1 regime, the competent layers are mechanically decoupled by weak, ductile layers; thus, the contribution of a weak lower crust to the lithospheric strength is negligible. The third group is a JS-2 regime of typical oceanic crust with only one hard, load-bearing layer of whole crust and topmost upper mantle (P7 in Fig.8). The ductile layers at P7 of the eastern QDNB are sufficiently thin to be ignored in the rheo- logical structure, suggesting a mechanically coupled relationship between the crust and the mantle. Furthermore, the degree of extension in the eastern QDNB is higher than that in the western QDNB, as suggested by the cold and rigid ocean crust in P7.
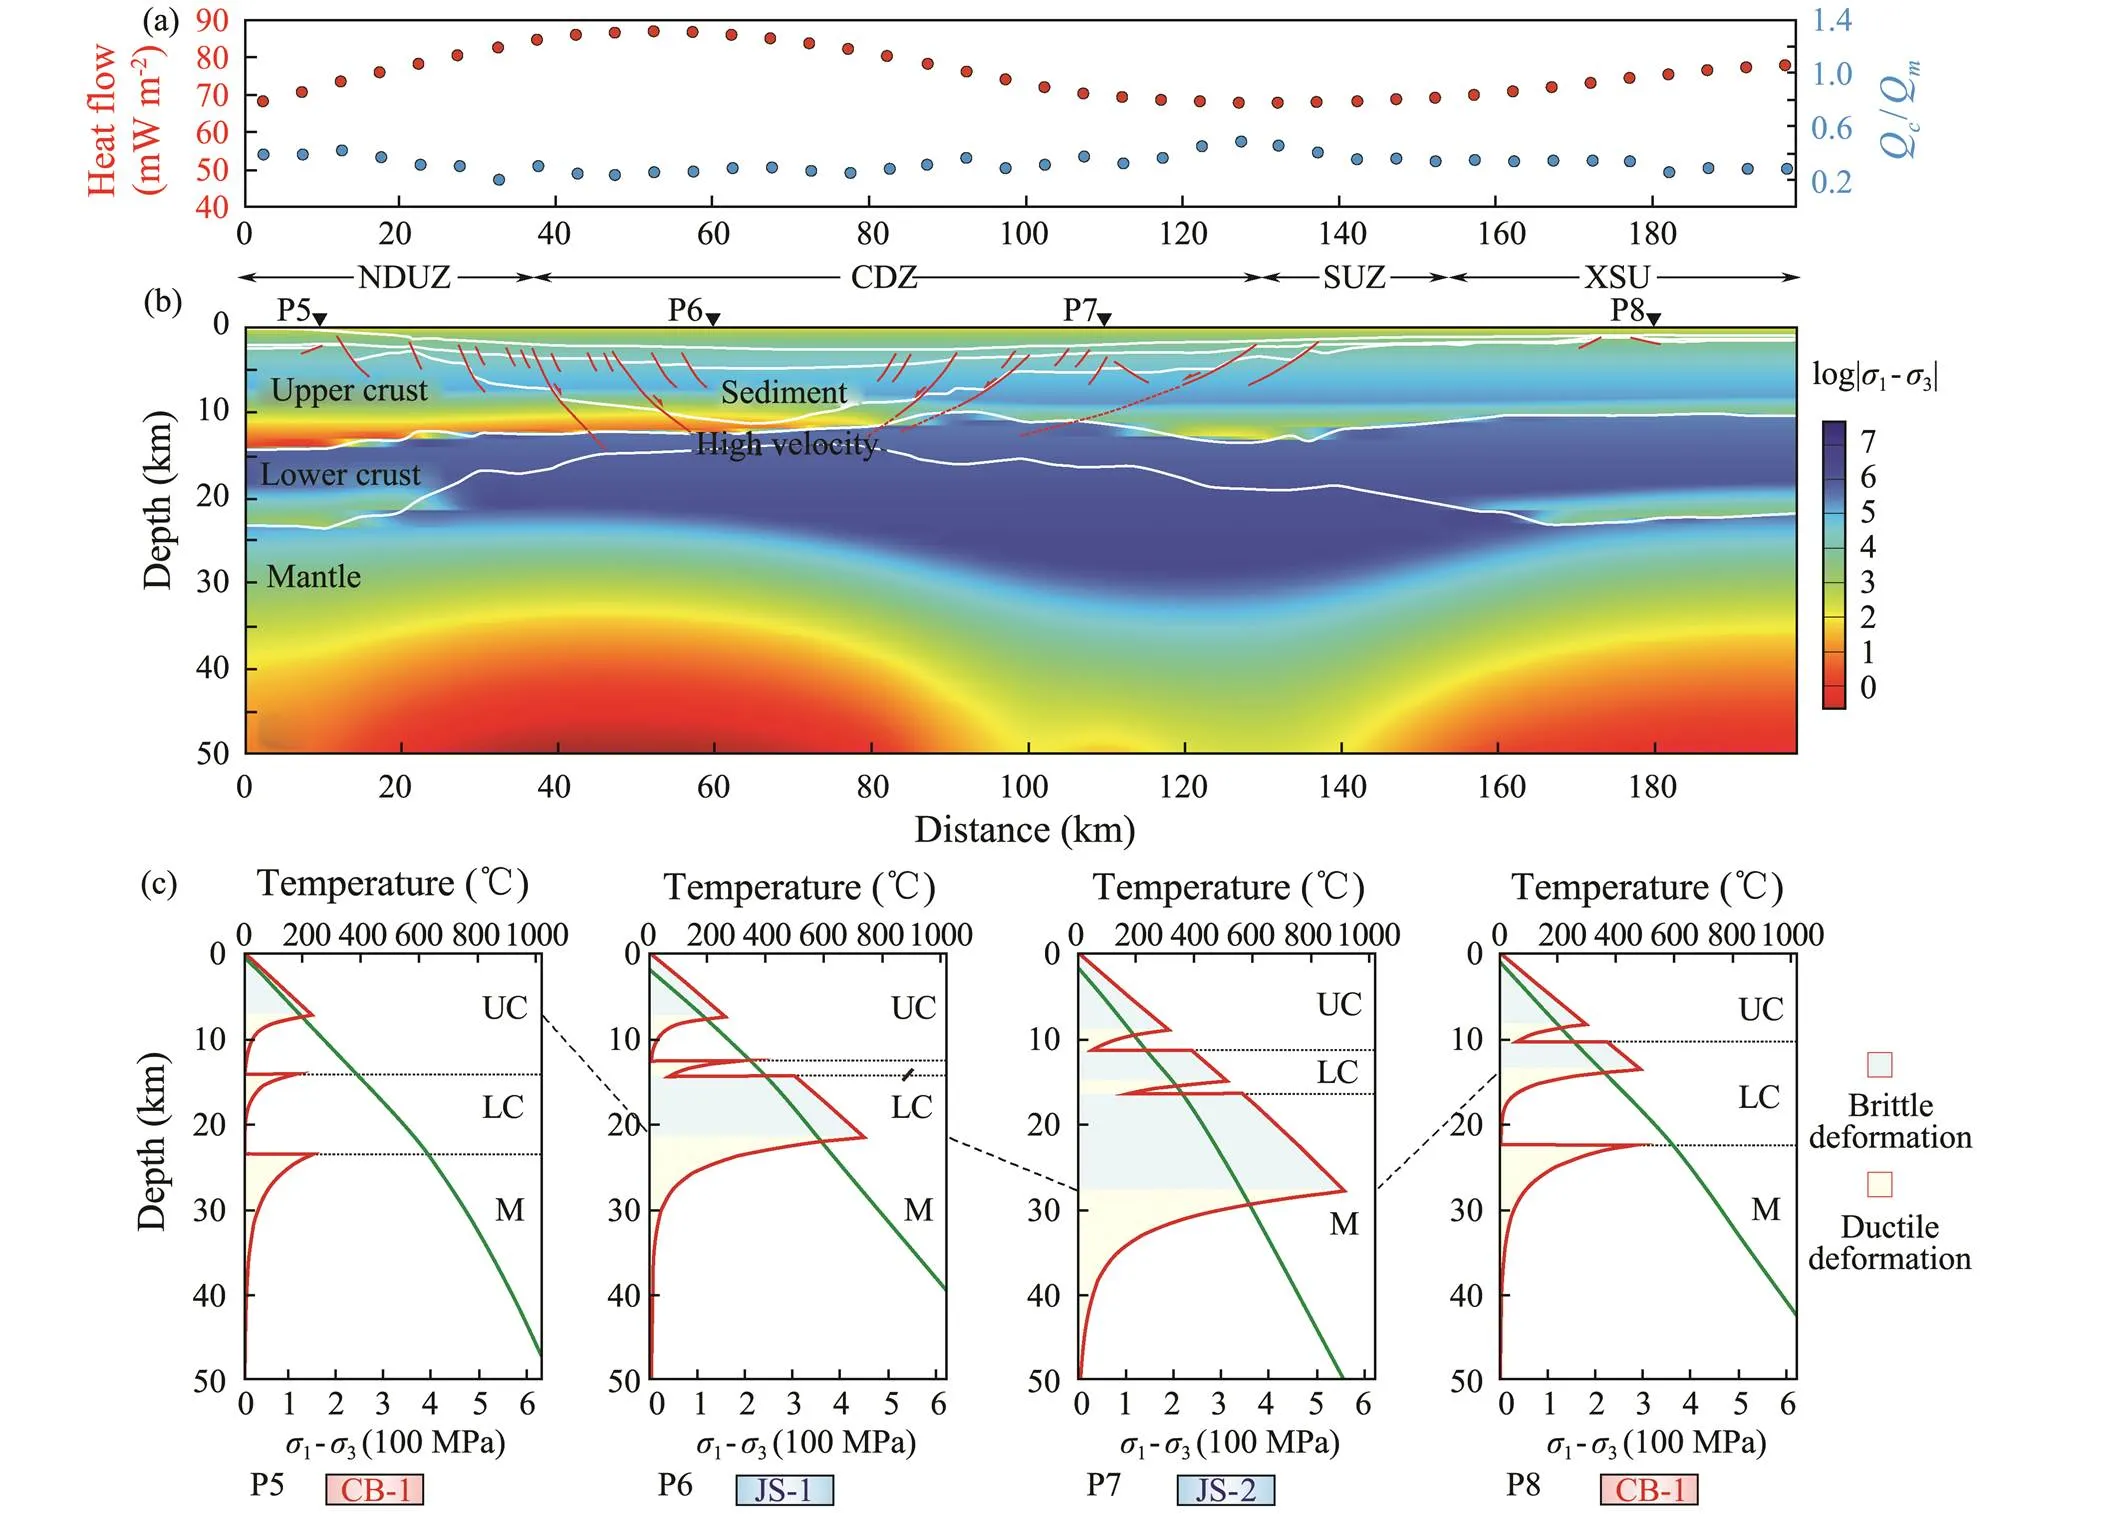
Fig.8 (a), Surface heat flow (red points) and Q0/Qm (blue points). (b), Estimated rheological structure along profile L2. The σ1 and σ3 are the maximum and minimum principal stresses, respectively. (c), Typical thermo-rheological models at the locations of P5–P8. Red and green lines indicate the YSEs and the geothermal curve, respectively. The rheological models along the profile L1 are marked by pink, light blue, and dark blue rectangles corresponding to CB-1, JS-1, and JS-2, respectively. Q0, Qm, JS-1, JS-2, CB-1, UC, LC, M, NDUZ, CDZ, SUZ, and XSU are same as those in Fig.7.

Fig.9 (a), Estimated distribution of rheological structures. The rheological models along the profiles are marked by pink, light blue, and dark blue lines corresponding to CB-1, JS-1, and JS-2, respectively. Lines, stars, and tectonic units are consistent with those described in Fig.1. (b), Conceptual reconstructions of the non-volcanic margin with non-uniform extension (Huismans and Beaumont, 2011). (c), Schematic block diagrams illustrating the crustal-scale evolution of QDNB and its surrounding region (Lei and Ren, 2016).
5.2 Implications for Rifting of Northwestern Margin of SCS
Rifted margins are the result of an extension within a continent, which leads to rupturing of the continental li- thosphere and the subsequent formation of a new oceanic crust (Peron-Pinvidic., 2019). Thermomechanical nu- merical experiments conducted in previous studies highlight thermo-rheological structures as key parameters controlling the rifting process in the passive margin, particularly during the initial stages of extension (Tetreault and Buiter, 2018). Generally regarded as the ‘small Atlantic’, the SCS had a non-volcanic or magma-poor passive continental margin during its seafloor spreading at 32–17Myrand experienced thermal subsidence after continental rifting (Li, 2011). However, significant discrepancies have been observed at the northwestern margin of SCS that re- main enigmatic. These differences include widespread HVL, unclear evidence of exposed mantle lithosphere, and active magmatic events (Wu., 2001; Wang, 2020).
In their study of the whole crustal extension factor, Zhang. (2010) reported limited thinned crust at the continental shelf of the QDNB with a factor of 1.0–1.2. The JS-1 regime, with a weak lower crust at P1 of the west- ern QDNB, could be estimated as close to the initial non- rifting continental crust. The QDNB experienced only limited upper crustal extension (1.45–2.2), which is significantly smaller than the whole crustal extension (1.5–3.2) (Zhang., 2010). In addition, considering the decoupled relationship between the upper crust and the mantle filling by the lower crustal viscous layer from the initial crustal model of JS-1 regime, the non-uniform extension is an acceptable continental margin rifting model (Huismans andBeaumont, 2011). The model has been suggested by many scholars (Zhang., 2007; Zhang., 2010; Gao, 2016; Lei and Ren, 2016). The characteristic result of this model is the breakup of the lower crust and mantle lithosphere before that of the upper crust (Fig.9; Huismans and Beaumont, 2011).
At the early stage of rifting, the strength of the lower crust and upper mantle was significantly reduced before the breakup of the upper crust (Figs.7, 8, and 9). According to the seismic profiles, the initial rifting almost occurred at Eocene, with high angle normal faults only rooted in the brittle upper crust. Almost all of the typical locations of P1–P6 and P8 are in this stage with different degrees of extension and are still defined as thinning continental crust before the establishment of oceanic crust (Fig.9). The location of P2 shows a similar lithospheric rheological structure with the initial crustal model of P1, which suggests the relatively lower extension. However, the locations of P3–P5 and P8 fall into the CB-1 regime, showing a greater degree of lower crustal extension and more heat flow from the deep mantle than those at the locations of P1 and P2 featured by the JS-1 regime.
With the increasing extension, the stage of extreme localized crustal thinning mostly occurred at 38–32Myr, which is mainly recognized at the Xisha Trough of eastern QDNB (Fig.9; Lei and Ren, 2016). The crustal extension factor of the eastern QDNB is significantly higher than that of the western QDNB, with the highest value of >3.2 and the lowest value of 2.8km for lower crust thinness observed at Changchang Sag (Zhang., 2010; Wang., 2013). The rheology of the heavily thinned lower crust becomes more brittle (Zhou, 2018). The break- up features are defined by the major basin-forming conjugate faults extending deep into the lower crust along profile L2 of the eastern QDNB (Qiu., 2013; Zhang., 2019). Similar composite, symmetric horst and gra- ben faults have been observed in Xisha Trough (Zhang., 2013a). When the basin entered post-rift subsidence with cooling of the hot ‘oceanic’ lithosphere, the central depression zone (P7) of the eastern QDNB assumed the JS-2 regime, showing features close to that of a rigid and cold oceanic crust (Fig.9). Notably, the Xisha Trough most- ly shows the highest lower crustal extension before the breakup, which is featured by the lower crustal HVL related to the mantle underplating (Lei and Ren, 2016).
In response to the seafloor spreading of the SCS from east to west at 32–16Myr, the accommodation zones in the central QDNB were activated along the pre-existing northwest-trending faults, and the crustal extension was only restricted in the Xisha Trough (Figs.1 and 9; Gao., 2016; Sibuet., 2016; Zhang., 2019). With the rupturing of the mantle lithosphere and necking of the lower crust, the upper crust of northwest sub-basin began to break up in contact with the hot mantle upwelling (Sun., 2009; Barckhausen., 2014). However, the HVL beneath the PRMB at the northern margin is likely the result of SCS spreading at this stage, which is only observed at the base of the lower crust.
According to the extension model of the passive margin as suggested by the thermo-rheological structure, the HVL is generally considered to be the result of mantle underplating, which could have been derived from the pressure-driven lateral flow of mantle (Huismans and Beaumont, 2011). The pressure-driven lateral mantle flow is also the key process facilitated by the lower crust thinning with creep deformation (Clift., 2002; Huismans and Beaumont, 2011). However, whether the beginning of the lateral flow of the mantle facilitated the breakup of the continental crust remains controversial. A variety of causes have been proposed in previous studies, such as the mantle low-velocity zone related to the RRF (Yao., 2005), the collapse of the Cathaysian continental marginal orogenic belt (Zou, 2001), the continuous asthenosphere low-velocity zone from the Yangtze craton (Huang and Xu, 2011), and mantle convection owing to the subduction of the Pacific Plate (Zhang., 2010; Li., 2012). The time of the east–west differential tectonic evolution of the QDNB shows a strong correlation with the RRF, particularly at the end of the syn-rift stage (Yuan., 2008; Gong., 2017). The east–west differential ther- mo-rheological structure and the degree of continental mar- gin extension in the QDNB are also presented in a small- scale range. Therefore, the influence of the mantle low- velocity zone related to the RRF is a crucial factor in the east–west differential margin rifting process of the QDNB. Thus, the east–west differential thermo-rheological structures of the QDNB presented in this study provide a basic foundation for further relevant studies.
6 Conclusions
1) In response to the east–west differential patterns of shallow, brittle deformation in the QDNB, we present dif- ferent east–west thermo-rheological structures from the continental shelf to the deep-water zone. The rheological structure of the western QDNB changes from the JS-1 re- gime of slightly thinned continental crust to the CB-1 regime of strongly thinned continental crust. The central de- pression of the eastern QDNB is defined as the JS-2 regime, and shows the characteristics of cold and rigid oceanic crust; this suggests a higher degree of extension.
2) The HVL of the QDNB resulted from the non-uniform extension with mantle underplating, which was facilitated by the lower crustal ductile layer and was deri- ved by lateral mantle flow.
3) The influence of the mantle low-velocity zone related to the RRF is determined to be a crucial factor of the east–west differential margin rifting process occurring in the QDNB.
Acknowledgements
We are extremely grateful to the anonymous referees for their insightful comments, which have improved this paper. This work was supported by the National Natural Science Foundation of China (Nos. 41530963, 41176038 and 91858215).
Barckhausen, U., Engels, M., Franke, D., Ladage, S., and Pubellier, M., 2014. Evolution of the South China Sea: Revised ages for breakup and seafloor spreading., 58 (B): 599-611.
Brandmayr, E., Marson, I., Romanelli, F., and Panza, G. F., 2011. Lithosphere density model in Italy: No hint for slab pull., 23 (5): 292-299.
Burov, E. B., and Diament, M., 1995. The effective elastic thick- ness (Te) of continental lithosphere: What does it really mean?, 100 (B3): 3905- 3927.
Burov, E. B., and Watts, A. B., 2006. The long-term strength of continental lithosphere: ‘Jelly sandwich’ or ‘crème brûlée’?, 16 (1): 4-10.
Cai, L., Li, X., Liu, S., Zhu, J., Xiong, X., Li, X.,., 2019. Thermal properties characterization of the rocks in the Qiongdongnan Basin, northern margin of the South China Sea., 25 (4): 538-547 (in Chinese with English abstract).
Cai, Z., Liu, W., Wang, Z., and Guo, F., 2010. Determination of Cenozoic tectonic movement in the northern South China Sea and the relationship between oil-gas reservoir and tectonic mo- vement., 29 (2): 161-165 (in Chinese with English abstract).
Clift, P., Lin, J., and Barckhausen, U., 2002. Evidence of low flexural rigidity and low viscosity lower continental crust du- ring continental break-up in the South China Sea., 19 (8): 951-970.
Dean, S. M., Minshull, T. A., Whitmarsh, R. B., and Louden, K. E., 2000. Deep structure of the ocean-continent transition in the southern Iberia Abyssal Plain from seismic refraction profiles: The IAM-9 transect at 40˚20΄N., 105 (B3): 5859-5885.
Ding, W., Li, J., and Clift, P. D., 2016. Spreading dynamics and sedimentary process of the southwest sub-basin, South China Sea: Constraints from multi-channel seismic data and IODP Expedition 349., 115: 97-113.
Ding, W., Sun, Z., Dadd, K., Fang, Y., and Li, J., 2018. Structures within the oceanic crust of the central South China Sea basin and their implications for oceanic accretionary processes., 488: 115-125.
Doust, H., and Sumner, H. S., 2007, Petroleum systems in rift basins–A collective approach in southeast Asian basins., 13 (2): 127-144.
Fan, C., Xia, S., Cao, J., Zhao, F., Sun, J., Wan, K.,., 2019. Lateral crustal variation and post-rift magmatism in the northeastern South China Sea determined by wide-angle seismic data., 410: 70-87.
Franke, D., 2013. Rifting, lithosphere breakup and volcanism: Comparison of magma-poor and volcanic rifted margins., 43: 63-87.
Gao, J., 2015. The continent-ocean transition zone at the northern margin of the South China Sea. PhD thesis. Institute of Oceanology, Chinese Academy of Sciences.
为了在评价中体现专家的主观经验,同时又以数据为本体现出客观性,本文对上述主、客观权重确定方法进行了最优化组合。
Gao, J., Wu, S., Mcintosh, K., Mi, L., Liu, Z., and Spence, G., 2016. Crustal structure and extension mode in the northwestern margin of the South China Sea., 17 (6): 2143-2167.
Gong, W., Li, C., and Jiang, X., 2017. Connection between uplifting of the Tibetan Plateau and opening of the South China Sea (SCS): The basin-mountain coupling in the northwestern margin of the SCS., 24 (4): 268-283 (in Chinese with English abstract).
Guo, L., Shi, Y., and Ma, R., 1983. On the formation and evolution of the Mesozoic–Cenozoic active continental margin and island arc tectonic of the western Pacific Ocean., 1: 11-21 (in Chinese with English abstract).
Guo, L., Zhong, Z., Wang, L., Shi, Y., Li, H., and Liu, S., 2001. Regional tectonic evloution around Yinggehai Basin of South China Sea., 7 (1): 1-12 (in Chinese with English abstract).
Hall, R., 2002. Cenozoic geological and plate tectonic evolution of SE Asia and the SW Pacific: Computer-based reconstructions, model and animations., 20 (4): 353-431.
He, L., 2014. Permian to late Triassic evolution of the Longmen Shan Foreland Basin (western Sichuan): Model results from both the lithospheric extension and flexure., 93: 49-59.
He, L., Xiong, L., Wang, J., Yang, J., and Dong, S., 2001. Tectono-thermal modeling of the Yinggehai Basin, South China Sea., 44 (1): 7- 13.
Hu, J., Tian, Y., Long, Z., Hu, D., and Hu, S., 2020. Thermo-rhe- ological structure of the northern margin of the South China Sea: Structural and geodynamic implications., 777: 228338.
Huang, Z., and Xu, Y., 2011. S-wave velocity structure of South China Sea and surrounding regions from surface wave tomography., 54 (12): 3089-3097 (in Chinese with English abstract).
Huismans, R., and Beaumont, C., 2011. Depth-dependent extension, two-stage breakup and cratonic underplating at rifted mar- gins., 473 (7345): 74-78.
Jackson, J., 2002. Faulting, flow, and the strength of the continental lithosphere., 44 (1): 39- 61.
Jackson, J., McKenzie, D., Priestley, K., and Emmerson, B., 2008. New views on the structure and rheology of the lithosphere., 165 (2): 453-465.
Kirby, S. H., 1983. Rheology of the lithosphere., 21 (6): 1458-1487.
Lei, C., and Ren, J., 2016. Hyper-extended rift systems in the Xisha Trough, northwestern South China Sea: Implications for extreme crustal thinning ahead of a propagating ocean., 77: 846-864.
Li, J., 2011. Dynamics of the continental margin of South China Sea: Scientific experiments and research progresses., 54 (12): 2993-3003 (in Chinese with English abstract).
Li, S., Suo, Y., Liu, X., Dai, L., Yu, S., Zhao, S.,., 2012. Basic structural pattern and tectonic models of the South China Sea: Problems, advances and controversies., 32 (6): 35-53 (in Chinese with English abstract).
Li, Y., Luo, X., Xu, X., Yang, X., and Shi, X., 2010. Seafloorheat flow measurements in the deep-water area of the northern slope, South China Sea., 53 (9): 2161-2170 (in Chinese with English abstract).
Liu, H., Yao, Y., Shen, B., Cai, Z., Zhang, Z., Xu, H.,., 2015. On linkage of western boundary faults of the South China Sea.–, 40 (4): 615-632 (in Chinese with English abstract).
Liu, S., Shi, X., Wang, L., Gao, S., Hu, X., and Feng, C., 2006. Recent advances in studies on the formation mechanism of the South China Sea and thermo-rheological structure of lithosphere in its northern margin: An overview., 26 (4): 117-124 (in Chinese with Eng- lish abstract).
Luan, X., and Zhang, L., 2009. Tectonic evolution modes of South China Sea: Passive spreading under complex actions., 29 (6): 59-74 (in Chi- nese with English abstract).
Ma, H., Xu, H., Zhao, J., Wan, J., Chen, A., and Liu, T., 2012. Thermal structure of Nansha Trough Foreland Basin., 31 (3): 155-161 (in Chinese with English abstract).
Mi, L., Yuan, Y., Zhang, G., Hu, S., He, L., and Yang, S., 2009. Characteristics and genesis of geothermal field in deep-water area of the northern South China Sea., 30 (1): 27-32 (in Chinese with English abstract).
Nissen, S., Hayes, D., Buhl, P., and Diebold, J., 1995. Deep pe- netration seismic soundings across the northern margin of the South China Sea., 100 (B11): 22407-22433.
Panza, G. F., and Raykova, R. B., 2008. Structure and rheology of lithosphere in Italy and surrounding., 20: 194- 199.
Peron-Pinvidic, G., and Manatschal, G., 2019. Rifted margins: State of the art and future challenges., 7: 1-8.
Qiu, N., Wang, Z. W., Wang, Z. F., Sun, Z. P., Sun, Z., and Zhou, D., 2014. Tectonostratigraphic structure and crustal extension of the Qiongdongnan Basin, northern South China Sea., 57 (10): 3189-3207 (in Chinese with English abstract).
Qiu, N., Wang, Z., Xie, H., Sun, Z., Wang, Z., Sun, Z.,., 2013. Geophysical investigations of crust-scale structural model of the Qiongdongnan Basin, northern South China Sea., 34 (3-4): 259-279.
Qiu, N., Yao, Y., Zhang, J., Wang, L., and Xu, D., 2019. Characteristics of the crustal structure and its tectonic significance of the continental margin of SE South China Sea., 62 (7): 2607-2621 (in Chinese with English abstract).
Qiu, X., Shi, X., Yan, P., Wu, S., and Zhou, D., 2003. New progress of deep seismic crustal exploration in the northern South China Sea., 13 (3): 9-14 (in Chinese with English abstract).
Ranalli, G., 1991. Regional variations in lithosphere rheology from heat flow observations. In:. Cermak, V., and Rybach, L.,eds., Springer, Berlin, 1-22.
Ren, J., and Lei, C., 2011. Tectonic stratigraphic framework of Yinggehai-Qiongdongnan Basins and its implication for tectonic province division in South China Sea., 54 (12): 3303-3314 (in Chinese with English abstract).
Ren, J., Pang, X., Lei, C., Yuan, L., Liu, J., and Yang, L., 2015. Ocean and continent transition in passive continental margins and analysis of lithospheric extension and breakup process: Implication for research of the deepwater basins in the continental margins of South China Sea., 22 (1): 102-114 (in Chinese with English abstract).
Shi, X., and Zhou, D., 2000. Lithospheric thermal-rheological stru- cture of the northern continental margin of the South China Sea., 45 (15): 1660-1665 (in Chinese with English abstract).
Shi, X., Yu, C., Chen, M., Yang, X., and Zhao, J., 2017. Analyses of variation features and influential factors of heat flow in the northern margin of the South China Sea., 24 (3): 56-64 (in Chinese with English abstract).
Shi, X., Zhou, D., Qiu, X., and Zhang, Y., 2002. Thermal and rheological structures of the Xisha Trough, South China Sea., 351 (4): 285-300.
Sibuet, J., Yeh, Y., and Lee, C., 2016. Geodynamics of the South China Sea., 692 (B): 98-119.
Sun, Z., Zhong, Z., Keep, M., Zhou, D., Cai, D., Li, X.,., 2009. 3D analogue modeling of the South China Sea: A discussion on breakup pattern., 34 (4): 544-556.
Sun, Z., Zhou, D., Zhong, Z., Qiu, X., and Zeng, Z., 2005. A study on basal controlling fault pattern of Ying-Qiong Basin through analogue modeling., 24 (2): 70-78 (in Chinese with English abstract).
Tapponier, P., Peltzer, G., and Armijo, R., 1986. On the mechanism of collision between India and Asia., 19: 115-157.
Tang, X., Huang, S., Zhang, G., Yang, S., and Hu, S., 2018. Li- thospheric thermal structure of the Pearl River Mouth Basin, northern South China Sea., 61 (9): 3749-3759 (in Chinese with English abstract).
Taylor, B., and Hayes, D. E., 1983. Origin and history of the South China Sea Basin. In:. Hayes, D. E., ed., AGU, Washington, D. C., 23-56.
Tetreault, J. L., and Buiter, S. J. H., 2018. The influence of extension rate and crustal rheology on the evolution of passive margins from rifting to break-up., 746: 155-172.
Tong, D., Ren, J., Lei, C., Yang, H., and Yin, X., 2009. Lithosphere stretching model of deep water in Qiongdongnan Basin, northern continental margin of South China Sea, and controlling of the post-rift subsidence.–, 34 (6): 963-974 (in Chinese with English abstract).
Wang, E., Fan, C., Wang, G., Shi, X., Chen, L., and Chen, Z., 2006. Deformational and geomorphic processes in the formation of the Ailao Shan-Diancang Range, west Yunnan., 26 (2): 220-227 (in Chinese with English abstract).
Wang, P., 2020. Exploring the deep sea processes in the South China Sea., 38 (18): 6-20 (in Chinese with English abstract).
Wang, P., Li, S., Suo, Y., Guo, L., Wang, G., Hui, G.,., 2020. Plate tectonic control on the formation and tectonic migration of Cenozoic basins in northern margin of the South China Sea., 11 (4): 1231-1251.
Wang, Y., 2001. Heat flow pattern and lateral variations of li- thosphere strength in China mainland: Constraints on active deformation., 126(3-4): 121-146.
Wang, Y., 2007. Petrology and chemical composition models of the lower crust of the Xisha Trough, northern continental mar- gin of the South China Sea., 26 (0z1): 29-30 (in Chinese with English abstract).
Wang, Y., Xu, Q., Li, D., Han, J., Lu, M., Wang, Y.,., 2011. Late Miocene Red River submarine fan, northwestern South China Sea., 56 (10): 781-787 (in Chinese with English abstract).
Wang, Z., Shi, X., Yang, J., Huang, B., Sun, Z., Wang, Y.,., 2014. Analyses on the tectonic thermal evolution and influence factors in the deep-water Qiongdongnan Basin., 33 (12): 107-117.
Wang, Z., Sun, Z., Qiu, N., Liu, J., Wang, Z., and Sun, Z., 2013. Crustal structure of Changchang Sag in the deepwater area of Qiongdongnan Basin., 29 (8): 7-17 (in Chinese with English abstract).
Williams, J. P., Ruiz, J., Rosenburg, M. A., Aharonson, M. A., Phillips, O., and Roger J., 2011. Insolation driven variations of Mercury’s lithospheric strength., 116: E01008.
Wu, S., Zhou, D., and Qiu, X., 2001. Tectonic setting of the nor- thern margin of South China Sea., 7 (4): 419-426 (in Chinese with English abstract).
Xie, X., Ren, J., Wang, Z., Li, X., and Lei, C., 2015. Difference of tectonic evolution of continental marginal basins of South China Sea and relationship with SCS spreading., 22 (1): 77-87 (in Chinese with English abstract).
Xu, Y., Wei, J., Qiu, H., Zhang, H., and Huang, X., 2012. Opening and evolution of the South China Sea constrained by studies on volcanic rocks: Preliminary results and a research design., 57: 3150-3164.
Yao, B., Wan, L., and Wu, N., 2005. Cenozoic tectonic evolution and the 3D structure of the lithosphere of the South China Sea., 24 (1): 1-8 (in Chinese with Eng- lish abstract).
Yin, A., 2010. Cenozoic tectonic evolution of Asia: A preliminary synthesis., 488 (1-4): 293-325.
Yuan, Y., Yang, Y., Hu, S., and He, L., 2008. Tectonic subsidence of Qiongdongnan Basin and its main control factors., 51 (2): 376-383 (in Chinese with English abstract).
Zang, S., Li, Y., and Wei, R., 2002. The determination of rhe- ological mechanics of lithosphere and the influencing factors on the rheological strength of lithosphere., 17 (1): 50-60 (in Chinese with English abstract).
Zhang, C., Wang, Z., Sun, Z., Sun, Z., Liu, J., and Wang, Z., 2013a. Structural differences between the western and eastern Qiongdongnan Basin: Evidence of Indochina block extrusion and South China Sea seafloor spreading., 34 (3-4): 309-323.
Zhang, J., and Wang, J., 2000. Deep geothermal characteristics in the northern continental margin of the South China Sea., 45 (10): 1095-1100 (in Chinese with English abstract).
Zhang, J., Dong, M., Wu, S., and Gao, L., 2017. Lithosphere ther- mal-rheological structure and geodynamic evolution model of the Nansha Trough Basin, South China Sea., 24 (3): 27-40 (in Chinese with English abstract).
Zhang, L., Liu, Q., and He, L., 2016. The different lithospheric thermal structure of North China Craton and its implications., 59 (10): 3618-3626 (in Chinese with English abstract).
Zhang, Y., Qi, J., and Wu, J., 2019. Cenozoic faults systems and its geodynamics of the continental margin basins in the nor- thern of South China Sea.–, 44 (2): 603-625 (in Chinese with English abstract).
Zhang, Y., Sun, Z., Zhou, D., Guo, X., Shi, X., Wu, X.,., 2007. Cenozoic crustal thinning in the northern margin of the South China Sea and its dynamical significance., 37 (12): 1609-1616 (in Chinese with English abstract).
Zhang, Z., Deng, Y., Chen, L., Wu, J., Teng, J., and Giuliano, P., 2013b. Seismic structure and rheology of the crust under main- land China., 23 (4): 1455-1483.
Zhang, Z., Liu, Y., Zhang, S., Fan, W., and Chen, L., 2010. The depth-dependence of crustal extension beneath Qiongdongnan Basin area and its tectonic implications., 53 (1): 57-66 (in Chinese with English abstract).
Zhang, Z., Liu, Y., Zhang, S., Zhang, G., and Fan, W., 2009. Crustal P-wave velocity structure and layering beneath Zhujiangkou-Qiongdongnan Basins, the northern continental margin of South China Sea., 52 (10): 2461-2471 (in Chinese with English abstract).
Zhao, B., Zhang, S., and Li, S., 2011. Crustal density and composition models beneath Qiongdongnan Basin., 54 (1): 98-107 (in Chinese with English abstract).
Zhou, H., Jiang, X., Li, D., Xing, J., and Gong, W., 2017. Thermal-rheological property of lithosphere beneath Xihu Sag, East China Sea Shelf Basin., 41 (3): 481-490 (in Chinese with English abstract).
Zhou, Z., 2018. The Cenozoic crustal thinning and development of hyper-extended rift system in the northern South China Sea. PhD thesis. China University of Geosciences, 1-174.
Zhu, W., Wu, F., Zhang, G., Ren, J., Zhao, Z., Wu, K.,., 2015. Discrepancy tectonic evolution and petroleum exploration in China offshore Cenozoic basins., 22 (1): 88-101 (in Chinese with English abstract).
Zou, H., 2001. Continental marginal rifting along the northern South China Sea: The crustal response to the lower lithospheric delamination., 21 (1): 39-44 (in Chinese with English abstract).
January 24, 2021;
April 16, 2021;
May 5, 2021
© Ocean University of China, Science Press and Springer-Verlag GmbH Germany 2022
. Tel: 0086-532-66782670
E-mail: 21120411040@ouc.edu.cn
(Edited by Chen Wenwen)
猜你喜欢
心理学报(2022年5期)2022-05-16
中共云南省委党校学报(2022年1期)2022-04-26
法律方法(2021年3期)2021-03-16
当代陕西(2020年17期)2020-10-28
小学生优秀作文(低年级)(2020年4期)2020-07-24
人大建设(2018年5期)2018-08-16
世界博览(2018年11期)2018-06-11
证券市场红周刊(2018年3期)2018-05-14
中学生理科应试(2017年7期)2017-08-09
北极光(2016年6期)2016-08-17
 Journal of Ocean University of China2022年2期
- Journal of Ocean University of China的其它文章
- Study of the Wind Conditions in the South China Sea and Its Adjacent Sea Area
- A Spatiotemporal Interactive Processing Bias Correction Method for Operational Ocean Wave Forecasts
- Characteristics Analysis and Risk Assessment of Extreme Water Levels Based on 60-Year Observation Data in Xiamen, China
- Underwater Target Detection Based on Reinforcement Learning and Ant Colony Optimization
- Polar Sea Ice Identification and Classification Based on HY-2A/SCAT Data
- Effect of Penetration Rates on the Piezocone Penetration Test in the Yellow River Delta Silt