
Temperature-dependent structure and magnetization of YCrO3 compound
2022-04-12 03:47QianZhao赵前YingHaoZhu朱英浩SiWu吴思JunChaoXia夏俊超PengFeiZhou周鹏飞KaiTongSun孙楷橦andHaiFengLi李海峰
Chinese Physics B 2022年4期
关键词:鹏飞
Qian Zhao(赵前) Ying-Hao Zhu(朱英浩) Si Wu(吴思) Jun-Chao Xia(夏俊超)Peng-Fei Zhou(周鹏飞) Kai-Tong Sun(孙楷橦) and Hai-Feng Li(李海峰)
1Joint Key Laboratory of the Ministry of Education,Institute of Applied Physics and Materials Engineering,University of Macau,Avenida da Universidade,Taipa,Macao SAR 999078,China
2State Key Laboratory of High Performance Ceramics and Superfine Microstructure,Shanghai Institute of Ceramics,Chinese Academy of Sciences,Shanghai 200050,China
3Guangdong-Hong Kong-Macao Joint Laboratory for Neutron Scattering Science and Technology,Dongguan 523803,China
Keywords: orthochromates,x-ray powder diffraction,crystal structure,magnetization
1. Introduction
It is well known that structure symmetry and crystallographic environment are decisive factors in determining physical properties of materials.[1-4]Therefore, solving the crystal structure of perovskite transition-metal oxides with general formula ofABO3plays a pivotal role in shedding light on the mechanism of intriguing properties. For idealABO3compounds, the cubic crystal structure (space group:Pm3m)is constructed by a 3D framework of corner-sharing octahedra withBcations accommodated at the center,[5]which generates crystal field splitting of the five-fold-degenerate 3d orbitals and splits the d-level into two-fold-degenerate egand threefold-degenerate t2glevels. With the symmetry breaking in a tetragonal crystal environment, distortedBO6octahedra further lift the two-fold eg(dx2-y2and d3z2-r2)and the three-fold t2g(dxy,dzx,and dyz)degeneracies.
Chemical pressure imposed by coordination of differentAandBcations or by doping would result in some degrees of mismatch between the equilibriumA-O andB-O bond lengths. Consequently, theAions will be inadequate for filling the space betweenBO6octahedra. Thus the structure symmetry lowers. This kind of distortion can be quantitatively reflected by the value of tolerance factort.[6-8]An alternative to distortedBO6octahedra and lowered crystal structural symmetry is temperature variation. Therefore, temperaturedependent structural study is important for a full understanding of the novel physical properties such as multiferroics,[9]dielectrics,[10]thermoelectricity,[11]superconductivity,[12]and colossal magnetoresistance.[13,14]
Ferroelectric compounds are technologically interesting materials in data storage devices,catalysts,and sensors.[15-17]YCrO3is one of the most significant compounds in perovskitetype oxides due to its potential coexistence of ferroelectricity and magnetism and its high thermal, electrical, and structural stability.[6,18,19]This compound shows a coexistence of antiferromagnetism and weak ferromagnetism and displays a spin-phonon coupling.[20]A concept of‘local noncentrosymmetry’ was proposed for the understanding of ferroelectricity observed in the centrosymmetric crystal structure of YCrO3.[21]This is different from conventional ferroelectric systems. The local electric polarization of YCrO3single crystals grown by the flux method is along thecaxis and the[110]direction in thePbnmsymmetry,[22]which depends on the direction of the applied electric field with respect to the crystal axes and was attributed to two types of local polar domains:One is with structural distortions forming near Pb2+ions;the other is the magnetic phase separation domains forming near Pb4+ions. Therefore, the introduction of impurity Pb2+and Pb4+ions in the crystallographic position of Y3+sites results in the energetically beneficial processes of the formation of the local ferroelectric ordering in the isolated domains.[22]Unfortunately,the study did not find any homogeneous ferroelectric orders in YCrO3single crystals from 5 K to 350 K.[22]So far,the crystal structure of YCrO3has been determined to be orthorhombic with space group ofPbnm.[22,23]It was reported that YCrO3compound displays a canted antiferromagnetic(AFM)structure with antisymmetric spin superexchanges,and the weak ferromagnetism is along thecaxis belowTN.[21,24-26]The ferroelectric relaxation was observed below~450 K.[10]However, the coupling mechanism of structure, ferroelectricity, and magnetism is still not clear. Previously, small single crystals of YCrO3were grown in millimeter size by the flux method,[22,27-29]however,impurities always exist.
In this paper, we have grown a centimeter-sized YCrO3single crystal with a laser-diode floating-zone(FZ)furnace[30]and performed a temperature-dependent x-ray powder diffraction(XRPD)study from 36 K to 300 K.We carried out magnetization measurements versus temperatures and applied magnetic fields with a PPMS DynaCool, with which we determined the onset temperature,TN, of antiferromagnetism and observed weak ferromagnetism in the whole studied temperature regime belowTN.We refined the collected XRPD patterns and extracted crystallographic information such as lattice constants, unit-cell volume, local distortion parameter (Δ), bond valence states (BVSs), and isotropic thermal parameter (B).We found an anisotropic magnetostriction effect and subduction charges of Y and O2 ions.
2. Experimental details
The polycrystalline YCrO3samples were synthesized by a mixture of raw materials Y2O3(ALFA AESAR,99.9%)and Cr2O3(ALFA AESAR,99.6%)compounds with a mole ratio of 1:1.08 through solid-state reaction method.[8]Firstly, we mixed and ground the mixture of raw materials with a Vibrating Micro Mill (FRITSCH PULVERISETTE 0) for 1 h.Secondly, the mixture was heated in air at 1000°C for 36 h with a temperature increasing/decreasing rate of 200°C/h to perform the pre-reaction process. Thirdly, we performed a similar grinding, mixing, and heating procedure at 1200°C for 36 h. After two cycles of calcination, we obtained a single-phase powder sample with green color. With additional treatments,[30]the powder sample was isostatically pressed into a cylindrical rod of~12 cm long under a pressure of~70 MPa. The rod was then sintered in air at 1350°C for 36 h. Through the above firing steps and grinding and mixing with a 50 mm diameter ball after each heating process,we finally prepared a dense and uniform sample.[31]The single crystals of YCrO3compound were grown by the FZ method[8]with a laser-diode FZ furnace(Model: LD-FZ-5-200W-VPOPC-UM).[30,32]
We chose shiny pieces of YCrO3single crystals and carefully pulverized them into powder samples with a Vibratory Micro Mill and performed a XRPD study from 36 K to 300 K with a 2θrange of 24°-89°and a step size of 0.005°on an in-house x-ray diffractometer (Rigaku, SmartLab 9 kW) employing copperKα1(1.54056 °A)andKα2(1.54439 °A)with a ratio of 2:1 as the radiation. XRPD patterns were collected at a voltage of 45 kV and a current of 200 mA at ambient conditions. The collected XRPD patterns were refined with the software of FULLPROF SUITE.[33]We refined the scale factor, lattice constants, background, peak profile shape, atomic positions, isotropic thermal parameter, and preferred orientation for following analyses. The magnetization measurements of a YCrO3single crystal were performed on a Quantum Design physical property measurement system(PPMS DynaCool instrument). The dc magnetization measurements at an applied magnetic field of 20 Oe were carried out with two modes from 1.8 K to 350 K: One was after cooling down with zero magnetic field(ZFC),and the other was with the applied magnetic field while cooling(FC).Magnetic hysteresis loops were measured from 0 to 14 T, then to-14 T, and finally back to 14 T with temperatures at 5 K,90 K,and 135 K.
3. Results and discussion
3.1. X-ray powder diffraction
In order to explore possible structural phase transitions in the pulverized YCrO3single crystal at low temperatures,we carried out XRPD measurements with increasing temperature from 36 K to 300 K.The representative XRPD patterns as well as the corresponding structural refinements are shown in Fig. 1. The YCrO3compound undergoes an AFM phase transition[34]atTN=141.58(5) K. BelowTN, it enters into a canted AFM state. Therefore, we chose three temperature points 40 K(belowTN),150 K(aroundTN),and 300 K(aboveTN)for the XRPD study.We indexed all collected data with an orthorhombic structure and a space group ofPbnm(No. 62).We carefully checked the Bragg peak shape and positions,especially for the reflections locating at higher 2θdegrees. No impurity peaks and detectable peak splitting were observed.This indicates that there is no structural phase transition occurring in the pulverized YCrO3single crystal in the whole studied temperature range within the present experimental resolution.The small difference between collected and calculated XRPD patterns(Fig.1)and the low values of goodness of fit(Table 1) further validate our refinements. The refined unitcell of the orthorhombic structure is exhibited in Fig. 2, and all extracted crystallographic information at 40 K,150 K,and 300 K is listed in Table 1.
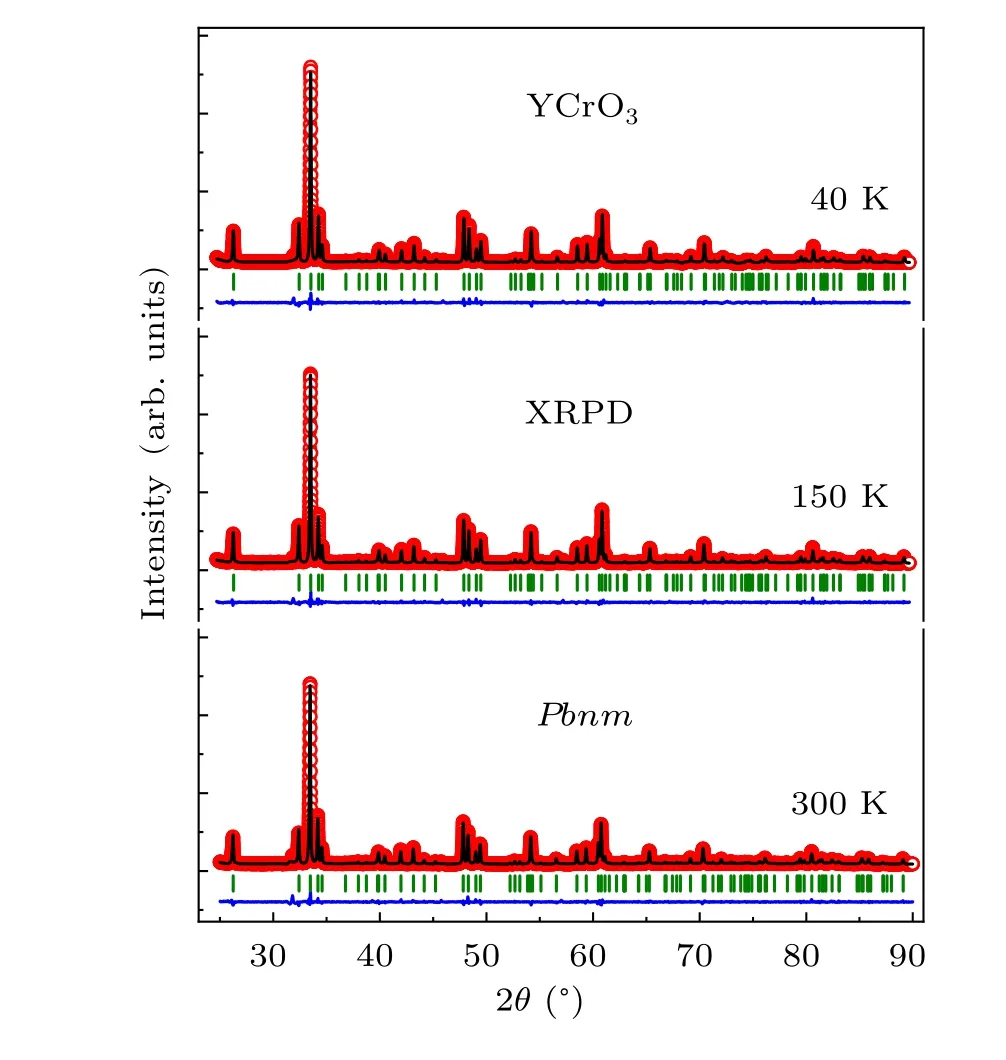
Fig. 1. Observed (circles) and calculated (solid lines) XRPD patterns of a pulverized YCrO3 single crystal,collected at 40 K,150 K,and 300 K.The vertical bars mark the positions of Bragg reflections, and the lower curves represent the difference between observed and calculated patterns.
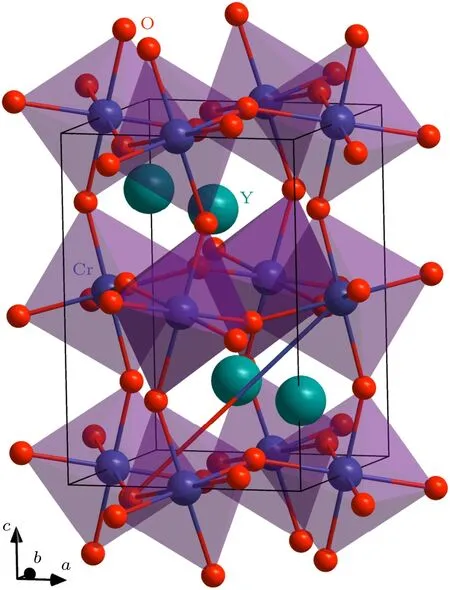
Fig. 2. Orthorhombic crystal structure (space group: Pbnm) with one unit cell(solid lines)of a YCrO3 single crystal at 300 K.The CrO6 octahedra are highlighted in purple.

Table 1. Refined structural parameters of a pulverized YCrO3 single crystal at 40 K,150 K,and 300 K,including lattice constants,unit-cell volume,atomic positions,isotropic thermal parameter(B),bond lengths,and the distortion parameter Δ.We listed the Wyckoff site of each ion and the goodness of fit. The numbers in parenthesis are the estimated standard deviations of the(next)last significant digit.
3.2. Magnetization
Figure 3 shows the magnetization versus temperature of a small YCrO3single crystal. We converted the unit of the vertical axis toµBper Cr3+ion. The difference between ZFC and FC data is probably caused by the movement of magnetic domain walls instead of a spin-glass like transition.[35]Upon cooling, the ZFC and FC magnetization curves remain extremely small until~141.58(5) K, around which the two curves increase simultaneously and sharply in a small temperature range of~5 K. With further cooling down to 1.8 K,a smooth increase appears in the FC curve, whereas an almost linear drop occurs in the ZFC curve. This indicates a reasonable canted AFM phase transition. At 1.8 K, ZFC magnetization=1.02(1)×10-3µB/Cr3+.
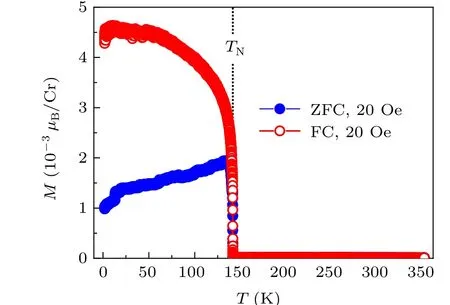
Fig. 3. Temperature dependence of the ZFC and FC magnetization (M) of chromium ions in a YCrO3 single crystal measured at B=20 Oe.
Figure 4(a) shows the measurements of magnetic hysteresis loop at 5 K, 90 K, and 135 K. Figure 4(b) displays clearly the narrow quasi-parallelogram hysteresis loops in applied magnetic field range of~-0.1 T to 0.1 T. At 5 K, a coercive force of~84.26 Oe and a residual magnetization of~1.19(2)×10-2µB/Cr3+were determined. An increase of temperature to 90 K or 135 K diminishes the coercive force and the residual magnetization. The observed loops resemble the characteristic features of a soft ferromagnet at low temperatures. Thus there exists a coexistence of AFM and weak ferromagnetic behaviors in YCrO3belowTN~141.58(5)K.

Fig. 4. (a) Magnetic hysteresis loops of a YCrO3 single crystal measured in a field range of -14 T to 14 T at 5 K, 90 K, and 135 K. (b) For a clear comparison,we displayed the loops in a narrow field regime.
3.3. Anisotropic magnetostriction effect
The refined lattice parametersa,b,andcfrom our XRPD studies are shown as void symbols in Fig.5. The corresponding change in unit-cell volumeVis depicted in Fig. 6. As is well known,the YCrO3compound is an insulator.[34]Thus the contribution of electrons to the thermal expansion of lattice parameter(ε)can be neglected. The non-magnetic contribution to the thermal expansion is then mainly from phonons. Thus it can be approximately estimated according to the Gr¨uneisen rules at zero pressure with a second-order form,[36-38]i.e.,
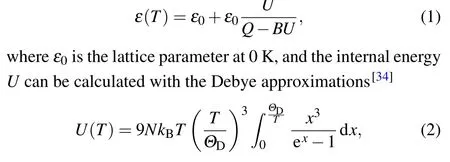
whereN=5 is the number of atoms per formula unit, andΘD=580 K is the Debye temperature.[31]With Eqs. (1) and(2), we fit the lattice parameters of YCrO3in a temperature range of 150-300 K (in the paramagnetic state) and extrapolate the fits to overall temperatures shown as solid lines in Figs. 5 and 6. The values of the fitting parameters ofε0,Q,andBare listed in Table 2. It is obvious that belowTN, the fitting to the unit-cell volume deviates gradually from the refined values(Fig.6). Differences exist between refined values
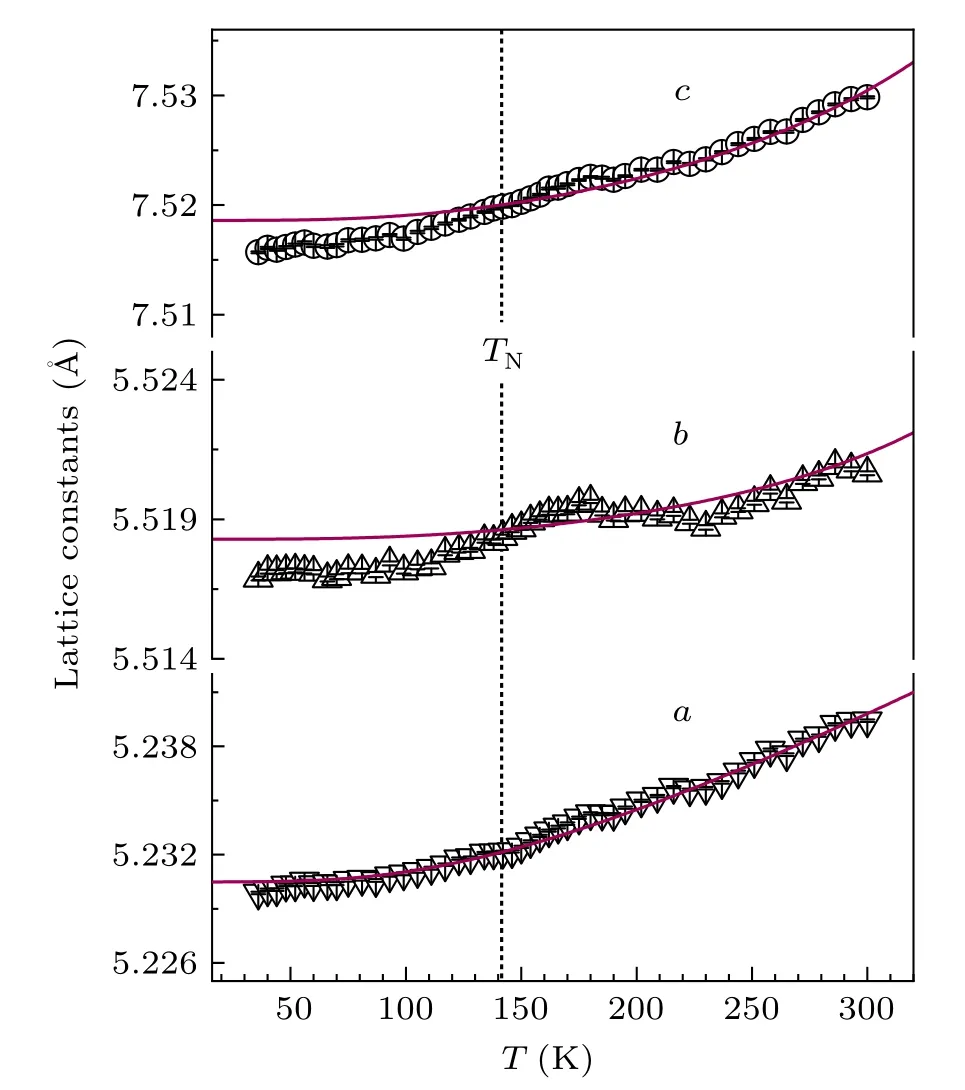
Fig.5. Temperature-dependent lattice constants a,b,and c of a pulverized YCrO3 single crystal(void symbols),which was extracted from our refinements based on the XRPD data collected from 36 K to 300 K. The solid lines are theoretical estimates of the variation of structural parameters using the Gr¨uneisen model as discussed in the text with a Debye temperature ΘD=580 K.The data was fit in paramagnetic state and extrapolated to overall temperature range. TN labels the AFM transition temperature. Error bars are the standard deviations obtained from the refinements.
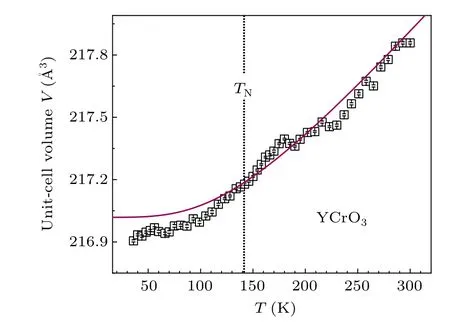
Fig. 6. Temperature-dependent unit-cell volume, V, extracted from the refinements. The solid line is theoretical estimate of the variation of unit-cell volume using the Gr¨uneisen model. We fit the data in paramagnetic state and extrapolate to overall temperature range. The vertical short-dotted line implies the AFM transition temperature TN. Error bars are the standard deviations obtained from the refinements.
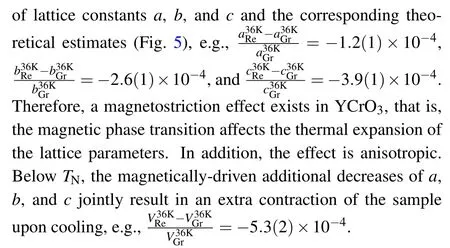
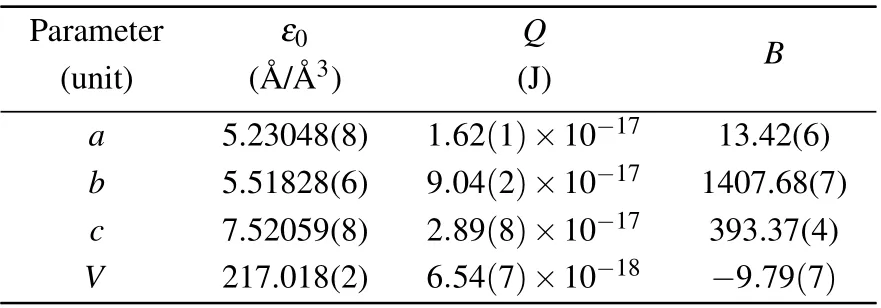
Table 2. Values of the fitting parameters while estimating a,b,c, and V of YCrO3 compound with Eqs. (1) and (2) in a temperature range of 150-300 K(Figs.5 and 6).The numbers in parenthesis are the estimated standard deviations of the last significant digit.
3.4. Local distortions of Y,Cr,and O ions
Local crystalline environment can be quantitatively evaluated by the distortion parameterΔ,[8,13,14,39]i.e.,

wherenis the coordination number,diis the bond length along one of thencoordination directions, and〈d〉is the average bond length. We calculated the local distortion parameterΔversus temperature for Y, Cr, O1, and O2 ions as shown in Fig. 7. In principle, there is no Jahn-Teller effect for Cr3+ions. The calculated local distortion parameterΔof Cr3+ions keeps almost a constant of~1.04329×10⁻⁴in the whole studied temperature range. By contrast, Y, O1,and O2 ions have much largerΔvalues, more than one order of magnitude larger than that of Cr ions. For example, at 40 K,Δ(O2)≈2.48Δ(O1)≈3.81Δ(Y)≈137.88Δ(Cr), indicating that there are significant local distortions of Y, O1,and O2 ions,which could break the local centrosymmetry and produce geometric ferroelectricity.
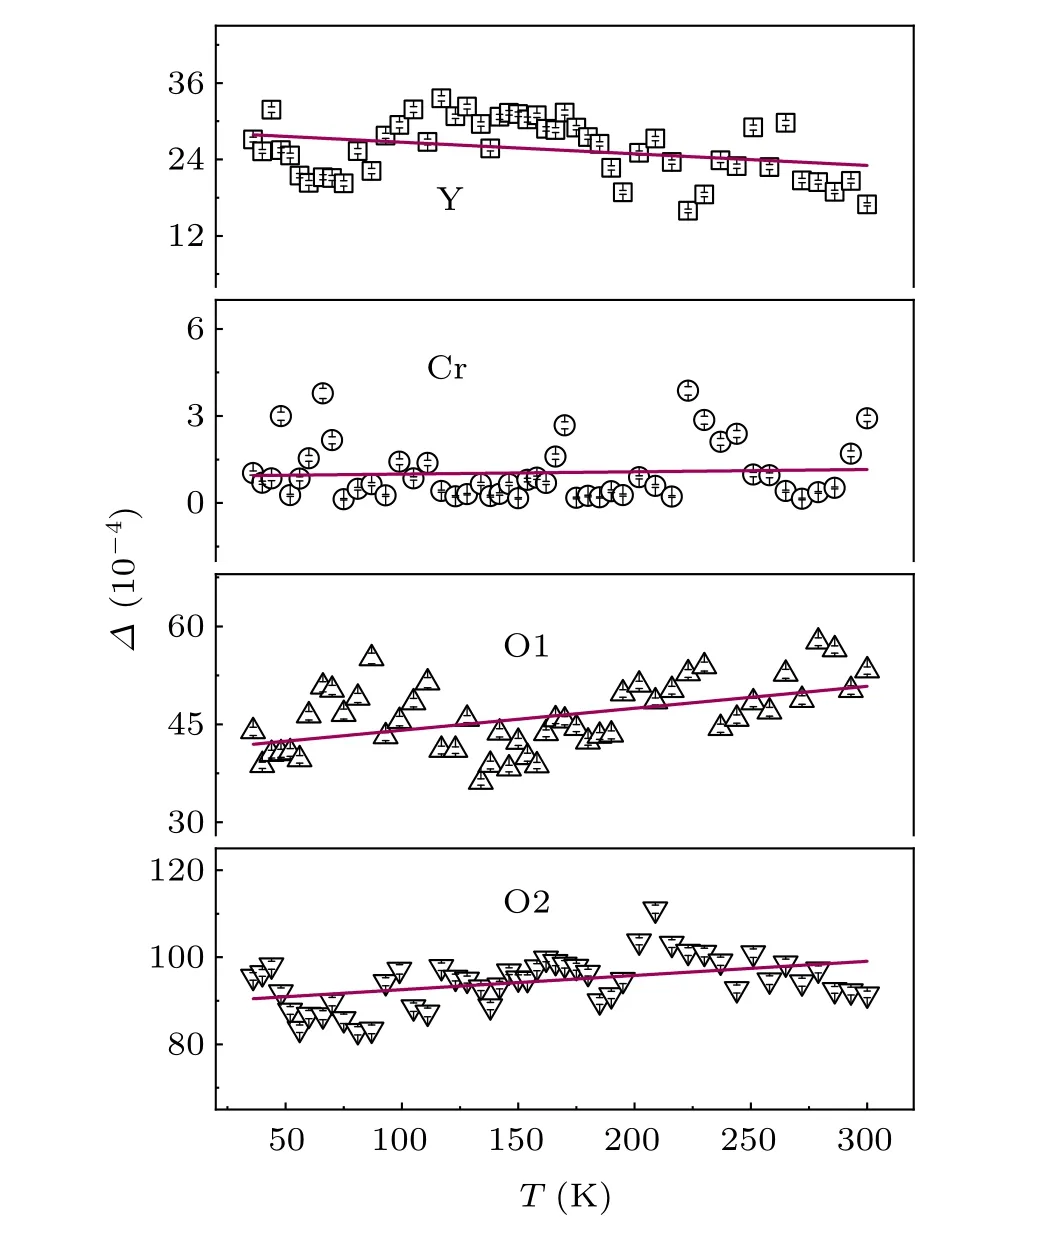
Fig. 7. Temperature variation of the distortion parameter, Δ, of Y, Cr, O1,and O2 ions of a single-crystal YCrO3 (void symbols)from 36 K to 300 K.Error bars are the standard deviations obtained from the refinements. The solid lines are tentative linear fits.
3.5. Bond valence states of Y,Cr,and O ions
BVSs are defined as the classical valence shared with each bond.[40]From the refinements, we extracted the BVSs of Y, Cr, and O ions as shown in Fig. 8. The BVSs of Y and O ions almost decrease linearly as the temperature increases, whereas that of Cr ions nearly increases linearly. In the whole studied temperature range, the BVS of Y ions is largely smaller than 3+, and that of O2 ions is much larger than 2-. Therefore, it is clear that Y and O2 ions show subduction charges. We calculated the average BVS values of Cr and O1 ions, i.e., 2.958(7)+and 2.093(7)-, respectively.By contrast, the average BVS values of Y and O2 ions are 2.661(9)+ and 1.763(6)-. They deviate largely from the ideal values of 3+ (for Y ions) and 2- (for O2 ions). The two nonequivalent O1 and O2 ions show a charge difference~0.330 e-indicative of a big charge disproportion.
Figure 9 shows the temperature-dependent values of isotropic thermal parameterBof Y,Cr,and O1/O2 ions. During refinements, we constrainedB(O1) to be same asB(O2).The parameterBis called Debye-Waller factor or temperature factor, describing the attenuation of diffraction intensity caused by the thermal motion of regularly-arranged electrons in x-ray diffraction. As temperature increases, theBvalues of Y (from 150 K to 300 K), Cr, and O1/O2 ions (the whole temperature range) almost increase linearly (Fig. 9). This is consistent with the decrease in the x-ray diffraction intensities of Bragg peaks as shown in Fig. 1. It is noted that blow~150 K,theBvalues of Y ions have no obvious changes.
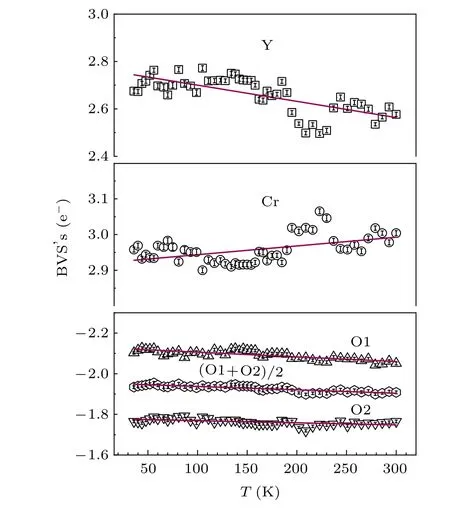
Fig.8.Temperature variation of the bond valence states of Y,Cr,O1,and O2 ions of a single-crystal YCrO3 from 36 K to 300 K(void symbols). We calculated the average bond valence states of O1 and O2 ions,i.e.,(O1+O2)/2.Error bars are the(propagated)standard deviations.
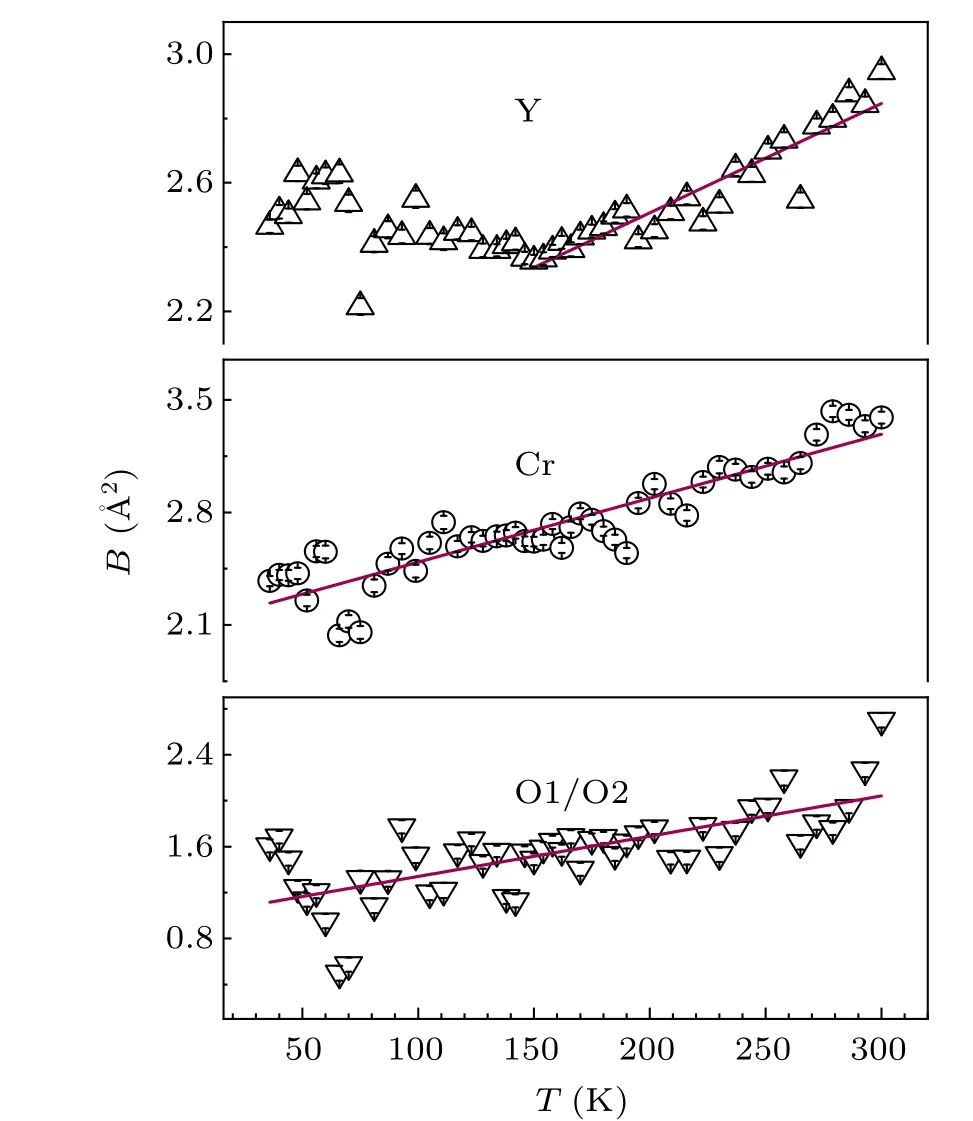
Fig. 9. Temperature variation of the isotropic thermal parameters, B, of Y,Cr, and O1/O2 ions of a single-crystal YCrO3 (void symbols). During refinements,we constrained the B values of O1 and O2 ions as the same.Error bars are standard deviations obtained from the refinements.
It is stressed that the space groupPbnmbelongs to a centrosymmetric point group that has an inversion center. All building elements display inversion symmetry. Therefore, in such a space group, no net polar forms, thus no ferroelectricity appears. We observed much larger local distortions of Y, O1, and O2 ions and clear subduction charges of Y and O2 ions, therefore, we infer that there may exist local noncentrosymmetric domains. This could be the origin of the reported ferroelectricity observed in YCrO3compound.
4. Conclusions
In summary, we carried out a detailed temperaturedependent XRPD study on a pulverized YCrO3single crystal grown by a laser-diode FZ technique. In the whole studied temperature range of 36-300 K,we did not find any crystalline structural phase transitions and thus indexed all collected XRPD patterns with an orthorhombic structure. By FULLPROF refinements,we extracted structure parameters of lattice constants, unit-cell volume, atomic positions, bond lengths,local distortions, BVSs, and thermal factors. We determined the AFM phase transition temperatureTN=141.58(5) K by the temperature-dependent magnetization study and found the weak ferromagnetism with the observation of magnetic hysteresis loops from 5 K to 135 K. We observed an anisotropic magnetostriction effect below the AFM phase transition temperature as demonstrated by the deviations of lattice parameters (a,b,c, andV) from the Gr¨uneisen law. The local distortions (Δ) of Y, O1, and O2 ions are much larger than that of Cr ions. We found that both Y and O2 ions display large charge displacements from theoretical values of 3+ and 2-,respectively. We suggest that local distortions of Y and O2 ions could be the reason for the observed ferroelectric characteristic in YCrO3compound.
Acknowledgements
Authors acknowledge the opening project of State Key Laboratory of High Performance Ceramics and Superfine Microstructure (Grant No. SKL201907SIC), Science and Technology Development Fund, Macao SAR, China (File Nos. 0090/2021/A2 and 0051/2019/AFJ), Guangdong Basic and Applied Basic Research Foundation,China(Guangdong-Dongguan Joint Fund No. 2020B1515120025), University of Macau (MYRG2020-00278-IAPME and EF030/IAPMELHF/2021/GDSTIC), and Guangdong-Hong Kong-Macao Joint Laboratory for Neutron Scattering Science and Technology(Grant No.2019B121205003).
猜你喜欢
金桥(2022年6期)2022-06-20
华人时刊(2022年7期)2022-06-05
老年博览·上半月(2020年3期)2020-09-22
杭州师范大学学报(自然科学版)(2020年4期)2020-08-07
书香两岸(2020年3期)2020-06-29
老年博览·上半月(2020年1期)2020-02-10
杂文月刊(2019年18期)2019-12-04
老年博览·上半月(2019年2期)2019-09-10
初中生世界·七年级(2019年6期)2019-08-17

- Chinese Physics B的其它文章
- Quantum walk search algorithm for multi-objective searching with iteration auto-controlling on hypercube
- Protecting geometric quantum discord via partially collapsing measurements of two qubits in multiple bosonic reservoirs
- Manipulating vortices in F =2 Bose-Einstein condensates through magnetic field and spin-orbit coupling
- Beating standard quantum limit via two-axis magnetic susceptibility measurement
- Neural-mechanism-driven image block encryption algorithm incorporating a hyperchaotic system and cloud model
- Anti-function solution of uniaxial anisotropic Stoner-Wohlfarth model