
Evolution of defects and deformation mechanisms in different tensile directions of solidified lamellar Ti-Al alloy
2022-04-12 03:47YutaoLiu刘玉涛TinghongGao高廷红YueGao高越LianxinLi李连欣MinTan谭敏QuanXie谢泉QianChen陈茜ZeanTian田泽安YongchaoLiang梁永超andBeiWang王蓓
Chinese Physics B 2022年4期
Yutao Liu(刘玉涛) Tinghong Gao(高廷红) Yue Gao(高越) Lianxin Li(李连欣) Min Tan(谭敏)Quan Xie(谢泉) Qian Chen(陈茜) Zean Tian(田泽安)Yongchao Liang(梁永超) and Bei Wang(王蓓)
1Institute of New Optoelectronic Materials and Technology,College of Big Data and Information Engineering,Guizhou University,Guiyang 550025,China
2College of Computer Science and Electronic Engineering,Hunan University,Changsha 410082,China
Keywords: molecular dynamics simulation,solidified lamellar Ti-Al alloy,tensile directions,γ/α2 interface
1. Introduction
The Ti-Al-based alloy is a promising candidate to replace Ni-based superalloys in the automotive and aerospace industries. This is mainly attributed to its low density,high strength retention,high specific strength,and high creep resistance.[1,2]However, the primary concerns with single-crystalline and polycrystalline Ti-Al alloys are their low yield strength and poor ductility at room temperature.[3]Recently, Ti-Al alloys were formed entirely from lamellar colonies composed ofγ-TiAl andα2-Ti3Al, which exhibit excellent ductility and strength across a wide range of temperatures.[4,5]
In the two-phase lamellar Ti-Al alloy(γ-TiAl with an L10type of face-centered cubic (FCC) structure whileα2-Ti3Al with a DO19type of hexagonal close-packed(HCP)structure),the interface between different phases can be eitherγ/α2orγ/γ, and their orientation always follows the Blackburn relationship,(111)γ//(0001)α2,[1-10]γ//〈11-20〉α2.[6]In previous studies, the plastic deformation of lamellar Ti-Al alloy mainly appeared in theγ-TiAl phase because the number of slip systems is greater than theα2-Ti3Al phase and the quite considerable hardness ofα2-Ti3Al.[7,8]Theγ-TiAl has three major competing deformation modes: 1/2〈110]ordinary dislocation,〈101] superlattice dislocation and{111}〈11-2] true twin.[9]These deformation modes strongly depend on orientation due to both the unidirectional nature of twinning and the polarization of superlattice dislocation.[10]Therefore, the two-phase Ti-Al alloy shows strongly anisotropic mechanical properties. Chenet al.[11]successfully prepared lamellar Ti-Al alloy using a directional solidification method and investigated its mechanical properties. They reported that the sample’s yield strength with 0°lamellar orientation exceeded 45°.Palomares-Garc´ıaet al.[12]examined the deformation mechanisms of lamellar Ti-Al alloy with lamellae oriented at 0°,45°,and 90°to the compress direction. Their results uncovered a large plastic anisotropy. Moreover,Panet al.[13]reported that when the nanotwins were tilted at 15°of the deformation axis,a necklace-type of dislocation could be produced,which helps to maintain the structure’s stability. Hence, it is important to understand the deformation direction effect on the mechanical properties of lamellar Ti-Al alloys.
However,experimental deformation tests are tedious,expensive, and hard to directly observe at the atomic scale. In recent years, several studies have shown that molecular dynamics (MD) simulation is an effective tool that can provide physical insights into the understanding of the deformation behavior of materials at an atomic level and can enable one to predict the mechanical properties.[8,14-16]But in these research studies,lamellar samples were created artificially,such as by using the Atomsk software based on Voronoi tessellation methods. Nevertheless,in the initial configuration there is dislocation at theγ/α2interface because of the lattice mismatch.Furthermore, solidification plays an important role in metal processing, such as casting and additive manufacturing. The structure after solidification is distinctly different from single crystal counterparts. In high-performance materials,the study of the defects’evolution and the mechanical response of materials at the nanoscale on deformation is important.
To better understand the influence of solidified defects on the tensile response, in this work, based on MD simulation,we apply a rapid solidification method with a cooling rate of 0.01 K/ps to produce a lamellar Ti-Al alloy sample. The influences of theX-,Y-,andZ-axes under three different tensile directions on the sample, the evolution of defects, and structure deformation mechanisms are investigated.
2. Simulation method
MD simulations of rapid solidification and deformation of solidified Ti-Al alloy processes were conducted using a simulation box comprising 32000 atoms (24000 Ti and 8000 Al atoms). The EAM potential was adopted to model the interatomic of the Ti-Al system since it was extensively used to simulate the rapid solidification and deformation process,and the results agree well with the experimental data.[17-20]We utilized 3D periodic boundary conditions and an invariant timestep of 0.001 ps.
First, the solidification simulation was conducted under constant pressure and constant temperature (NPT ensemble) using the Nose-Hoover thermostat and Parrinello-Rahman method to control the temperature and vacuum. Before quenching,we obtained the equilibrium liquid by relaxing the system for 100 ps at 2000 K(higher than the experimental melting point of Ti-Al alloy).[21]Then,the system was cooled down to 200 K with a cooling rate of 0.01 K/ps. Second, the solidified sample was deformed in tension by a straining box at a strain rate of 2×10⁹s-1along theX-,Y-, andZ-axes at 200 K under a canonical (NVT) ensemble by running for 200 ps,respectively. For visualization and defect analysis purposes,the open visualization tool(OVITO)together with common neighbor analysis (CNA)[22]and dislocation extraction algorithm(DXA)commands[23]were used.
3. Results and discussion
3.1. Solidified lamellar sample
Figure 1(a) shows the solidified Ti-Al lamellar sample.It can be seen that the sample consists of an FCC phase separated by a HCP phase, an extrinsic stacking fault (ESF), an intrinsic stacking fault (ISF), and a twin (the ESF, ISF, and the twin correspond to 3, 2, and 1 in Fig. 1(d), respectively).To identify the structure type, the simulated powder x-ray diffraction pattern (XRD) was adopted and the conclusion is shown in Fig. 1(b). According to the experiment and simulation XRD peaks,[24,25]we find that the structure consists ofγ-TiAl+α2-Ti3Al. Note that, because of the limited simulation size, the strength and width of the XRD peaks cannot be directly compared with the experimental data. Under nonequilibrium rapid solidification conditions, the sample could be defective and could have dislocation lines and voids distribution, as shown in Fig. 1(c). Interestingly, multiple dislocation lines intersect with each other to form a dislocation junction located at the grain boundary (the black circle in Fig.1(c)). From it, we can see the dislocation lines are dominated by Shockley dislocation and its distribution along the grain boundary. Figures 1(d)-1(f)show the view from theX-,Y-, andZ-axes, and the tensile angles along theX-,Y-, andZ-axes with theγ/α2interface are about 17°,73°,and 0°,respectively (Fig. 1(d)). Continuous other atoms that form the grain boundary are found in Fig.1(f).
3.2. Different responses of the structure under three loading directions
In Fig.2,the stress-strain curves,number of crystal structural types, and dislocation density behavior have been employed to explore the effect of orientation simulations with tensile loading along theX-,Y-,andZ-axes. Before the material failure, the process of tensile deformation can be divided into elastic deformation(stage I),the yield stage(stage II),and the work hardening stage (stage III) (Figs. 2(a)-2(c)). In the elastic deformation stage (I), the relationship between stress and strain increases linearly until pointsa,d,andgalong theX-,Y-,andZ-axes,respectively,which agrees with the results of the theoretical Hooke’s law. At this stage,the lamellar Ti-Al alloy will return to its original configuration if the load is removed. With the increase in tensile strain, the sample begins to enter the yield stage (II), and the linear relationship between stress and strain is broken. When the strain surpasses pointsb,e, andh, the stress continues to increase with the strain during the working hardening stage. The pointsc,f,andiare the maximum strain before material fracture; then,the stress experienced a sharp decrease. The tensile response of the three loading directions exhibits strong anisotropy,and the stress-strain curves of the tensile response along theYandZ-directions drop slightly to pointseandh, respectively,which is the so-called yield point. However, no significant yield point was found in theX-direction stretching process.Thus, according to Fig. 1(d), showing the strain corresponding to the maximum value of HCP atoms,we mark pointbin Fig.1(a)as the yield point of theX-direction. Table 1 shows the strain and stress of nine points and elastic modulus of three directions. It is obvious that the critical strength and elongation along theX-direction are the highest but the elastic modulus is smaller thanYandZ. The elastic modulus of the Ti-Al alloy in experimental data is about 120-140 GPa,[26]demonstrating that the simulation results are in excellent agreement with experimental values.

Fig.1. A schematic of the initial solidified lamellar sample. (a)An overall view of the sample. (b)The XRD pattern. (c)Dislocation lines and voids distribution. The winered,blue,green,red,and yellow lines represent the other,perfect,Shockley,stair-rod,and Hirth dislocations,respectively. The cyan surface was colored according to DXA defect mesh. (d), (e)and(f)are the views from the X-,Y-, and Z-axes, respectively. Atoms are colored based on their spatial coordinates of the DXA algorithm: blue→FCC,yellow→HCP,green→BCC,and white→other.
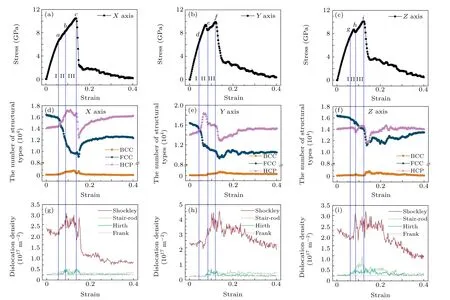
Fig.2. (a)-(c)Tensile stress-strain curves,(d)-(f)the number of crystal structural types,and(g)-(i)dislocation densities as a function of strain for the X-,Y-,and Z-axes,respectively.
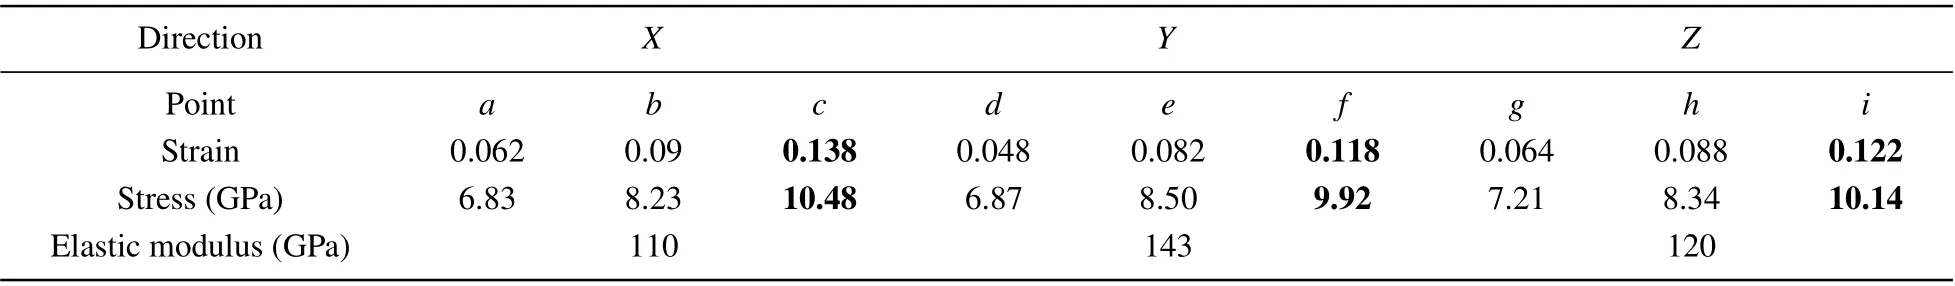
Table 1. Physical parameters of nine points. The maximum strain and stress under three loading directions are indicated in bold.
Understanding the variation of crystal structural types during the tensile process is of great significance when determining the evolution of a microstructure. Figures 2(d)-2(f)show the evolution of structure types in theX-,Y-, andZaxes during the stretching process.The variation trend of HCP atoms in the three directions is somewhat different,while the number of FCC atoms decreases all the time before the whole breaking. In stage I, the number of HCP atoms experiences a small increase in three directions. After this, the material enters stage II, and the HCP atoms undergo a rapid increase in theX- andY-directions, reaching a maximum in theXdirection but decreasing rapidly after reaching a maximum in theY-direction. However, the HCP atoms in theZ-direction increase slightly and then decrease. During stage III,the number of HCP atoms in theX-andY-axes drops slightly,but the HCP atoms’ tensile response along with theZ-axis rises and then remains unchanged. It is well known that theγ-TiAl is much softer than theα2-Ti3Al, so the number of HCP atoms increases because of the dislocation movement during plastic deformation caused by stacking faults and grain boundary defects formed by HCP in theγ-TiAl phase.Therefore,the structural changes may be obvious when observed together withXandY-direction deformation. The FCC and HCP atoms are increased after tensile fracture due to stress relaxation accompanied by strain microstructure recovery.[18]Few BCC atoms will be formed during the tensile process, and the number is too small to wildly fluctuate during the stretching process.
Figures 2(g)-2(i) show the densities of Shockley, stairrod,Hirth,and Frank dislocation evolution. The Shockley dislocation is almost dominant in the system, while the Frank dislocation always zeroes. In the elastic deformation stage I,the Shockley dislocation slowly decreases in theX- andZdirections while, in theY-direction, it should slightly fluctuate. When the strain enters stage II,the Shockley dislocation monotonically increases as the strain increases. At stage III,the Shockley dislocation experiences complex variation.However,after the strain surpasses pointsc,f,andi,the Shockley dislocation experiences a jump-up and then drop-off in three directions and a subsequent decrease in volatility. This trend indicates that the fracture of the alloy is attributed to the nucleated Shockley dislocation.The stair-rod and Hirth dislocations after stage I have a modest increase then continue fluctuating.Interestingly,the stair-rod dislocation in theZ-direction has a sudden increase then a drop followed by eventual maintenance of a small number of fluctuations(Fig.2(i)). The stair-rod dislocation as a motionless dislocation has a significant effect on material enhancement.[27]Therefore, the slope of the strainstress curve in theZ-direction is greater than in the other two at stage III.
DefineΦas the angle between the tensile direction of the lamellar boundaries. In general, the yield strength and ductility depend onΦ. The lamellar crystal exhibits the highest strength but low ductility whenΦ= 90°. There is a good balance between ductility and strength atΦ=0°, where the strength is not as high as forΦ=90°but ductility is large at 5%-10%.[28]ButΦ=17°,73°,0°corresponds to theX-,Y-,andZ-axes in this paper, respectively. However, the ductility and strength ofΦ=17°are higher than the other two. This is because the lamellar structural lattice obtained by solidification herein is imperfect and defective. The defects formed by solidification may considerably influence the deformation of materials.
3.3. Analysis of microstructure evolution
To further investigate the deformation behavior of tensile loading along theX-,Y-, andZ-axes from an atomic viewpoint,snapshots of microstructure evolution in solidified samples at nine points are listed in Fig.3. The atoms are colored using the DXA algorithm. When the tensile direction is along theX-axis,it is found that the Shockley dislocation begins to nucleate atεa=0.062(in the circle, the arrow represents the direction of dislocation motion). As the strain increases toεb=0.09, the system appears to have ISFs that are parallel to each other. Furthermore, the ESF is transformed into ISFs along the direction of the black arrow (inside the rectangular box),and it is also accompanied by a Shockley dislocation. Atεc=0.138, mutually parallel ISFs and from those ESFs that have transformed into ISFs intersect to form junctions. Simultaneously,in the deformation zone ofγ-TiAl,there are only a few dislocation lines; however, in the tensile direction of theY-axis,the ISF first nucleates beside the ISF formed by initial solidification atεd=0.048 and then moves along the black arrow direction.When the strain increases toεe=0.082,the part of the ESF begins to transform into the HCP phase.At the critical strain ofεf=0.118,the structure of the system began to produce major disruptions, and the Shockley dislocation nucleated again. At this point, the bulk of the HCP phase has formed at the original ISF and ESF positions;the tensile along theZ-axis, in which the structure has not changed too much,is quite different from theX-, andY-axes. Atεg= 0.064,the Shockley dislocation first formation in the FCC phase then spreads toward the HCP phase. Before material fracture, the ISFs have been formed across the HCP phase with Shockley dislocation.
In brief, regardless of the tensile direction, ISFs are mainly formed accompanied by the Shockley dislocation. In addition,ISFs were formed that intersect each other in theXdirection, indicating that only a single slip system with a slip plane was active during the deformation process,except for the stacking defects evolution. However, when stretching along theY-direction, the pre-existing ISF and ESF formed a large HCP structure in the case of tensile deformation;therefore,the phase transition of FCC to HCP occurred in the tensile direction ofY. The structure of the system does not change much,except for the movement of dislocations before the alloy fracture.
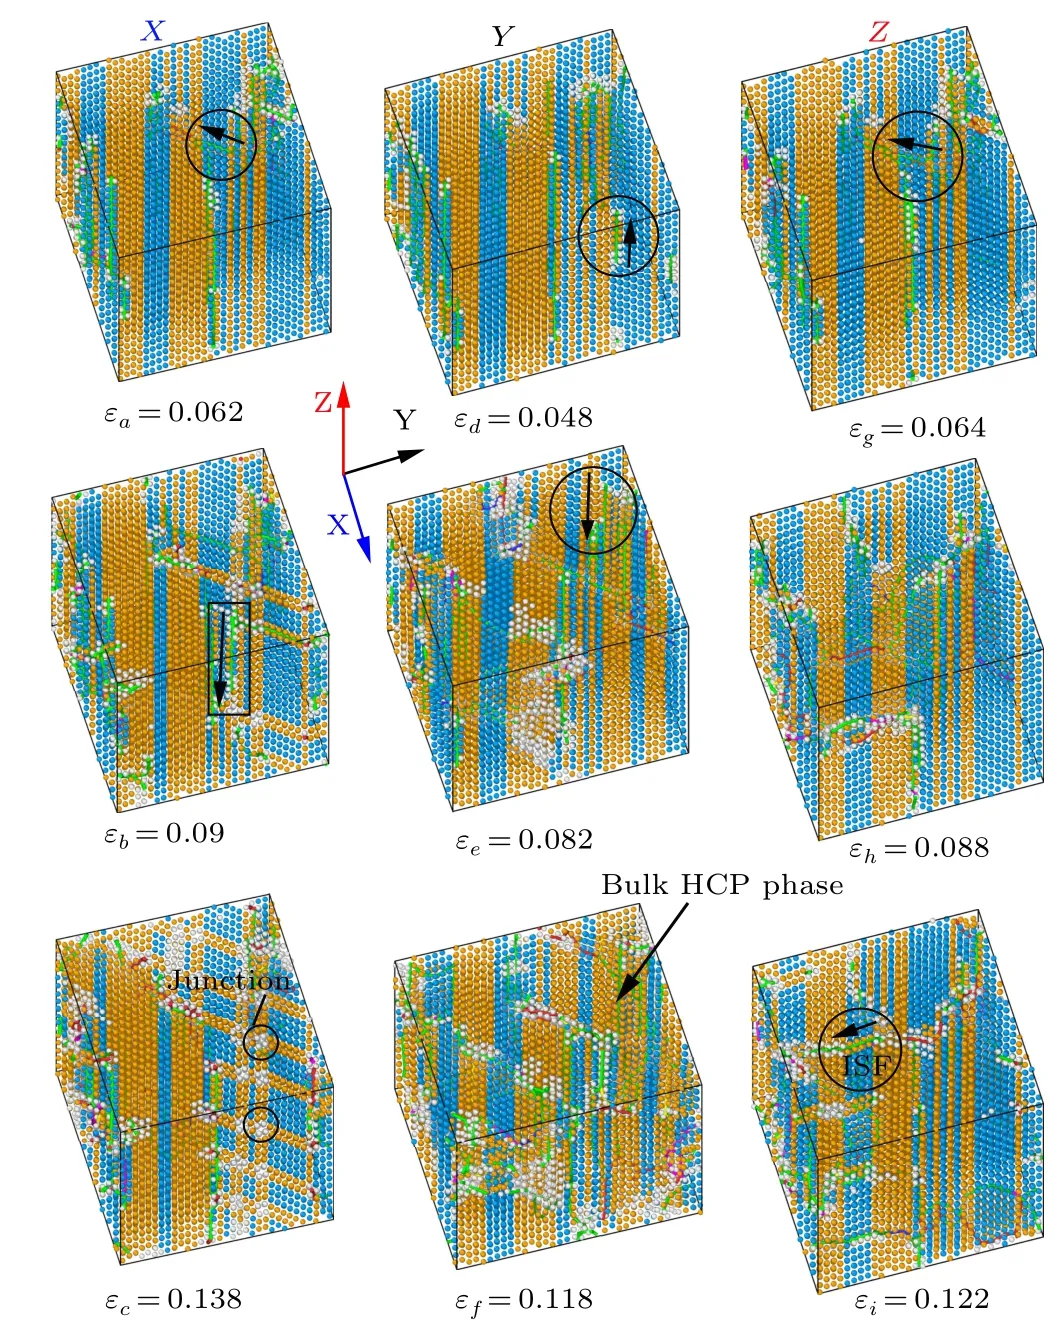
Fig. 3. Evolution of the solidified sample structure during tensile deformation. Atoms are colored by the DXA algorithm,and blue,yellow,green,and white represent FCC,HCP,BCC,and other atoms,respectively.The winered,blue,green,red,and yellow lines represent the other,perfect,Shockley,stairrod,and Hirth dislocations,respectively.
3.4. The sample fracture mechanism
The dislocation motion remarkably during the tensile process. According to Fig. 3, theεc=0.138,εf=0.118, andεi=0.122 are the maximum critical strains under deformation along theX,Y, andZdirections, respectively. To determine the effect of atomic movement on the structure,the atomic displacement distribution map of maximum strain before material fracture of the three directions has been drawn in Fig. 4. We can see the movement of atoms leads to delamination of the structure. The atomic displacement not only moves along the dislocation motion direction but also along with the interface of theγ/α2phase. Therefore, cleavage cracking may easily occur on theγ/α2interface.
In addition, when deformation occurs along theX-axis,the system forms intersecting ISFs,indicating that atomic motions are easily carried out in this direction. The intersecting ISFs enhance the stability of the structure during tensile,which leads to the best plasticity and strength in theX-direction.When it is tensile in theY-direction, the FCC phases in the ESF and ISF regions are transformed into the HCP phase, so the atomic motion is hindered due to the less-slip system in the HCP phase, resulting in less plasticity than in the other two directions.

Fig.4. The atomic structure corresponding to the maximum strain points in the three directions. (a) and (d) The structures at εc =0.138. (b) and (e)The structures at εf =0.118. (c)and(f)The structures at εi=0.122. (a)-(c)Atoms are colored by displacement results. (d)-(f)Atoms are colored by the CNA algorithm. Blue, yellow, green,and white represent FCC,HCP,BCC,and Other atoms,respectively.
3.5. Evolution of dislocation and voids
In the lamellar structure ofγ-TiAl/α2-Ti3Al,α2-Ti3Al with the HCP structure is the harder phase, whereasγ-TiAl with the FCC structure is the softer phase. Hence, if the lamellar sample has a perfect lattice ofγ-TiAl/α2-Ti3Al, the microvoids, or cracks, prefer forms in the Ti3Al lamellae.[8]However, if the lamellar sample has dislocation, voids and a grain boundary in the alloy initially, the failure mode may considerably differ. In particular,the maximum stresses of theγ/α2system along theX-,Y-, andZ-axes are 0.138, 0.118,and 0.122, respectively. As shown in Fig. 5, under loading along theX-axis, although there are some voids in the structure while the crack nucleates in the dislocation junction located at the grain boundary by solidification (Fig. 1(c)), the dislocation lines at theγ/α2interface intersect to form a new dislocation junction. However, no accumulation of dislocation lines was found at grain boundaries. With the increase in strain, the crack continued to expand at the grain boundary leading to material failure. Therefore,the crack nucleation in the solidified sample cannot be attributed to the dislocation pile-up process but results from the sliding at the grain boundary,which was formed by solidification when tensile along theX-axis. The shear stresses increase rapidly during the sliding of the grain boundary and lead to the sample fracture. When the deformation loading occurs along theY- andZ-axes, the dislocation evolution does not occur with theγ/α2interface but shows a random distribution. The main voids or dislocation junction nucleation occur at the grain boundary initially,but the formation of the void and expansion at the dislocation junction position occur due to the increase in strain, so the fracture mechanism can be attributed to the dislocation pileup.According to Fig. 2(h), the density of Shockley dislocation lines is greater thanZ; this may make it easy to form the dislocation junction,thereby causing the lamellar sample failure,and the maximal stress is less than when the tensile is along theZdirection.

Fig. 5. Snapshots of the solidified lamellar sample at different deformation stages under three directions. The surfaces and dislocations are colored by the DXA command,and the cyan surfaces are the cracks or voids. The dislocation line’s color scheme is consistent with Fig.3.
4. Conclusion and perspectives
MD simulation utilizing the EAM potential is used to examine the evolution of defects and deformation mechanisms in different deformation directions of solidified lamellar Ti-Al alloy.The lamellar Ti-Al alloy was created by rapid solidification with a cooling rate of 0.01 K/ps.The XRD pattern demonstrates the structure consists ofγ-TiAl andα2-Ti3Al phases.Tensile deformation of the lamellar structure along theX-,Y-,andZ-axes is observed at 17°, 73°, and 0°to theγ/α2interface. The following conclusions can be obtained from this study.
(i)The stress-strain behavior of the solidifiedγ/α2lamellar system shows strong anisotropy. The strength and ductility loading at 17°exceeds those at 73°and 0°because the intersecting format of ISFs enhances the structure’s stability.
(ii)The mechanical properties of the sample are strongly influenced by solidified defects. The structure deformation and fracture occurred primarily via ISFs accompanied by the nucleated Shockley dislocation. During tensile loading at 73°,the adjacent ESF and ISF formed by solidification tend to form large HCP structures.
(iii) The plastic anisotropy of the lamellar sample is attributed to dislocation movement and localized slip of theγ/α2interface. Thus, for the lamellar structure under tensile deformation, cleavage cracking easily occurs on theγ/α2interface.
(iv)The fracture mechanism of loading at 17°is the grain boundary sliding whereas, for the loadings at 73°and 0°, the dislocation piled up to form the dislocation junction.
Acknowledgments
Project supported by the National Natural Science Foundation of China (Grant Nos. 51761004, 51661005, and 11964005), Industry and Education Combination Innovation Platform of Intelligent Manufacturing and Graduate Joint Training Base at Guizhou University (Grant No. 2020-520000-83-01-324061), the Guizhou Province Science and Technology Fund, China (Grant Nos. ZK[2021] 051, [2017]5788, and J[2015] 2050), High Level Creative Talent in Guizhou Education Department of China, and the Cooperation Project of Science and Technology of Guizhou Province,China(Grant No.LH[2016]7430).
- Chinese Physics B的其它文章
- Quantum walk search algorithm for multi-objective searching with iteration auto-controlling on hypercube
- Protecting geometric quantum discord via partially collapsing measurements of two qubits in multiple bosonic reservoirs
- Manipulating vortices in F =2 Bose-Einstein condensates through magnetic field and spin-orbit coupling
- Beating standard quantum limit via two-axis magnetic susceptibility measurement
- Neural-mechanism-driven image block encryption algorithm incorporating a hyperchaotic system and cloud model
- Anti-function solution of uniaxial anisotropic Stoner-Wohlfarth model