
Dependence of nitrogen vacancy color centers on nitrogen concentration in synthetic diamond
2022-04-12 03:47YongLi李勇XiaozhouChen陈孝洲MaowuRan冉茂武YanchaoShe佘彦超ZhengguoXiao肖政国MeihuaHu胡美华YingWang王应andJunAn安军
Chinese Physics B 2022年4期
关键词:李勇
Yong Li(李勇) Xiaozhou Chen(陈孝洲) Maowu Ran(冉茂武) Yanchao She(佘彦超) Zhengguo Xiao(肖政国)Meihua Hu(胡美华) Ying Wang(王应) and Jun An(安军)
1Department of Physics and Electrical Engineering,Tongren University,Tongren 554300,China
2School of Mechanical Electronic and Information Engineering,China University of Mining and Technology,Beijing 100083,China
3School of Materials Science and Engineering,Henan Polytechnic University,Jiaozuo 454003,China
Keywords: high pressure and high temperature,diamond,nitrogen-vacancy color centers
1. Introduction
As a functional material, diamond has been commonly used and extensively researched.[1-5]Because of its stable fluorescence and unique physical characteristics,diamond plays a role as a suitable platform for solid-state quantum information processing (QIP) and quantum information science.[6-8]Besides quantum computing, the color centers in diamond have important potential applications in the fields of life science,imaging technology,magnetic resonance,etc. Nitrogen impurities combine with vacancy defects to form electrically neutral NV0centers. As shown in Fig. 1, an electronegative NV-center is established when an electron is captured by an electrically neutral NV0center.Recently,research on nitrogen vacancy(NV)color centers has aroused much interest among scientists,because the NV color center in diamond is an important physical system for emergent quantum technologies, including quantum metrology,information processing and communications, as well as for various nanotechnologies. The NV-center and the NV0center coexist in many systems.[9]However,the relationship between nitrogen concentration and NV centers in synthetic diamond has not been studied in detail. In view of this, diamond crystals with different nitrogen concentrations, including<1 ppm, about 300 ppm and>1000 ppm, were synthesized to investigate the relationship between nitrogen impurity concentration and NV color centers.
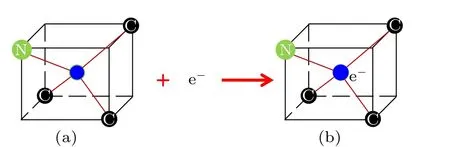
Fig.1. Structure of the NV color centers in diamond: (a)NV0 color center,(b)NV- color center.
Furthermore,only the NV-color center has been proved to possess unique quantum properties such as optical spin readout and a long room-temperature ground state electron coherence time.[10]To be suitable for practical quantum and biological applications, the first criterion is to obtain a larger NV-/NV0ratio.[11]Generally,the NV-/NV0ratio can be adjusted by electron irradiation, ion implantation and annealing treatment.[11,12]Additionally, many applications require bright, stable single-photon sources with long decoherence times.[10]Therefore, an enormous challenge is whether it is possible to directly synthesize diamonds containing only NVcolor centers. In this work, diamond crystals are synthesized by high pressure and high temperature (HPHT) technology,which is an advanced technique for synthesizing and capturing novel properties of materials.[13-17]
2. Experimental description
Diamond synthesis experiments were carried out on a China-type largevolume cubic high-pressure apparatus(CHPA) with a highprecision temperature and pressure control system, using the temperature gradient growth (TGG)method. Highpurity graphite (99.9% purity) was used as the carbon source for homogeneous epitaxial growth of diamond.FeNiCo alloy was employed as a catalyst in order to reduce the growth conditions required for diamond. A synthetic diamond of size about 0.8 mm was adopted as a seed crystal and the (111) surface of the seed crystal was selected as the growth face. A pyrophyllite composite block was used as the peripheral material for diamond synthesis,and played the role of sealing and pressure transmission. In order to obtain diamond with very low nitrogen concentration, Ti and Cu additives were used into the synthesis cavity to eliminate nitrogen impurities in the cavity,avoiding the incorporation of nitrogen impurities in the diamond as much as possible. Additionally,carbonyl nickel powder was selected as an additive to obtain diamond with a higher nitrogen concentration. The high experimental temperature was achieved when there was a huge current in the graphite tube. The synthesis temperature was calibrated using a Pt6%Rh-Pt30%Rh thermocouple. The synthesis pressure was calibrated through the change in resistance of standard substances at room temperature and the graphitediamond equilibrium at high temperature.[18]The principle of diamond crystal growth under HPHT conditions can be described as follows.The highest temperature of the heating tube was at the middle position during the synthesis process and the temperature decreased gradually along the vertical axis. In the synthesis cavity,the carbon source was placed at the highest temperature and the crystal seed was located at the cold end. FeNiCo catalyst with a height of about 2 mm was placed at the interspace between the carbon source and crystal seed.Therefore, a temperature gradient was generated between the carbon source and the seed crystal. The carbon source, dissolved into the FeNiCo catalyst at the high temperature region, is transported to the vicinity of the seed crystal by the driving force of the temperature gradient. Then, the transported carbon crystallizes on the seed crystal to achieve epitaxial growth of diamond. We did not cut off the heat source directly at the end of the experimental synthesis in order to avoid the generation of crystal cracks. We took a slow cooling approach,reducing the temperature over 2 h from the synthesis temperature to room temperature. After the synthesis experiments,the metal catalyst surrounding the diamond was removed with boiling dilute HNO3. Then, the rest of the impurities remaining on the crystal surfaces could be cleaned by immersing the diamond in boiling aqua regia. The diamond samples were then ultrasonically treated with distilled water for the following measurements. In this study,the synthesized crystals were characterized by Raman, Fourier transform infrared(FTIR)and photoluminescence(PL)spectroscopy. Raman spectra were recorded on a Renishaw inVia Raman microscope with backscattering geometry using the 532-nm line of an argon ion laser. The acquisition time for each sample was 60 s, monitored with a charge coupled device detector system. The infrared absorption spectra were measured with a Vertex80 V FTIR spectrometer, with a spectral range between 400 cm-1and 4000 cm-1and a spectral resolution of 2 cm-1in the transmittance mode. The PL spectra were measured with a 532-nm excitation at room temperature.
3. Results and discussion
During the diamond crystallization process, the synthesis pressure was consistently set at 6.5 GPa and the synthesis period was 10 h. In order to obtain type IIa diamond with a nitrogen concentration<1 ppm, the appropriate amount of Ti/Cu was simultaneously added to the synthesis system during the diamond crystallization growth process. The role of Ti was to combine with nitrogen to create an environment free of nitrogen impurities. Then, the presence of Cu could promote the decomposition of the generated TiC to guarantee the denitrogenation ability of the Ti additive. The synthesized crystal was colorless and transparent, displaying hexoctahedral morphology with not much difference between the(111)and(100)faces (Fig. 2, diamond A). The obtained sample (Fig. 2, diamond B)without any additive in the synthesis system showed a yellow color and displayed octahedral morphology. However,the as-grown crystal when carbonyl nickel powders were added to the synthesis system (Fig. 2, diamond C) was atrovirens (a dark green) with hexoctahedral morphology. The weights of the obtained samples A, B, and C were 5.2, 20.6,and 12.7 mg, respectively. Correspondingly, the growth rates of diamond crystals A, B and C were 0.52 mg/h, 2.06 mg/h,and 1.27 mg/h,respectively.
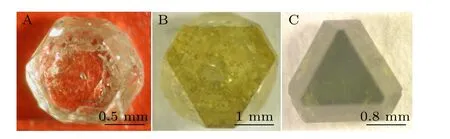
Fig.2. Optical images of the synthesized diamond crystals A,B,and C.
Raman spectroscopy is an effective and non-destructive method to distinguish the sp3hybrid diamond phase and the sp2hybrid graphite phase. The full width at half maximum(FWHM)of the ideal diamond should be zero in strict accordance with the spatial lattice arrangement. In fact,the crystal lattice and orientation were not completely consistent during the crystallization process, and there was a certain broadening. Therefore, the FWHM reflects the quality of crystallization to a certain extent. The crystal quality became worse as the FWHM gradually increased. The FWHM of perfect natural diamond can be shortened to 1.5 cm-1. As shown in Fig.3,the FWHM values of the three crystals obtained using Gaussian fitting were 3.41 cm-1, 3.37 cm-1, and 3.54 cm-1,due to the presence of impurities in the diamond structure.Correspondingly,Raman characteristic peaks of diamonds A,B, and C were located at 1330.11 cm-1, 1329.81 cm-1, and 1329.56 cm-1, respectively, with straight background lines.The peaks centered at 1343 cm-1and 1560 cm-1resulting from the graphite-related phase are not seen in Fig. 3, indicating that the synthesized diamond crystals are of high quality.[19]
To identify the forms of nitrogen impurity in the diamond structure, FTIR spectra of diamonds A and C were recorded and are shown in Fig.4. As we know, the synthetic diamond only contained C-centers from nitrogen impurities and the concentration of C-centers in the obtained diamond is about 300 ppm-400 ppm,defined as type Ib,and grown from a metal-carbon system without any additives under HPHT conditions.[20]In the FTIR spectra, the typical peaks located at 1130 cm-1and 1344 cm-1result from C-center nitrogen impurities and the absorption centered at 1282 cm-1is the characteristic peak attributed to A-center N pairs.[21]Figure 4(a) shows that the signals corresponding to 1130 cm-1,1344 cm-1, and 1282 cm-1are all absent, indicating that the nitrogen impurity concentration of diamond crystal A was<1 ppm,classified as type IIa. However,it can be seen from Fig. 4(b) that the characteristic peaks located at 1130 cm-1,1344 cm-1,and 1282 cm-1all exist in the FTIR curve,proving that both C-center and A-center nitrogen impurities are present in the diamond lattices. The corresponding C-center and A-center nitrogen impurity concentrations for diamond C were approximately 1030 ppm and 180 ppm, evaluated according to the accepted computational formulae as follows:[22]
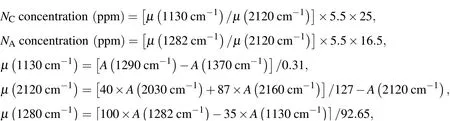
whereNCandNArepresent the concentrations of C-center and A-center impurities, respectively, andµis the absorption intensity of the corresponding peaks. Additionally,Ais the obtained value of FTIR absorbance. Due to the production process,the carbonyl nickel powder contains a certain number of nitrogen impurities. Furthermore,the dissolubility of nitrogen impurities in liquid metal is related to the d-shell electronic structure of the metal atoms. Therefore, the higher the electron unsaturation in the d-shell, the stronger the solubility of nitrogen impurities in the liquid metal. Because the number of electrons in the d-shell of Fe, Co, and Ni is 6, 7, and 8,respectively,this means that nitrogen solubility is lowest in elemental Ni.Therefore,this creates an environment with a high concentration of nitrogen impurities for diamond growth, resulting in a high concentration of C-center nitrogen impurities.It is because of the higher nitrogen concentration in the growth environment that nitrogen probably entered into the diamond lattices in the form of nitrogen atom pairs. Hence, A-center nitrogen emerged in the as-grown diamond crystal C.[21]
PL measurements were performed for the synthesized diamond crystals to investigate the optical-center defects in the diamond structure;the results are displayed in Fig.5. Signals at 573 nm and 637 nm were not observed in the PL spectrum of diamond A,implying that there were neither nitrogen nor NV0and NV-optical centers in the structure of diamond A.[23,24]The fundamental reason for this was that almost no nitrogen impurities combined with vacancies in the diamond.However,Ni-related color centers at 695 nm and 793.6 nm were detected in diamond A.[25]Among these, the PL peak at 793.6 nm is attributed to the NE8 optical center,which has more potential applications than the common NV centers. In the spectrum for diamond B in Fig. 5, the typical PL peaks at 573 nm and 637 nm were found at the same time,indicating that both NV0and NV-color centers coexist in the synthesized crystal. Furthermore, the intensity at 573 nm is much stronger than that at 637 nm. Although the concentration of C-center nitrogen defects in diamond C reached as high as 1030 ppm,the crystal did not contain neutral NV0optical color centers but only NV-color centers. The line at 752.8 nm is associated with nickel defects.[26]The charge states of NV color center defects in diamonds probably change with the concentration of single substitutional nitrogen, with the more negative charge states being favored at high nitrogen concentrations.[27]
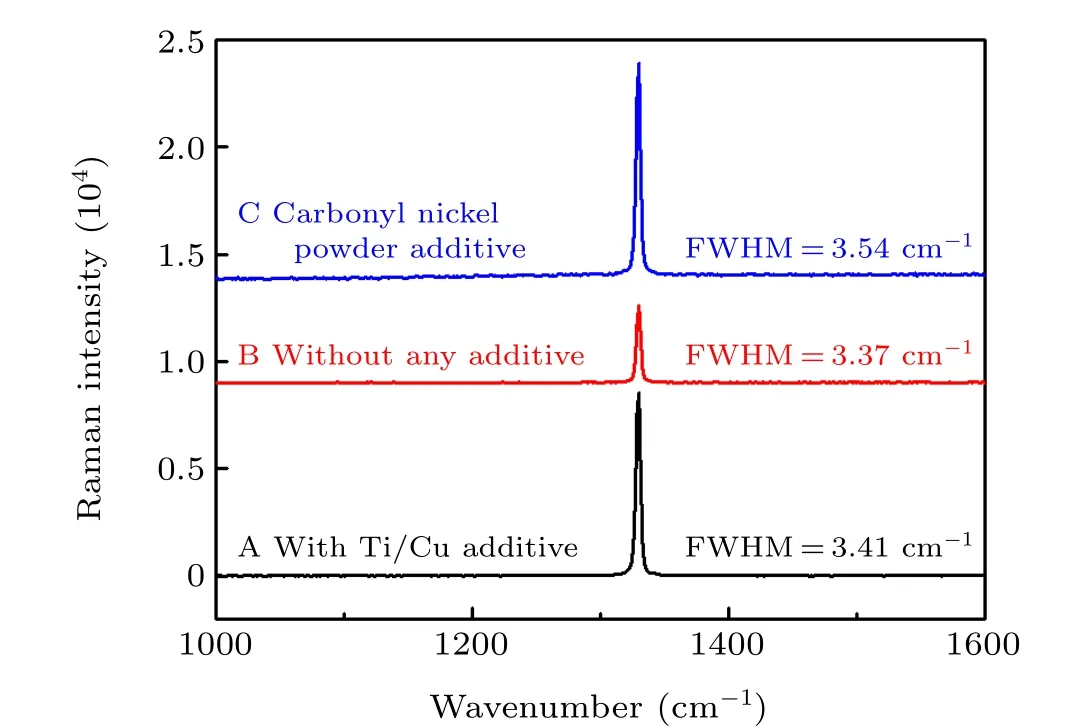
Fig.3. Raman spectra for the obtained crystals: (a),with Ti/Cu additive;(b),with no additive;(c),with added carbonyl nickel powder.
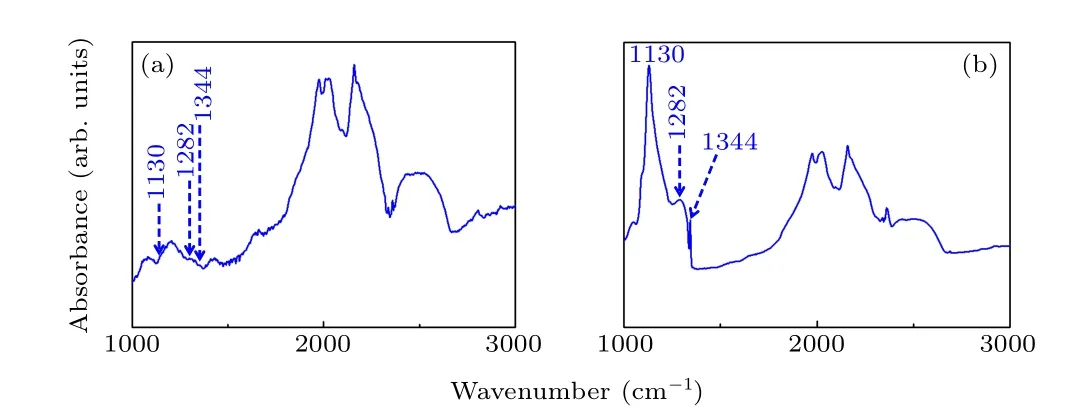
Fig.4.FTIR spectra of the obtained crystals(a)with Ti/Cu additive(diamond A),(b)with carbonyl nickel powder additive(diamond C).
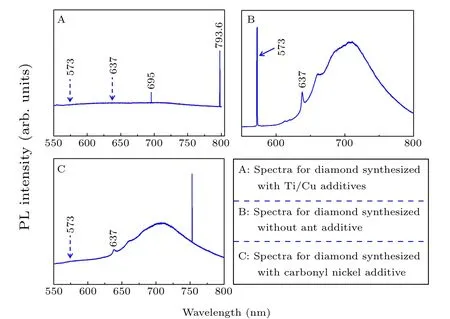
Fig.5. PL spectra of the synthesized diamond crystals(A,B,and C)taken at room temperature.
4. Conclusion
Diamond single crystals with nitrogen concentrations(<1 ppm,about 300 ppm,1210 ppm)were successfully synthesized in a FeNiCo-C system by the TGG method at pressure of 6.5 GPa. Raman measurements show that only the sp3hybrid diamond phase existed in the synthesized diamond crystals.Type IIa diamonds did not contain NV color centers but contained nickel-related color centers. Both NV0and NV-color centers existed in Type Ib diamond.However,the as-grown diamond crystal with a higher nitrogen concentration contained NV-color centers instead of NV0color centers.
Acknowledgments
Project supported by the National Natural Science Foundation of China (Grant Nos. 12064038 and 52072113),the Natural Science Foundation of Guizhou Province Science and Technology Agency (Grant Nos. ZK[2021]019 and ZK[2021]031), the Outstanding Young Science and Technology Talents of Guizhou Pronice, China (Grant No. [2019]5673), and the Open Project of Inner Mongolia Key Lab of High-pressure Phase Functional Materials(Grant No.cfxygy202004).
猜你喜欢
Chinese Physics B(2022年8期)2022-08-31
小天使·一年级语数英综合(2021年11期)2021-11-23
中国粮食经济(2020年11期)2020-12-23
齐鲁艺苑(2019年5期)2019-11-09
河北画报(2019年3期)2019-05-24
艺术家(2019年2期)2019-03-21
畅谈(2016年22期)2017-10-10
小小说月刊·下半月(2017年3期)2017-03-07
诗潮(2016年2期)2016-03-12
汽车零部件(2014年4期)2014-06-23
- Chinese Physics B的其它文章
- Quantum walk search algorithm for multi-objective searching with iteration auto-controlling on hypercube
- Protecting geometric quantum discord via partially collapsing measurements of two qubits in multiple bosonic reservoirs
- Manipulating vortices in F =2 Bose-Einstein condensates through magnetic field and spin-orbit coupling
- Beating standard quantum limit via two-axis magnetic susceptibility measurement
- Neural-mechanism-driven image block encryption algorithm incorporating a hyperchaotic system and cloud model
- Anti-function solution of uniaxial anisotropic Stoner-Wohlfarth model