
Deep learning facilitated whole live cell fast super-resolution imaging
2022-04-12 03:45YunQingTang唐云青CaiWeiZhou周才微HuiWenHao蒿慧文andYuJieSun孙育杰
Chinese Physics B 2022年4期
Yun-Qing Tang(唐云青) Cai-Wei Zhou(周才微) Hui-Wen Hao(蒿慧文) and Yu-Jie Sun(孙育杰)
1Institute of Systems Biomedicine,School of Basic Medical Sciences,Peking University Health Science Center,Beijing 100191,China
2Academy for Advanced Interdisciplinary Studies,Peking University,Beijing 100871,China
3State Key Laboratory of Membrane Biology,Biomedical Pioneer Innovation Center(BIOPIC),Beijing 100871,China
4School of Life Sciences,Peking University,Beijing 100871,China
5School of Future Technology,Peking University,Beijing 100871,China
Keywords: optical microscopy,imaging and optical processing,image processing
1. Introduction
Resolution enhancement is at the heart of the development of microscopic technologies and is therefore a longterm goal for researchers. Since the beginning of the 21st century, super-resolution fluorescence imaging technologies that break the far-field optical diffraction limit, i.e., the Abbe limit that was established about 150 years ago, have been greatly developed. At present there are three main types of super-resolution fluorescence microscopy imaging technologies widely used in life science research. Stimulated emission depletion (STED) technology, which uses a Gaussian-shaped excitation laser and a doughnut-shaped depletion laser, minimizes the effective point spread function.[1-7]Single-molecule localization microscopy (SMLM), including photoactivated localization microscopy(PALM)and stochastic optical reconstruction microscopy (STORM), labels samples with a photoactivatable or photoswitchable fluorescent probe. Superresolution images are reconstructed by collecting and localizing a large number of single molecules.[1,8-11]Structured illumination microscopy(SIM)[1,12-16]and image scanning microscopy (ISM)[1,17-32]are based on the use of a known spatially structured pattern (periodic sine pattern or Gaussianshaped spot) of excitation light. The resolution of STED is roughly 40 nm-100 nm and the laser power applied is of the order of megawatts per square centimeter.[1-7]The spatial resolution of PALM/STORM can reach 10 nm-40 nm,while the temporal resolution is of the order of minutes and the laser power is of the order of kilowatts per square centimeter.[1,8]The resolution of SIM and ISM approach about half the Abbe limit,reaching 100 nm-150 nm,and the laser power is of the order of watts per square centimeter.[1,18-32]
Although the resolutions of SIM and ISM superresolution microscopies are not as high as those of STED and PALM/STORM, the latter two require a strong excitation power and special fluorescent probes. Therefore, superresolution imaging methods based on SIM and ISM technology are the most commonly used for live cell imaging.[1]Twodimensional structured illumination microscopy (2D-SIM)needs to collect nine frames of raw recording to reconstruct a super-resolution image with a spatial resolution of about 100 nm.[1]The spatial resolution of ISM is about 120 nm-150 nm,[1]and a super-resolution image can be obtained by only collecting one raw image. Due to the working principle,compared with 2D-SIM,ISM has the advantage of faster imaging(about nine times faster). In life sciences,fluorescence microscopy is a driving force for new discoveries. However,the observable phenomena are limited by the microscopic imaging method, the chemistry of the fluorophore and the maximum light exposure that the sample can withstand. These limitations result in a trade-off between imaging speed, spatial resolution,exposure and imaging field of view. Weigertet al.[33]demonstrated that a content-aware image restoration based deep learning method can achieve image enhancements both with confocal microscopy and wide-field microscopy.
Another application of deep learning is to convert different fluorescence imaging modalities (computational, nonoptical).[34]This data-driven method does not require numerical modeling of the imaging process or estimation of the point spread function, and is based on generative adversarial network training to convert diffraction-limited raw images into super-resolution images. For instance, it can convert a lowresolution confocal microscopy image to a super-resolution image close to STED microscopy.[34]A well-trained neural network can produce super-resolution images directly without any iteration or parameter search, and can be used as a lowcost super-resolution imaging technology.
Deep learning has also demonstrated its potential in SMLM. Because the imaging speed of SMLM is very limited(since it needs to accumulate thousands of image frames)the number of molecules detected in each frame is very few.Ouyanget al.[35]proposed artificial neural network accelerated PALM (ANNA-PALM), a computational strategy that uses artificial neural networks to reconstruct super-resolution image from sparse and rapidly acquired single-molecule positioning wide-field images. It significantly reduces acquisition time and sample light exposure, enabling a faster and high-throughput super-resolution imaging method that is compatible with biological samples. Using a deep convolutional neural network, based on a simulated and measured highdensity single-molecule positioning fluorescence image training set, Deep-STORM improves the performance of highdensity SMLM and can handle single-molecule data with a density of up to six emitters perµm2.[36]
Deep learning has not only been applied for 2D fluorescence microscopy imaging but also for 3D imaging to improve image qualities, for instance Deep-Z, SRRF-Deep,VCD-LFM,etc.[28,37,39]Deep-Z reconstructs 3D fluorescence images from a single 2D wide-field image, and improves the volumetric imaging speed significantly.[37]SRRF-Deep enhances the spatial and temporal resolution of 3D spinning disk confocal microscopy.[38]VCD-LFM enhances the reconstruction throughput and spatial resolution uniformity of 3D lightfield microscopy.[39]
At the same time, the field of view, imaging speed and image resolution are mutually restricted. As a state-of-the-art tool,deep learning methods have not yet been applied to highspeed super-resolution ISM.This work developed a fully convolutional encoder-decoder network(FCEDN)and applied it to super-resolution ISM (Olympus SpinSR10), achieving a 78µm×78µm field of view,an acquisition speed of 12.5 Hz-40 Hz and super-resolution imaging at the same time. Superresolution high-speed dynamic images of microtubules and cargoes with a large field of view were recorded for 30 s.Dynamic super-resolution motion of cargoes along the microtubules was observed. This method was also applied to conventional confocal microscopy,verifying its generality.
2. Methods
2.1. The FCEDN method
Deep learning is that part of a machine learning method concerned with algorithms and training datasets. The FCEDN method was inspired by high-density deep learning SMLM(Deep-STORM).[36]The FCEDN was separated into encoding and decoding stages,as shown in Fig.1.Input was normalized using the Min-Max scaling function and standardized by thez-score function before feeding into the network.[36]In the encoding stage,the preprocessed input images were transformed into feature maps by three encoding layers,each consisting of convolutional filters with increasing depth, batch normalization and rectified linear unit(ReLU),[40]and interleaved with 2×2 max-pooling layers. In the decoding stage, the feature maps were produced to the same size as the input image by three decoding layers,each consisting of convolutional filters with decreasing depth, batch normalization and ReLU, interleaved with 2×2 upsampling layers. Finally, a 1×1 convolutional filter was used to reduce the depth and produce the prediction. The size of each convolutional filter was 3×3.The network encoded the image with a low signal-to-noise ratio (SNR) into an aggregated feature map, then decoded and predicted the corresponding high-SNR image.
The optimization goal for training the deep learning models is determined by the loss function, and the loss function evaluates how well the algorithm models the datasets.[41]In this work,the loss function was defined as

wheregrepresents the ground truth(GT)image,prepresents the predicted image,irepresents a low-quality image,Θrepresents the parameters of FCEDN andNrepresents the number of images in the training set. The first term of Eq. (1) measures the squaredL2distance between the prediction and the ground truth. The second term represents theL1norm of the FCEDN’s prediction and is a regularization term to promote sparsity.
When training a deep learning model,batch size has significant impact on the performance. If the batch size is too small, the model became unstable and quickly converges to the local minimum. If the batch size is too large, the GPU memory of commonly available graphics cards is insufficient.We made a trade-off between model performance and GPU computational cost. After testing, the batch size was set to 16. The FCEDN was trained using an Adam optimizer with an initial learning rate of 0.001; other parameters were as defaults.[42]All experiments were executed in Python using Keras with a TensorFlow backend.[43]Training was performed on an Nvidia Tesla v100 GPU with 32 GB of video memory.In order to evaluate the performance, the structural similarity(SSIM)index between the image reconstructed by FCEDN and the GT image was calculated;[44]at the same time,in order to quantify the image enhancement,the SNR was evaluated[45]by
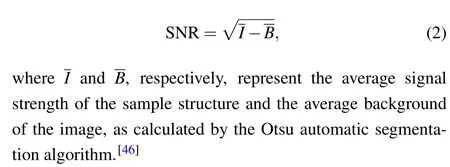
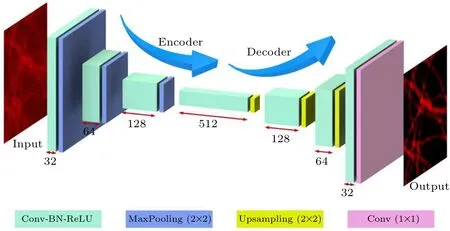
Fig.1. Neural network architecture. A set of low-SNR images was fed into the neural network to produce high-SNR images. The numbers below feature maps represent the number of convolutional filters in the corresponding block.
2.2. Cell culture
The Cos-7 cell line was purchased from the American Type Culture Collection(ATCC)and cultured in high-glucose Dulbecco’s modified Eagle’s medium(DMEM)supplemented with 1% 100 mM sodium pyruvate solution (S8636, Sigma-Aldrich)and 10%fetal bovine serum(FBS).The human retinal pigment epithelium (HRPE) cell line was provided by Professor Wei Guo (University of Pennsylvania) and cultured in DMEM/Ham’s F-12 (#11320033, Invitrogen) with 100 µg·ml-1penicillin, streptomycin (Invitrogen) and 10%FBS(#16010-159,Gibco).Cells were cultured in a 10 cm dish with cell culture medium under general conditions with 5%CO2at 37°C.For cell passage,after washing three times with phosphate buffered saline (PBS) (#14190500BT, Life Technologies), cells were digested with 0.25% trypsin (#25200-056, Gibco) for 1 min. Digestion was terminated with 10%FBS. All cells were negative for mycoplasma with a potential mycoplasma contamination test (MycoAlert, Lonza). To label microtubules and cargoes, HRPE or Cos-7 cells were seeded on preincubated glass coverslips for 24 h. Then, the plasmid DNA (4 µg MAP4-GFP and 0.5 µg SBP-mCherry-Ecadherin) was co-transfected into cells and downstream experiments were performed 24 h later.[47]
2.3. Electroporation
After digestion,cells were transiently transfected with an electroporation cup(#165-2086,Bio-Rad)using a 2D nucleofector device(Lonza). The programs X-001 and W-001 were designed for HRPE and Cos-7 cells. The electroporation solution was composed of solution I and solution II. Solution I included 0.12 g·ml-1MgCl2-6H2O(M2393,Sigma Aldrich)and 0.2 g·ml-1ATP-disodium salt (A2383, Sigma Aldrich)with pH 7.4. Solution II included 0.4 g·ml-1glucose (G-6152, Sigma Aldrich), 12 g·ml-1KH2PO4(P5655, Sigma Aldrich) and 1.2 g·ml-1NaHCO3(S-5761, Sigma Aldrich)with pH 7.4. After filter sterilization (0.22 µm), solutions I and II were mixed in the ratio of 1:50 and stored at 4°C.[47]
2.4. Plasmids

2.5. Immunofluorescence staining
Cells were seeded into a 35 mm cell culture image dish(#043520B, Shengyou Biotechnology) with 70% confluence.After 24 h, the cells were fixed with 4% paraformaldehyde containing 0.1% glutaraldehyde for 12 min at 37°C and washed twice with 2 ml PBS.Then,the cells were treated with 0.5 ml 0.1%NaBH4for 7 min at room temperature to quench the cell self-fluorescence and washed three times with 2 ml PBS.Cell membrane permeability was then blocked with 5%bovine serum albumin (BSA) (#001-000-162, Jackson) containing 0.5% Triton X-100 (Fisher Scientific) for 30 min at room temperature. All the antibodies used were prepared by dilution in 5%BSA containing 0.5%Triton X-100.Cells were incubated at room temperature for 40 min with an appropriately diluted primary antibody. After removal of the primary antibody, cells were washed three times with PBS for 5 min each time. The appropriate dilution of the dye-labeled secondary antibody was then incubated with the cells for 1 h at room temperature, hidden from light. After removal of secondary antibody, cells were washed five times with PBS for 5 min each time. Finally, cells were post-fixed for 10 min with 4% paraformaldehyde containing 0.1% glutaraldehyde.All specimens can be stored in PBS for a week at 4°C. If longer storage is required, all specimens should be cleaned three times in double-distilled water and then air-dried.[47]
2.6. Microscopy
Measurements were performed on an ISM Olympus SpinSR10 super-resolution spinning confocal fluorescence microscope. In its super-resolution (SoRa) mode, the spinning disk speed was set to 4000 rpm. The fluorescence was collected by an UPLAPO OHR 60× NA 1.5 objective and then passed through a four-band-pass D405/488/561/640 filter module. The detection optical path adopted a further 3.2×magnification,and the total magnification was 192 times. Signals were collected by a sCMOS camera(Hamamatsu ORCAFusion) with 2304×2304 pixels. The extended EM gain of the camera was set to 1 and the camera pixel clock was set to its highest speed, 480 MHz. The final size of the field of view on the object plane was 78µm×78µm. The setup was equipped with Coherent 405 nm, 488, 561 nm, and 640 nm lasers. The Olympus SpinSR10 can be switched to conventional spinning disk confocal mode. In our experiments, the UPLAPO OHR 100× NA1.5 objective was used without the further 3.2×magnification.The total magnification was 100×and the size of the field of view on the object plane was 149.8µm×149.8µm.
3. Results and discussion
Although deep learning has achieved great success in image processing,it has failed to be generalized to given images with unseen image patterns.[48,49]Therefore we trained two sets of the FCEDN model for microtubule and cargo datasets,applied respectively.
3.1. Microtubule FCEDN training
Fixed and immunofluorescence labeled Cos-7 cell microtubules were used for FCEDN training. Controlled microtubule images under five different imaging conditions were collected. The imaging conditions were the same except for the exposure time and the power of the 640 nm laser.Ninety-nine sets of 2304×2304 pixel images under five different imaging conditions randomly extracted 256×256 regions 100 times for each image. The training set was 39600 pairs of low-SNR regions (256×256) of images and high-SNR regions (256×256, GT) of images. In Fig. 2(a), the first row shows the raw images of microtubules with low SNR under different imaging conditions. The third row shows the GT images, and the second row shows the images reconstructed by the FCEDN.Figure 2(b)shows the imaging conditions from C1,C2,C3,C4 to GT respectively: exposure time(5 ms), laser power (7%); exposure time (5 ms), laser power(10%); exposure time (5 ms), laser power (20%); exposure time(5 ms),laser power(4%); exposure time(500 ms),laser power(100%). As shown in Fig.2(c),the SSIM between raw images under different experimental conditions (C1-C4), the FCEDN reconstructed images and the GT images increased from 5.71%,6.80%,10.18%,and 15.30%to 78.18%,80.57%,82.21%, and 81.21%, respectively. The corresponding SNRs were increased from 3.56,4.16,5.75 and 8.00 to 81.21,86.72,91.96,and 94.88,respectively.

Fig. 2. ISM microtubule FCEDN training. (a) Input, reconstructed and GT images of fixed Cos-7 cell microtubules. (b)Five imaging conditions for GT and conditions C1-C4. (c) Prediction error for data under imaging conditions C1-C4. The plots show SSIM for input and reconstructed images were significantly improved(higher is better). Scale bar=10µm.
3.2. Cargo FCEDN training
Fixed and immunofluorescence labeled Cos-7 cell cargoes were used for FCEDN training. Controlled cargo images under four different imaging conditions were collected.The imaging conditions were the same except for the exposure time and the 561 nm laser power. Ninety-nine sets of 2304×2304 pixel images under four different imaging conditions randomly extracted 256×256 regions 100 times for each image. The training set was 29700 pairs of low-SNR regions (256×256) of images and high-SNR regions(256×256, GT) of images. In Fig. 3(a), the first row shows the raw images of cargoes with low SNR under different imaging conditions. The third row shows the GT images, and the second row shows the images reconstructed by FCEDN.Figure 3(b) shows the imaging conditions from C1, C2, C3 to GT, respectively: exposure time (10 ms), laser power(100%);exposure time(20 ms),laser power(10%);exposure time (30 ms), laser power (100%); exposure time (500 ms),laser power (100%). As shown in Fig. 3(c), the SSIM between raw images under different experimental conditions(C1-C3), FCEDN reconstructed images and the GT images were increased from 20.14%,35.45%,and 46.21%to 91.26%,91.62%, and 91.79%, respectively. The corresponding SNRs were increased from 8.77, 12.21 and 14.65 to 45.21, 54.23,and 57.66,respectively.
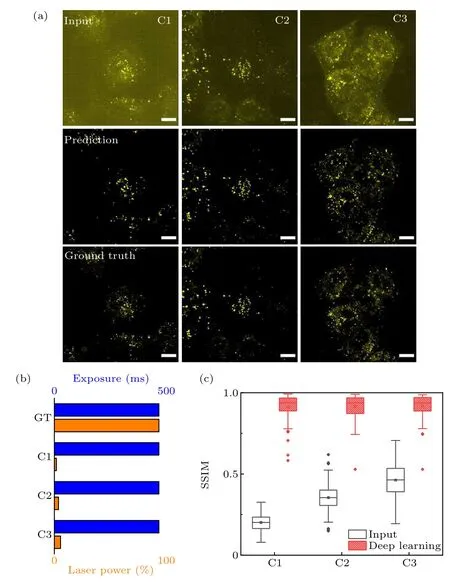
Fig.3. ISM cargo FCEDN training. (a)Input,reconstructed and GT images of fixed Cos-7 cell cargoes. (b) Four imaging conditions for GT and conditions C1-C3. (c) Prediction error for data at imaging conditions C1-C3.The plots show SSIM for input and reconstructed images were significantly improved(higher is better). Scale bar=10µm.
3.3. Live cell microtubule imaging
The well-trained microtubule FCEDN described in Subsection 3.1 then was used for dynamic imaging enhancement of HRPE living cell microtubules. Four hundred images of HRPE living cell microtubules were continuously collected with an exposure time of 10 ms and a frame rate of 40 Hz.It can be seen from Fig. 4 that as the acquisition time increases, the SNR of the raw image drops significantly due to photobleaching while the SNR of the image reconstructed by FCEDN only decreases slightly. SNRs were therefore improved by FCEDN by nearly 10 times.
3.4. Live cell microtubule and cargo two-channel imaging
We used MAP4-GFP and Lysotracker to label the microtubules and cargoes of living HRPE cells,and used 488 nm and 640 nm lasers for dual-color fluorescence excitation.Dynamic super-resolution images of microtubules and cargoes were continuously collected with the dual-color detection channel by an ISM with an imaging speed of 12.5 Hz. The exposure time was 10 ms.Figure 5(a)shows that using both well-trained microtubule and cargo FCEDNs described in Subsections 3.1 and 3.2 obviously improved the image quality,and the average SNR of microtubules and cargoes was increased from 4.37 and 3.95 to 79.27 and 18.61,respectively. The movements of cargoes were tracked by fluorescent image evaluation software for tracking and analysis (FIESTA).[5]The results show that FCEDN improved the positioning accuracy of cargoes from 15.83±2.79 nm to 2.83±0.83 nm, and more accurate cargo movement trajectories were obtained, as shown in Figs. 5(b)and 5(c).

Fig. 4. ISM FCEDN improves the SNR of living HRPE cell microtubules.(a) Raw images of 400 continuous image frames of living HRPE cell microtubules at different time points. (b) Microtubule image reconstructed by FCEDN.(c)The SNR of the raw microtubule image decreased with continuous acquisition. (d) The SNR of the microtubule image reconstructed by FCEDN remained largely constant. Scale bar=10µm.

Fig. 5. Dual-color imaging of cargo movements along microtubules in living HRPE cells. (a) Dual-color raw images of cargoes and microtubules and FCEDN reconstructed images. (b) Distribution of the uncertainty of raw and FCEDN reconstructed cargo positioning. The average values were 15.83±2.79 nm and 2.83±0.83 nm,respectively. (c)Raw cargo motion trajectory and as reconstructed by FCEDN.Scale bars: 10µm(left)and 2µm(right).
3.5. FCEDN cross-modality imaging
The microtubule FCEDN described in Subsection 3.1 trained with super-resolution ISM was also used to enhance conventional spinning disk confocal images. Image enhancement was obvious compared with the conventional spinning disk confocal images. Results for HRPE cell microtubules are shown in Fig.6. The laser power and exposure time were changed for different imaging conditions. To collect conventional spinning disk confocal images of microtubules, in all measurements(C1,C2,C3 and C4),laser powers were set as 4%, 5%, 7%, and 10% 561 nm, respectively, and exposure time was 10 ms for all. The SNRs of the raw images were 6.19, 6.86, 7.55, and 9.54, while the SNRs after FCEDN reconstruction were 83.62,85.14,80.04,and 81.42,respectively.
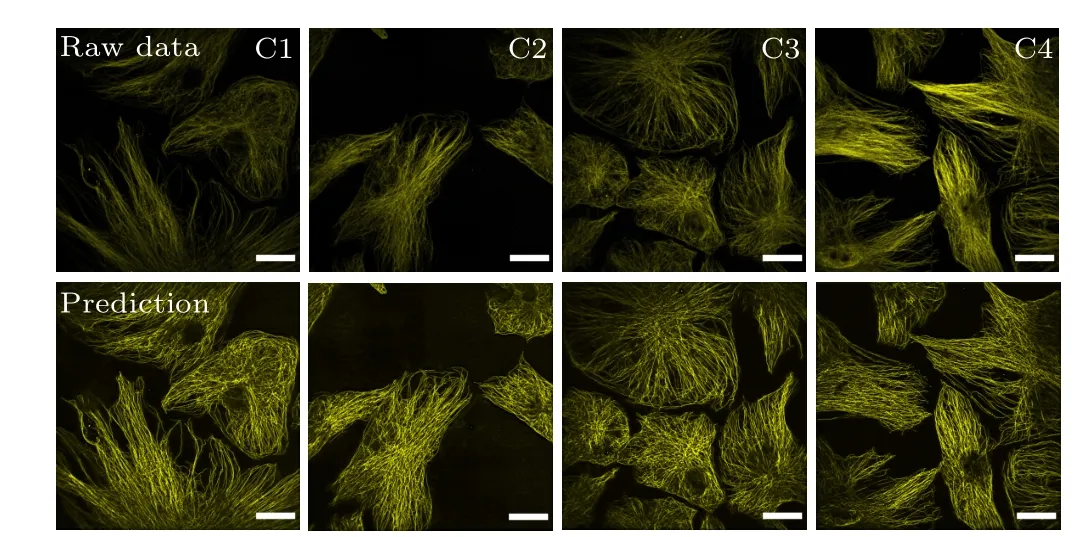
Fig.6. FCEDN enhanced cross-modality image SNR from ISM to confocal imaging. Input confocal microtubules images of HRPE cells with different imaging conditions C1-C4(top row)and the FCEDN reconstructed images(bottom row). Scale bars=20µm.
4. Conclusion
FCEDN was established based on deep learning.Training datasets were from super-resolution ISM.In this work,microtubules and cargo structures of fixed cells were collected as a training dataset. A wide field of view, fast super-resolution continuous imaging model was built. The SNR was improved from 3.94 to 22.81.The method was further applied to conventional spinning disk confocal microscopy and image qualities were significantly improved. This verified the generalized application of FCEDN.For other cellular organs and structures,the FCEDN method can be utilized with corresponding GT and training sets. In this work, a training set was collected using fixed cells since the targeted structure remained stable upon fixation. For those cell structures that could be damaged and cause artifacts during cell fixation,for instance mitochondria,imaging with live cells is necessary.Since model training can be influenced by intraocular and extraocular movements of living cells,GT and training images can be collected with uneven image intensity split dual-camera imaging. One camera collects strong signals as GT and the other collects weak signals as training sets. Then FCEDN method also can be used for living cells in motion.
Acknowledgments
Project supported by the China Postdoctoral Science Foundation,the National Key Research and Development Program of China for Y.S. (Grant No. 2017YFA0505300), and the National Science Foundation of China for Y.S. (Grant No.21825401). The authors thank the Olympus engineer Mrs Shaoling Qi for assistance with the microscopy,Professor Wei Guo (University of Pennsylvania) for providing the human retinal pigment epithelium cells and Professor Xiaowei Chen(School of Future Technology,Peking University)for providing the Media-Golgi marker. Thanks to the High-performance Computing Platform of Peking University for providing computing resources and platforms.
- Chinese Physics B的其它文章
- Quantum walk search algorithm for multi-objective searching with iteration auto-controlling on hypercube
- Protecting geometric quantum discord via partially collapsing measurements of two qubits in multiple bosonic reservoirs
- Manipulating vortices in F =2 Bose-Einstein condensates through magnetic field and spin-orbit coupling
- Beating standard quantum limit via two-axis magnetic susceptibility measurement
- Neural-mechanism-driven image block encryption algorithm incorporating a hyperchaotic system and cloud model
- Anti-function solution of uniaxial anisotropic Stoner-Wohlfarth model