
Characteristics of vapor based on complex networks in China
2022-04-12 03:45AiXiaFeng冯爱霞QiGuangWang王启光ShiXuanZhang张世轩TakeshiEnomoto榎本刚ZhiQiangGong龚志强YingYingHu胡莹莹andGuoLinFeng封国林
Chinese Physics B 2022年4期
关键词:志强
Ai-Xia Feng(冯爱霞) Qi-Guang Wang(王启光) Shi-Xuan Zhang(张世轩) Takeshi Enomoto(榎本刚)Zhi-Qiang Gong(龚志强) Ying-Ying Hu(胡莹莹) and Guo-Lin Feng(封国林)
1Data Service Office,National Meteorological Information Center CMA,Beijing 100081,China
2China Meteorological Administration Training Center,China Meteorological Administration,Beijing 100081,China
3Pacific Northwest National Laboratory,Richland WA 99352,USA
4Disaster Prevention Research Institute,Kyoto University,Uji,Kyoto 611-0011,Japan
5Laboratory for Climate Studies,National Climate Center CMA,Beijing 100081,China
6Chinese Academy of Meteorological Sciences,Beijing 100081,China
Keywords: precipitable water vapor,complex networks,transfer entropy,nonlinear
1. Introduction
Although the water vapor content is one of the minor constituents in the Earth’s atmosphere, it plays a vital role in the atmosphere’s chemical and physical processes.[1]The latent heat produced by the vapor phase changes can significantly alter the stratification stability of the atmosphere and affect the evolution of strong convection. Water vapor not only affects the vertical structure of the atmosphere,but it is also responsible for the formation of complex meteorological processes in the troposphere,which promotes the occurrence and development of weather systems at various scales. Water vapor also affects the long-wave radiation and absorption in the atmosphere,and has an indispensable role in influencing the radiation budget of the earth-atmosphere system and the processes of global climate changes. Therefore,the water vapor content observations must be effectively used to understand and predict the weather and climate systems.
Radiosonde is the most widely used traditional method to detect and quantify the water vapor in the atmosphere. However,the utility of this method is hampered by its high cost and insufficient spatiotemporal resolution. In China,there are only 120 radiosonde stations that operate at 00 and 12 UTC in the mainland of China. Ground-based global positioning system is a powerful tool for measuring water vapor because of its high accuracy,temporal resolution,longterm stability,and allweather operations,such as global navigation satellite systems(GNSSs), the Beidou navigation satellite system (BDS) and GLONASS,a Russian satellite system.[3]The national GNSS network includes the crustal movement observation network and the China meteorological administration GNSS Network,which have over 1000 stations that retrieve the water vapor data on an hourly basis.
In recent decades, complex networks have emerged as effective frameworks used to study complex systems, reveal their dynamic structure, and provide new insights for understanding these systems. Therefore,they have been widely applied in biology, ecology, sociology, and other domains.[4-6]In meteorology,experts have used complex networks to reveal the mechanisms of global and regional climate changes and climate dynamics.[7-20]By using the complex networks, airsea interactions,and especially the impacts of El Ni˜no and La Ni˜na, have also been explored.[21-24]Complex network tools can also be used for the detection and identification of extreme weather and climate events.[25-27]However, studies on vapor topology are limited.
Information transfer between subsystems or components of a dynamic system has been the focus of studies for decades.[28-30]Transfer entropy is equivalent to the conditional mutual information defined in the same set up,[31]and it can be used to detect the directed exchange of information between subsystems or components of a dynamic system.Therefore, it provides an effective approach to measure the nonlinear interactions between subsystems. Herein,we will use this quantity to describe the connections or links in the directed complex networks.
To explore the topological structures and collective behaviors of the undirected and directed water vapor networks,we will use hourly precipitable water vapor data from the national GNSS network in the mainland of China and a complex network framework with Pearson correlation coefficients and transfer entropy. We will use undirected vapor networks to help us understand the linear correlations among different vapor observational stations and determine their specific role in the vapor network. We will use the directed vapor networks to help us understand the information transfer among vapor stations and the asymmetry of these transmissions. With this knowledge, the best strategy for vapor observational network design can be formulated and the parameters used for precipitation studies and forecasting can be simplified. The remainder of this paper is organized as follows: The detailed data are given in Section 2. In Section 3, Pearson correlation coefficients, transfer entropy, and metrics of complex networks are introduced. The undirected and directed vapor networks are described and their properties are presented in Section 4.Finally,conclusions and discussion are provided in Section 5.
2. Data
The hourly precipitable water vapor data used in this study were retrieved from the national GNSS network of the mainland of China, which is composed of the crustal movement observation network of China and the China meteorological administration GNSS network. The data were collected during the period from December 2012 to March 2018. However, we noted large amounts of missing data due to the failure of original GNSS signals and the inability to access the corresponding elements to retrieve the vapor data. Therefore,we selected the stations for which there were more than 2000 hours of records. A total of 872 stations met this requirement and were thus chosen to be further studied and analyzed.Their location and data intervals are shown in Fig. 1. The stations are dense in east China and Jilin province in northeast China but sparse in west and central China. For most stations, their record lengths are between 12960 hours and 17280 hours. Table 1, which summarizes the records status of the vapor stations, provides the exact information. A total of 467 stations(53.4%)fell into this data length interval,which was more than half of the stations. The other four length intervals(described in Table 1)all accounted each for around 10%of the total.
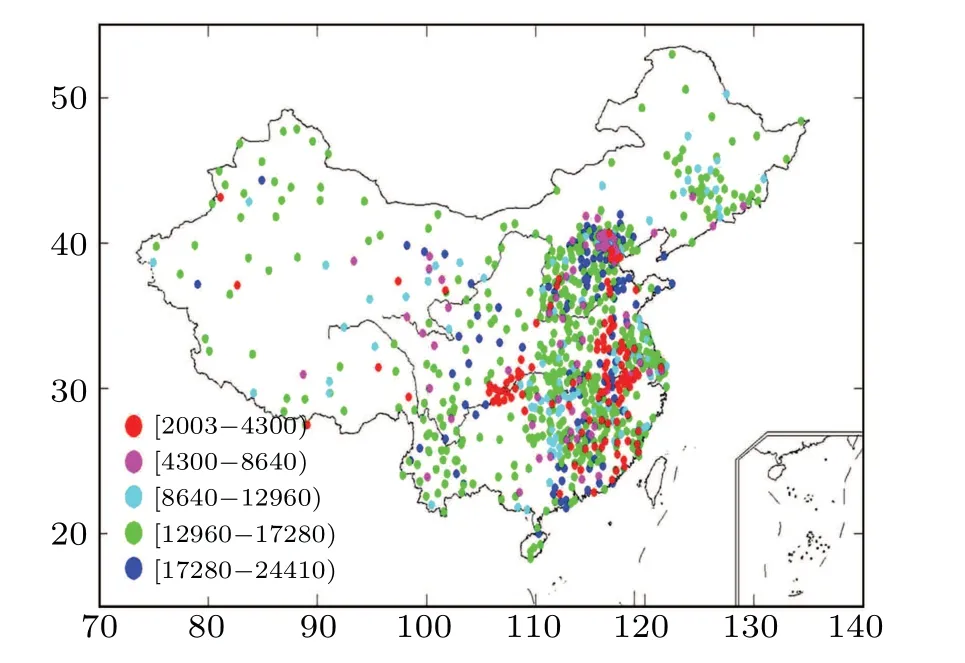
Fig.1. The geographical distribution of the PWV stations with a record length greater than 2000 h. The red, pink, light blue, green, and dark blue dots indicate a PWV station record length of between 2003 h and 4300 h,4300 h and 8640 h,8640 and 12960 h,12960 and 17280 h,and 17280 and 24410 h,respectively.

Table 1. Information of the PWV records.
3. Methods
To explore the relationships of China mainland’s PWV data amongst the stations and the collective topological statistical mechanics of the vapor network, we used Pearson’s correlation coefficient,transfer entropy,and measurements of complex networks such as degree and cluster. The methods and vapor network metrics are described below.
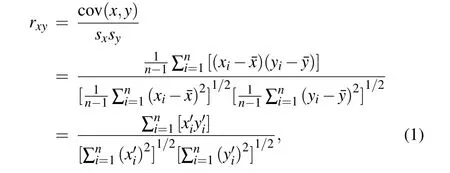
3.1. Pearson’s correlation coefficient
Pearson’s correlation coefficient is often used to measure the association between two variables.[32]It is the ratio of the sample covariance of the two variables to the product of the two standard deviations:
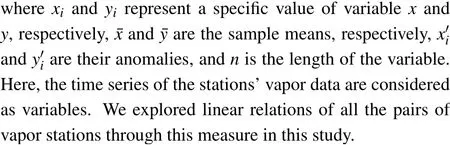
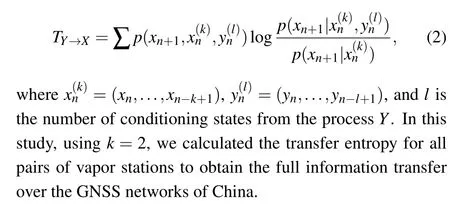
3.2. Transfer entropy
To measure the information exchanged amongst the vapor stations of the national GNSS network of the mainland of China,we introduced transfer entropy. Transfer entropy quantifies the information exchange between two variables, separately for both direction and for common input signals. Consider a vapor time series that can be described by a stationary Markov process of orderk, that is, the conditional probability in statexn+1at timen+1 is independent of the statexn-k:p(xn+1|xn,...,xn-k+1) =p(xn+1|xn,...,xn-k+1,xn-k).The transfer entropy measurement of information transportation from the variableYto the variableXcan be defined as
3.3. Complex networks
Complex networks are often used to formulate the dynamics of systems in nature and society. In this paper, we introduced its basic notations and metrics that describe the topological characteristics of the mainland of China’s GNSS vapor network. A vapor network is represented by a graphGin the mathematical language of graph theory, and the stations are the basic interaction units called the nodes of the network. The setPofNnodes(i.e.,stations)can be described byp1,p2,...,pN. Edges (sets of linksEthat connect two nodes inPexist among the nodes if their Pearson correlation coefficients are greater than 0.55,which indicates that their linear correlation or their transfer entropy is nonzero, representing their nonlinear coupling. An edge between two nodes with indexesuandvseparately,in the network can be represented by an entryeuvof a matrix.The value ofeuvis equal to 1 ifrxuyvis greater than 0.55 orTY→XorTX→Yis nonzero;otherwise,the value is equal to 0 ifrxuyvis less than 0.55 orTY→XorTX→Yequals zero.
To understand the topological structure and collective behavior of the vapor networks,we used typical metrics to estimate the properties of the vapor networks. These metrics are defined below.
3.3.1. Degree
The degree of a nodevindicates the number of edges to which it is linked. In the undirected vapor network, the Pearson correlation coefficient demonstrates the linear correlation between two vapor stations, and the linear relationship is mutual for them. The connection matrix of vapor stations is symmetrical and the edge between two vapor stations has no direction. For directed vapor networks,the transfer entropy measures the information transmission from one vapor station to another. Generally,the transfer entropy of one vapor station to another is not equal that in the opposite direction. Thus,the connection matrix is asymmetrical and the edge between two vapor stations has direction. For the undirected vapor networks,the formula for calculating the centrality degree of the nodes is
3.3.2. Clustering
Cluster quantifies the probability that the neighbors of a nodevare linked by pairs. The clustering coefficient is often used to measure this probability and is defined as the ratio between the number of edgesEvthat actually exist between thesekvnodes and the maximum edges among these nodes
kv(kv-1)/2:
The whole network clustering coefficient is the average of all individualCvvalues.
3.3.3. Betweenness
The betweenness of a nodevis defined as the number of the shortest paths between other nodes that run throughv.The betweenness of the network is the average of the node betweenness over the network node set.
3.3.4. Distance
The distanceduvbetween two nodes is the shortest edge from nodeuto nodev. The average distance of a network is the average distance amongst all the node pairs:
4. The vapor networks and their properties
In order to fully understand the linear and nonlinear interactions between different components of the vapor networks,we constructed two kinds of vapor networks,an undirected vapor network and a directed vapor network, in which the connections were quantified by Pearson’s correlation coefficient and transfer entropy.In the undirected vapor network,we used Pearson’s correlation coefficient to demonstrate the linear correlation between two vapor stations,and the linear relationship is mutual for them. Therefore,the connection matrix of vapor stations is symmetrical and the edge between two vapor stations has no direction, hence it is called an undirected vapor network. For the directed vapor network,the transfer entropy was used to measure the information transmission from one vapor station to another;and generally,the transfer entropy of vapor stationuto stationvis not equal to that ofvtou. Thus,the connection matrix is asymmetrical and the edge between two vapor stations has direction, hence it is called a directed vapor network. In the following,we explore the two kinds of vapor networks.
4.1. Distribution of Pearson’s correlation coefficient and transfer entropy
For the undirected vapor network,the entries of the connection matrix are the Pearson’s correlation coefficient between each pair of vapor time series, and the values of those entries are zero when their Pearson correlation coefficients are less than 0.55. The matrix is symmetrical. A total of 73258 entries had non zero values. Their statistical and geographical distributions are shown in Table 2 and Fig.2.

Table 2. Distribution of Pearson correlation coefficients for connected links.

Fig.2. Geographical distribution of the Pearson correlation coefficients of stations with a confidence level up to 99.9%.
The most strongly correlated station pairs account for 29.2%of the network of stations,with Pearson correlation coefficients ranging between 0.6 and 0.7.These stations are scattered throughout all of China. The smallest ratio of the pairs is 6.3%, which is negatively correlated to each other. These stations are mainly located in eastern China,but a few of them are located near the China’s border. Then the second largest proportion is pairs of stations with Pearson correlation coefficients between 0.8 and 1, accounting for 27.0% of all of stations. They are mainly located in eastern China, with a few stations located near the western border.
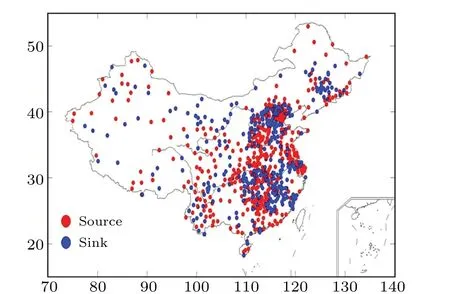
Fig.3. Geographical distribution of vapor information source and sink stations in China.
For the directed vapor network,the entries of the connection matrix are the transfer entropy between each two vapor time series,and the matrix is asymmetrical. A total of 74047 pairs of stations showed nonlinear information transfer. These stations account for 12%of all the pairs in the network. Based on the properties of transfer entropy, when the amount of information transfer from stationuto stationvis equal to that from stationvto stationu,the information transfer is considered balance between these stations. When more information is transferred from stationuto stationvthan that from stationvto stationu, stationuis called the information source of stationv. When less information is transferred from stationuto stationvthan from stationvto stationu,stationuis called the information sink of stationv. We identified 23967 pairs with one station as the information source, 45115 pairs with one station as the information sink,and 4965 pairs in information balance,representing proportions of 32.4%,60.9%,and 6.7%, respectively. There are about two times more sink pairs than source pairs. From these pairs, we calculated the divergence of a station’s information transfer to other stations and the information received from other stations. If the divergence is greater than zero, the station is considered an information source; otherwise, the station is an information sink.The information source stations transfer more total information to other stations than other stations transfer to these stations,and the opposite applies for sink stations. We identified 405(51.7%)and 379(48.3%)stations as information sources and sinks, respectively. Comparing the pairs of information sinks and sources, we found that the information strength of the sources is much stronger than that of the sinks. We identified twice as many sink pairs as source pairs, but 26 more source stations than sink stations. The geographical distribution of the information source and sink stations is shown in Fig. 3. They surround each other, but between the middle reaches of the Yellow River and the Yangtze River, the information source stations are clustered.This finding was interesting. In general,the vapor source and sink stations accompany each other. However, we found clustered source stations in Jianghuai, which can be considered as a hub vapor data area that transfer information from south to north China. The stations located in north China can provide information on the changes in the local and regional vapor states.
4.2. Characteristics of undirected and directed vapor networks
To explore the collective topological characteristics of these vapor networks, we calculated their classical metrics such as degree, betweenness, cluster coefficient, and average distance. The results are shown in Table 3. The average degrees of undirected vapor network and directed vapor network were similar and had the values of 93.44 and 93.53, respectively.The average out-degree,with a value of 96.2,was larger than that of average in-degree,with a value of 90.85,indicating that a station’s connections to other stations accounted for slightly more than one-tenth of all the network stations. The averaged betweenness and distance for the directed vapor network were slightly greater than those of the undirected network. The smaller betweenness value indicated that the interactions of the vapor stations were mostly within short range,with fewer long-range interactions amongst the stations. The average cluster coefficient of the directed and undirected networks was the same(0.58),which indicated that slightly more than half of the station’s neighbors were connected with each other.
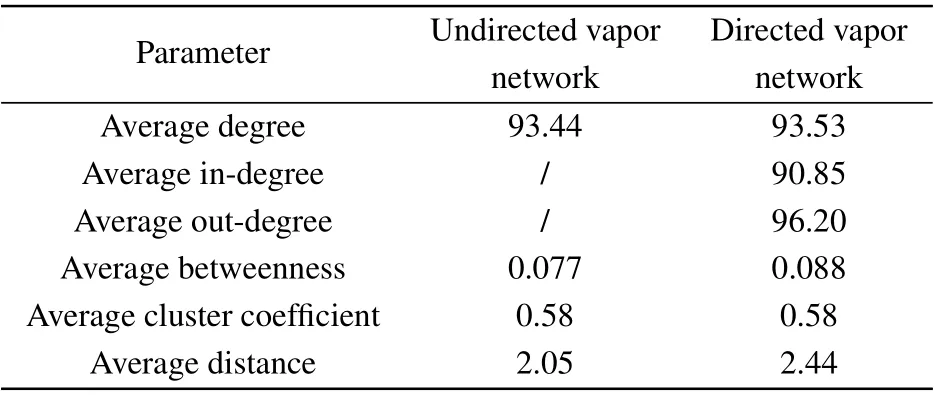
Table 3. Characteristics of the undirected and directed vapor networks.
The detailed statistical and geographical distributions of the undirected and directed vapor networks are shown in Table 4 and Figs. 4-6. The degree of statistical distribution of the undirected network was similar to that of the directed vapor network. The degree range of 100 to 200 ranked first for both networks, 50 to 100 ranked second, and third was the range of 1 to 50. The proportion of the stations with a degree value higher than 200 was small, and only accounted for just over 2%of the entire network.Only about 0.5%of the stations had a degree higher than 300.

Table 4. Distribution of degree centrality for undirected and directed vapor network.
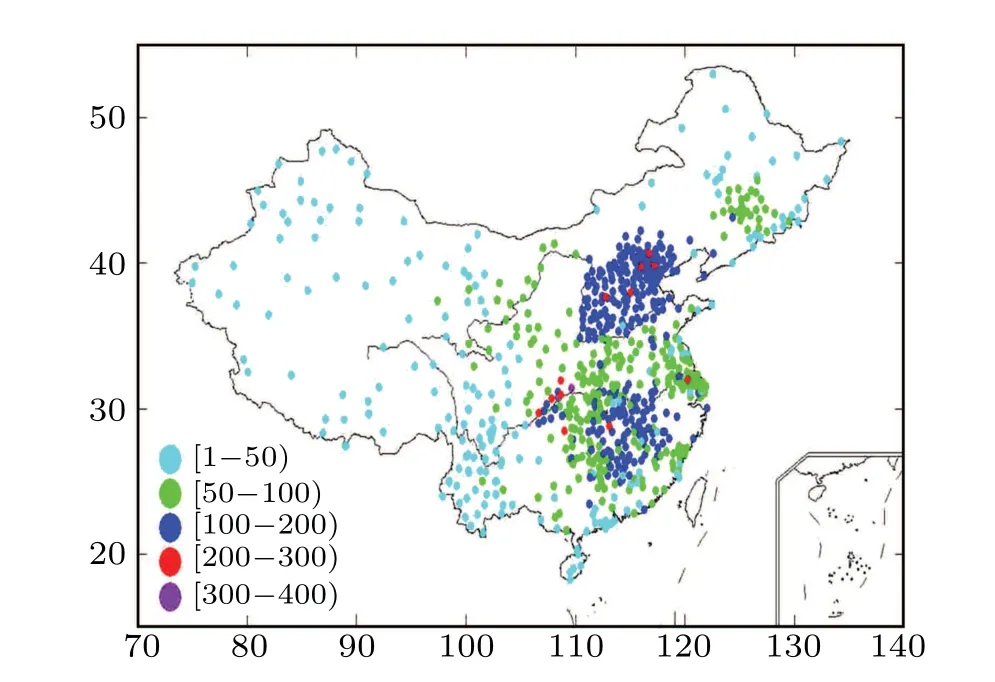
Fig.4. Geographical distribution of degree centrality of the undirected vapor network in China.
Most stations in the central and western China have a degree value of less than 50. This indicates that regardless of considering linear correlation or information transport,the stations in these regions interact less with those in other regions in China and play a smaller role in providing vapor transport and state data. Stations with a degree from 100 to 200 were clustered in the north of the middle and lower reaches of the Yellow River and the south of the middle and lower reaches of the Yangtze River. This was the most common mode for a specific vapor station to interact with other vapor stations,and these stations were clustered in eastern China and between the Yellow River and the Yangtze River. Stations with degree from 50 to 100 were scattered in eastern China especially between the Yellow River and the Yangtze River rivers,and south of the Yangtze River. Most stations with degree greater than 200 were located in the middle of the Yangtze River and north of the Yellow River. These stations played the most important role in vapor interactions with other stations, and could be considered as vapor transport hubs and superlink nodes in the vapor networks. Although these stations account for less than 3.0%of the total stations in the vapor networks,their role in the networks is of substantial importance,and therefore,we need to pay considerable attention to these stations when scientifically studying the vapor issues in China.
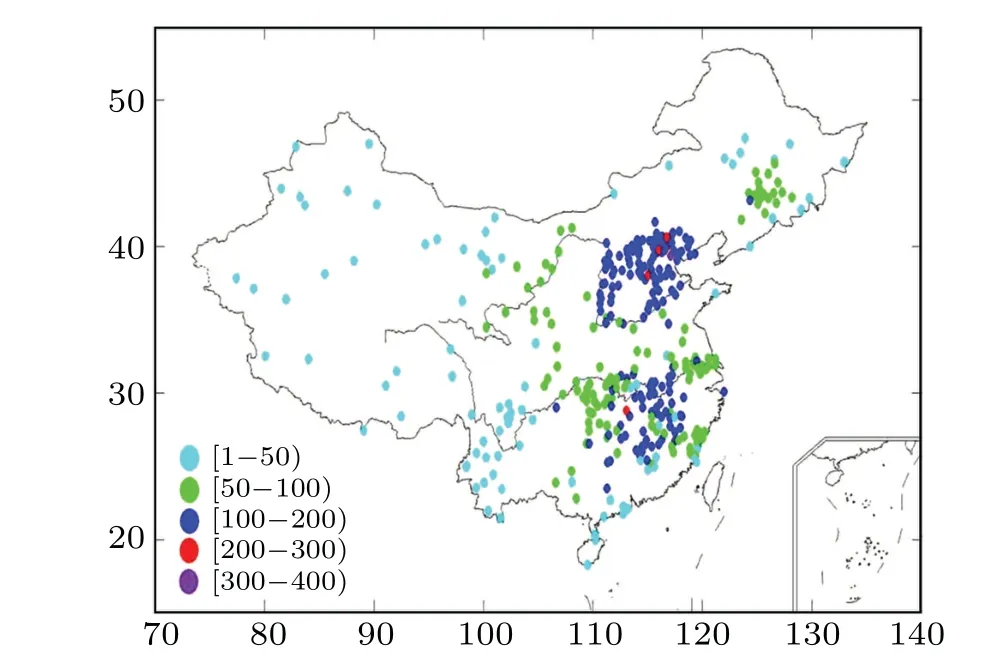
Fig. 5. Geographical distribution of the in-degree connections of the directed vapor network in China.
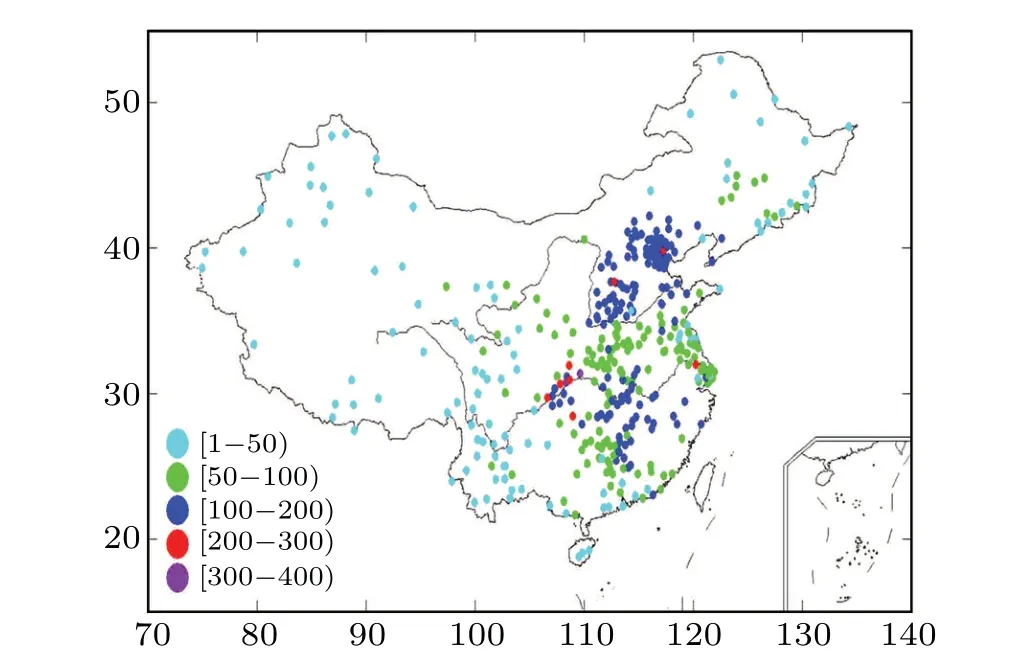
Fig. 6. Geographical distribution of the out-degree connections of the directed vapor network in China.
The statistics of betweenness were different for the undirected and directed vapor networks,as shown in Table 5.
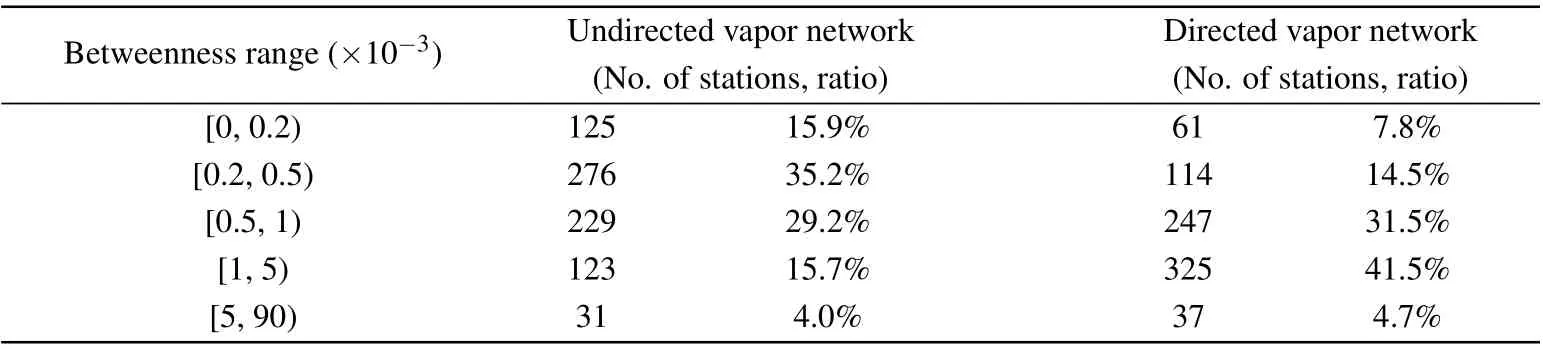
Table 5. Distribution of betweenness for the undirected and directed vapor networks.
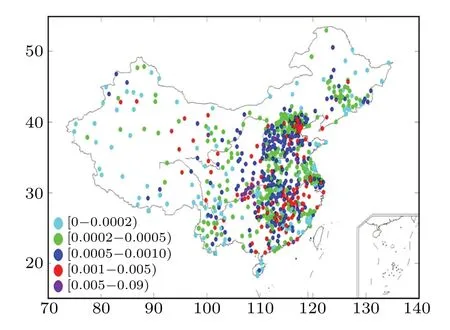
Fig.7. Geographical distribution of betweenness of the undirected vapor network in China.
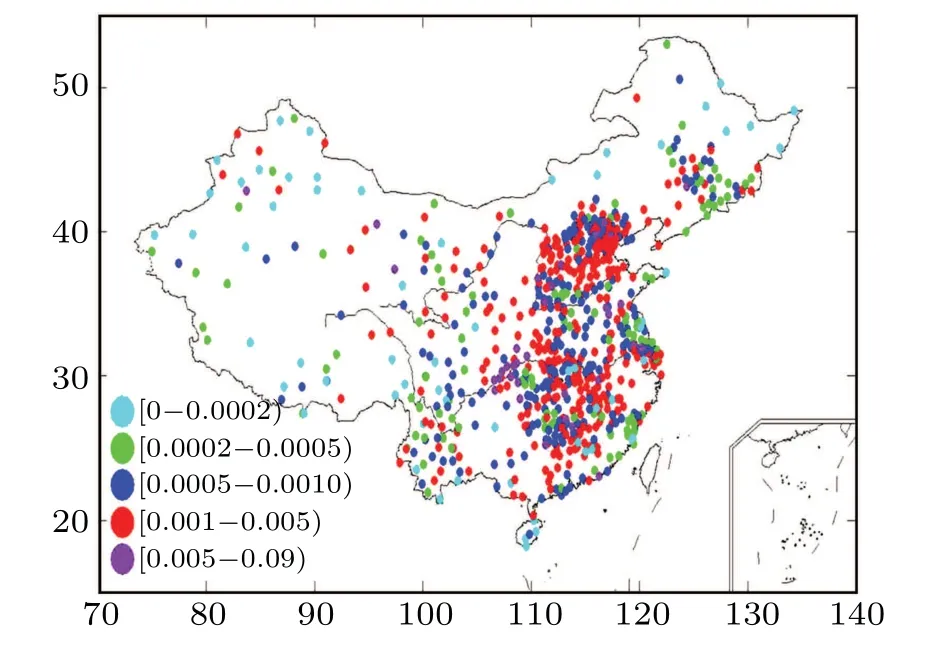
Fig.8. Geographical distribution of betweenness for the directed vapor network in China.
The largest ratio of betweenness for the undirected vapor network was 35.2% with values ranging between 0.0002 and 0.0005;the largest was 41.5%for the directed vapor network,with values ranging between 0.001 and 0.005. The stations with the largest betweenness value were mainly located in the middle of the Yangtze River for both networks, and the stations with the smallest betweenness value were mainly located in western China,as shown in Figs.7 and 8. This implies that stations in the middle of the Yangtze River play a greater role in vapor transfer than those in western China.
In order to understand the interactions between the neighboring vapor sites, we calculated the cluster coefficients and their distributions. As shown in Table 6, we found that the largest ratio of cluster coefficients was 32.4% with values ranging from 0.6 to 0.7. Then the second largest ratio was 21%, with values ranging from 0 to 0.5. The third largest ratio accounted for 21.0%,with values ranging from 0.5 to 0.6.The smallest ratio of cluster coefficients was 6.5%, with the largest cluster coefficient varying from 0.8 to 1.01. Most vapor sites in western China have cluster coefficients of less than 0.5, indicating that less than half of their neighbors interact with each other (Fig. 9). The stations with larger cluster coefficients, with values greater than 0.7, were clustered in the northern part of the middle and lower reaches of the Yellow River.Most stations with cluster coefficient values in the range from 0.5 to 0.7 were scattered in eastern China. This indicates that most of the vapor stations in eastern China interact with more than half of their neighbors,and the neighboring stations in eastern China are more inclined to interact with their neighbors.
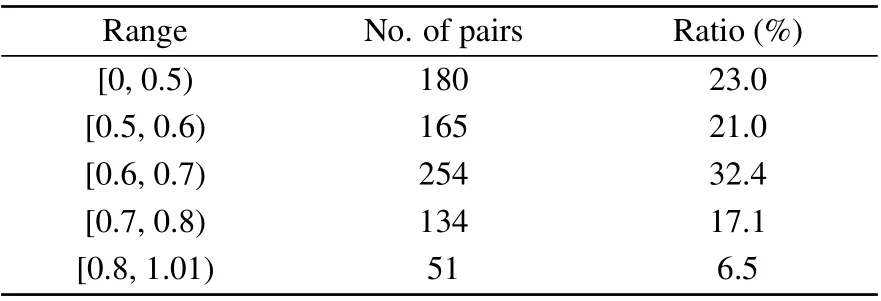
Table 6. Distribution of cluster coefficients in the vapor network.
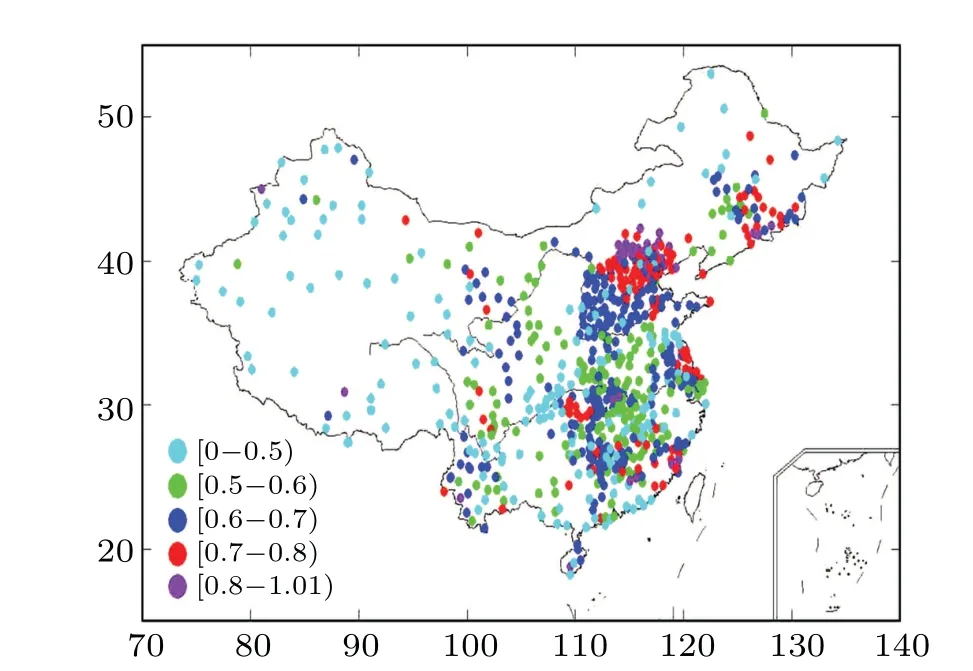
Fig.9.Geographical distribution of cluster coefficient of vapor network in China.
5. Discussion and conclusions
Our aim in this study was to understand the spatially uneven distribution of the features of vapor observation stations and find their internal connections to support the full use of the existing vapor records. The findings will aid in constructing the best strategies for future vapor observation network design and act as a reference for scientifically investigating vapor issues such as precipitation prediction. In this study,we applied complex network framework and designed both undirected and directed vapor networks to explore the vapor networks’ topological structures and their collective behaviors.Our conclusions are summarized as follows:
(1) For the undirected network, negative linear relationships exist amongst 6.3% of the vapor stations, though this value is small in comparison to all the station pairs whose Pearson correlation coefficients passed the 99% confidence level. These station pairs are scattered throughout the mainland of China. We identified positive linear relationships for the stations with large Pearson correlation coefficients,which are mainly located in eastern China, representing up to 27%of the stations. This indicates that the vapor stations in eastern China interact more closely with each other than those in the west.
(2)For the directed network,we found 23967 pairs of stations with one station as the information source, 45115 pairs with one station as the information sink,and 4965 pairs in information balance. There are almost twice as many sink pairs as source pairs; however, 405 and 379 stations were identified as information sources and sinks,representing 51.7%and 48.3%of the total,respectively. This implies that the information sources are much stronger than the information sinks. In terms of the geographical distribution,the source stations clustered between the middle reaches of the Yellow Riverand the Yangtze Riverrivers,representing hub stations for the transfer of information from south to north in China.
(3) The statistical and geographical degree and cluster distributions are similar for both the undirected and directed networks. For example, both degree ratios peak in the range of 100 to 200 for the two vapor networks, and these station locations are located in the same region. However,the statistical and geographical distribution of betweenness are different in the undirected and directed vapor networks. The ratio of stations with a larger betweenness is larger for the directed vapor network than for the undirected vapor network, implying the information transfer is more effective in the directed vapor network. The stations with the largest betweenness value are mainly located in the middle reaches of the Yangtze River for both networks, indicating the middle reaches of the Yangtze River play a greater role than western China in vapor transfer.
In this study,we focused on the statistical and geographical distribution of undirected and directed vapor networks.We identified the detailed linear correlation and nonlinear information transfer amongst different vapor stations. The vapor information sink and source stations were identified.We found the common mode of a vapor station interacting with other stations, and superlink vapor stations and their locations. Even the clustering properties and the transport efficiency of the vapor networks were explored. Our findings provide valuable information for vapor observation network design. For example,more observation stations should be constructed in the vapor transport hub areas; for precipitation forecasting, and the parameters for the stations having the same topological structure should be set to the same value to potentially simplify the prediction process. However, extensive research needs to be performed to fully understand the vapor networks’ properties and characteristics, such as their variations in different time scales or in different time periods. Under the background of climate change, vapor observations, reanalysis, and model simulations should be compared to obtain more information from the model. Due to the effectiveness of complex networks in describing complex system topological characteristics and collective dynamics behavior on the macroscale,they have already been applied in El Ni˜no-Southern Oscillation (ENSO)prediction, identifying extreme weather and climate events,and to the study of monsoons.In the future,complex networks may be combined with neural networks (on the microscale),which is a typical deep learning approach in the artificial intelligence domain to achieve more creative work in the atmospheric science.
Acknowledgements
Project supported by the National Natural Science Foundation of China(Grant Nos.41775081,41975100,41901016,and 41875100),the Innovation Project of the China Meteorological Administration (Grant No. CXFZ2021Z034), and the National Key Research and Development Program of China(Grant No.2018YFC1507702).
猜你喜欢
关东学刊(2022年5期)2022-10-21
汽车实用技术(2022年5期)2022-04-02
小学生学习指导(中年级)(2021年11期)2021-11-30
延河(下半月)(2021年7期)2021-08-10
保健与生活(2019年10期)2019-07-31
文物天地(2019年6期)2019-07-12
海峡姐妹(2019年4期)2019-06-18
支部建设(2016年6期)2016-04-12
中华奇石(2014年12期)2014-07-09

- Chinese Physics B的其它文章
- Quantum walk search algorithm for multi-objective searching with iteration auto-controlling on hypercube
- Protecting geometric quantum discord via partially collapsing measurements of two qubits in multiple bosonic reservoirs
- Manipulating vortices in F =2 Bose-Einstein condensates through magnetic field and spin-orbit coupling
- Beating standard quantum limit via two-axis magnetic susceptibility measurement
- Neural-mechanism-driven image block encryption algorithm incorporating a hyperchaotic system and cloud model
- Anti-function solution of uniaxial anisotropic Stoner-Wohlfarth model