
Non-invasive and low-artifact in vivo brain imaging by using a scanning acoustic-photoacoustic dual mode microscopy
2022-04-12 03:46WentianChen陈文天ChaoTao陶超ZizhongHu胡仔仲SongtaoYuan袁松涛QinghuaiLiu刘庆淮andXiaojunLiu刘晓峻
Chinese Physics B 2022年4期
关键词:松涛
Wentian Chen(陈文天) Chao Tao(陶超) Zizhong Hu(胡仔仲) Songtao Yuan(袁松涛)Qinghuai Liu(刘庆淮) and Xiaojun Liu(刘晓峻)
1Ministry-of-Education Key Laboratory of Modern Acoustics,Department of Physics,
Collaborative Innovation Center of Advanced Microstructures,Nanjing University,Nanjing 210093,China 2Department of Ophthalmology,The First Affiliated Hospital of Nanjing Medial University,Nanjing 210029,China
Keywords: photoacoustic microscopy,scanning acoustic microscopy,noninvasive,low-artifact,brain imaging
1. Introduction
Photoacoustic microscopy (PAM) is a potential brain imaging modality, benefitting from the advantages of rich functional information in biological tissue.[1-10]PAM is based on the photoacoustic (PA) effect. Short laser pulse illuminates the biological tissues. Laser energy absorption of optical absorbers causes thermal expansion and emission of the ultrasound waves,i.e.,PA waves. A spherically focused ultrasonic(US)transducer is implemented to detect the PA waves.One-dimensional (1D) image along the transducer axis can be formed according to the time-of-flight and intensity of the signals. A three-dimensional (3D) image can be obtained by point-by-point scanning the object along a two-dimensional plane. When the imaging depth exceeds the optical mean free path(~1 mm),the size of the acoustical focus is smaller than that of the optical focus. In this situation,the lateral resolution of PAM is determined by the acoustical focus. This imaging modality is known as an acoustic-resolution PAM(AR-PAM).AR-PAM breaks the limitation of optical diffusion and provides acoustic-resolution(a few tens to hundreds of micrometers)in deep tissue,which promises it a very wide range of applications,such as cancer detection,[11,12]in vivobrain imaging of small animals,[13-17]flow velocity monitoring,[18-20]and so on.[21-32]
However, AR-PAM still faces the challenges of imaging through inhomogeneous multilayered media. When imaging optical absorbers below several acoustically inhomogeneous layers,the acoustic impedance mismatch between these layers could cause multiple reflections of PA signals. The reflections form artifacts in the images. These artifacts are mixed with real images of the objects and make real information hard to be distinguished. Therefore,the existence of reflections induced by multilayered impedance mismatch is still an obstacle that significantly restricts the imaging performance of AR-PAM,especially in the field of noninvasivein vivobrain imaging of small animals since high acoustic impedance of skull, scalp,and so on.
Some methods have been reported to reduce the reflection artifacts induced by acoustic reflection layers.[33-37]By mimicking PA wave fields using an US wave, the artifacts of the optical absorbers above the one-layer-reflector are reduced in a PA tomography.[33,34]Convolutional neural network has also been trained to locate both sources and reflection artifacts, and suppress the artifacts in the PA channel data.[35]Multiple-wavelengths illumination is also utilized to identify and remove the reflection artifacts based on the correlation between the reflections and their corresponding original images.[36]Also, our previous work presented an US-guided PAM to reduce the reflection artifacts induced by a bone-like layer.[37]However, the problem of artifacts induced by multilayered media above the optical absorbers in PAM has not been well addressed. Multilayered scattering is still a significant factor that restricts the performance of brain imaging.
In this work, we propose a method called low-artifact PAM(LAPAM),which combines conventional AR-PAM with scanning acoustic microscopy (SAM) to suppress the reflection artifacts induced by multi-layers.First,we derive the general transfer function of PA waves and US echoes with the existence of multi-layers. The derived transfer function reveals the similar propagation scheme of PA waves and US echoes.Then,according to this finding,we propose a LAPAM theory based on the scanning acoustic-photoacoustic (SA-PA) dual mode microscopy. In this theory,the US signals can be treated as the transfer functions of the reflection scheme, and the PA signals can be finally deconvolved by the transfer functions to get the low-artifact results. In other words,the US signals can be implemented to guide the PA imaging and suppress the artifacts in the image. A phantom experiment is used to demonstrate the imaging process and validation of LAPAM.Finally,in vivobrain imaging experiment is employed to examine the practical applicability of LAPAM.
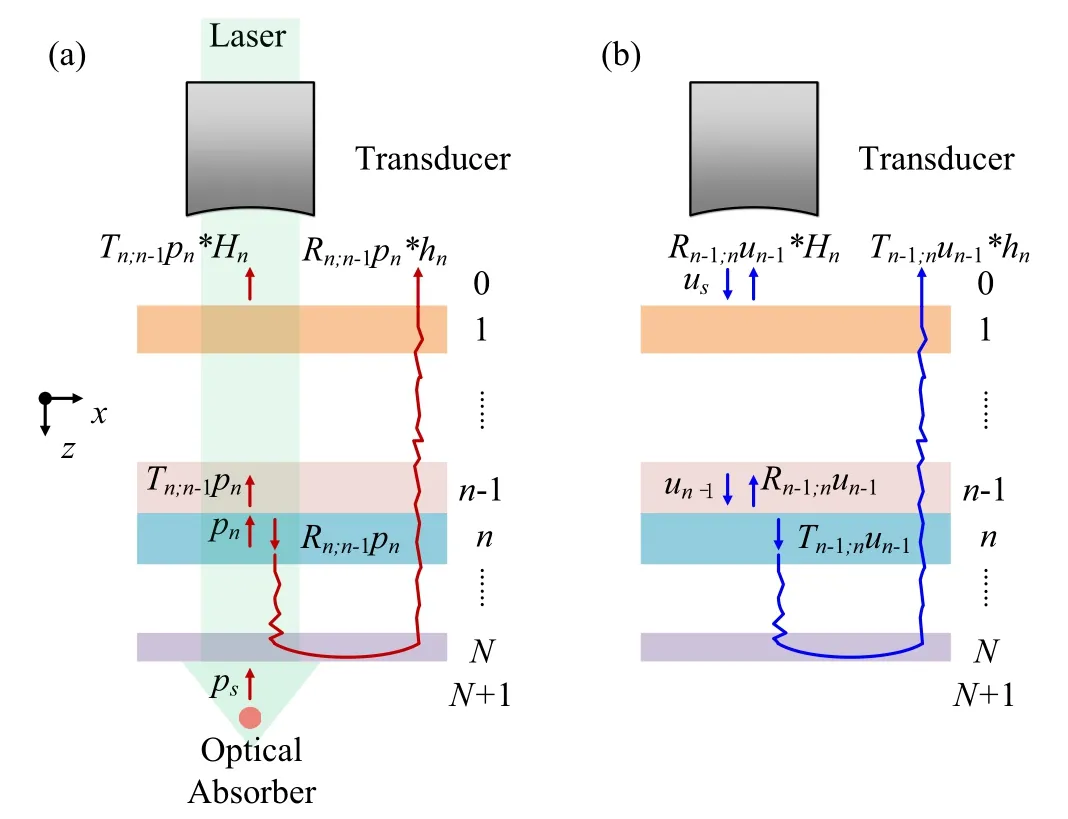
Fig. 1. Scheme of the proposed method considering N different reflection layers. Here,we mark the area below layer N as layer N+1,and area above layer 1 as layer 0. (a) The process of the PA excitation, propagation, and detection. Supposing that the strongest acoustic impedance mismatch occurs between the layers n-1 and n, we neglect the reflections induced by other interfaces. ps:the PA signal emitted from the optical absorber; pn:the incident wave from layer n to n-1;hn: the impulse response of multilayers when multilayered reflections act on the reflected wave of pn. Hn: the impulse response that performs on the transmitted wave of pn. (b)The model of the US emission, propagation and detection. us: the PA signal emitted from the transducer;un-1:the incident wave from layer n-1 to n. From the simplified scheme in(a)and(b), we can see that the PA signal and the US echo share similar propagation characteristics.
2. Methods
Let us compare the acoustic wave propagation characteristics in multilayered media withNdifferent layers, as shown in Fig. 1. Assuming the acoustic impedance of layern(n=0,1,2,...,N+1;here,we mark the area below layerNas layerN+1,and area above layer 1 as layer 0)isrn,when the acoustic wave propagates from layernto layern', the reflection coefficientRn;n'and transmission coefficientTn;n'can be given asRn;n'=(rn'-rn)/(rn'+rn)andTn;n'=2rn'/(rn'+rn)with|n-n'|=1 andn,n'=1,2,...,N,wherern'andrnrepresent the acoustic impedance of layersn'andn,respectively.The transducer emits US waves above the multilayered media and detects US echoes on the same side. The PA excitation is implemented on the optical absorbers below the acoustic reflection layers to generate PA signals. When the PA signals pass through the multilayered media,multi-reflections will occur and these signals mixed with the reflected waves are received by the upper transducer. Actually, the interface with strongest acoustic impedance mismatch plays the most important role in the appearance of reflections and artifacts. Based on this and without loss of generality,we give two fundamental assumptions before considering the PA/US propagations through multilayers:
Assumption (1): The reflections above the layern-1 is weak(|Ri;i-1|or|Ri-1;i|≪1 wheni=1,2,...,n-1),like the layers with weak reflections above the interface between the scalp and the skull.
Assumption (2): We suppose that the strongest acoustic impedance mismatch occurs between the layersn-1 andn.And only the strongest reflection and artifacts related to their interface are considered here.
Based on the two assumptions above, we first consider the PA signal passing through the inhomogeneous layers, as shown in Fig. 1(a).ps(t) is the PA signal emitted from an optical absorber below the inhomogeneous layer. Andp(t)is the signal detected by a US transducer above the inhomogeneous layer. Letpn(t) be the incident wave from layernton-1. Since the PA waveps(t) has passed through all interface below layern,it has the relationshippn(t)=anps(t)withan=ΠNi=nTi+1;i. Finally, its reflected wave passes through a complex path and also arrives at the US transducer. Write the impulse path of this complex propagation path ashn(t),a series of reflected wave components originating from the reflected wave ofpn(t) (i.e.,Rn;n-1pn(t)) can be treated as the convolution betweenRn;n-1pn(t) and the response of a linear system,that is,Rn;n-1pn(t)∗hn(t). Here“∗”refers to the convolution operation. Also, the transmitted wave ofpn(t)(i.e.,Tn;n-1pn(t))passes through the pathHn(t). The detected PA signalp(t)can be written asp(t)=Tn;n-1pn(t)∗Hn(t)+Rn;n-1pn(t)∗hn(t). According to the two assumptions above,the high-order reflections inHn(t)can be ignored. Therefore,we have


Comparing Eqs. (2) and (5), it can be noticed that the US pulseun-1(t) passes through the same path as PA impulsepn(t) in the proposed model. Therefore, the US echo could be implemented to estimate the transfer function of PA signals. Using the estimated transfer function, the reflected waves can be removed,and the original PA signalps(t)could be recovered from the detected signalp(t). This is the basic idea of LAPAM.LAPAM combines conventional AR-PAM and SAM.And its detailed image strategy can be implemented as the following steps:
Step 1 Estimate the impulse response of the PA signal reflections from the US echou(t). Rewriting Eq. (2), we havep(t)=ps(t)*hpa(t)withhpa(t)∝a'nδ(t)+Rn;n-1hn(t). Similarly, rewriting Eq. (5), we haveu(t) =us(t)∗hus(t) withhus(t)∝Ca'nδ(t)+Rn;n-1hn(t). It can be found that their coefficients of each corresponding terms in the transfer functionhus(t)andhpa(t)are the same,except of the first term. Modifying the strongest peak in the detected US signalu(t)by multiplying a correction factor (1/C), we can obtain a reference signalU(t)as

where Hilbert[•]refers to the Hilbert transform operator. The maximum of the modulus of the Hilbert transform is used here to get the peak of the signal envelope. AndRais the axial resolution of the US transducer andcis the speed of sound in tissue. Thus,U(t)∝us(t)∗hpa(t).
While in the spectral domain, the relationship betweenU(t)andus(t)can be rewritten asF(U)=F(us)F(hpa),whereF[•]represents the Fourier transform operator. Then, the impulse response of the multilayershpain the spectral domain can be obtained by whereW(ω) is a windowing function to prevent the amplification of frequencies outside the transducer response. Such windowing function is the frequency spectrum of transducer impulse response,which has a central frequency of~15 MHz and a relative bandwidth of 60%at-6 dB.
Step 2 Apply the deconvolution betweenp(t)andhpato suppress the components of the multiple reflections in the PA signal as
whereF-1[•] represents the inverse Fourier transform, andP(t)∝ps(t)is the low-artifact result.
Step 3 AnA-line image at this scanning position can be obtained byA(x,y;z)=P(z)withz=ct,wherecis the speed of sound in tissue.
Step 4 For each position in the scanning plane(x,y),the above steps are repeated to achieve three-dimensional PA imagesA(x,y,z). The LAPAM imageA(x,y,z) describes the distribution of the optical absorbers.
3. Experimental systems
Figure 2(a) shows the schematic diagram of the experimental setup. Laser pulse (wavelength: 532 nm, repetition rate: 10 kHz, pulse duration:~8 ns) was emitted from a neodymium-doped yttrium aluminum garnet(Nd: YAG)laser(Spectra-Physics, EXPL-532-2Y). The energy of each laser pulse is~100 µJ and the laser beam was coupled into an optical fiber bundle composed of 19 fibers via a convex lens.Exit ends of these fibers were mounted by a customized 3D printed fiber-transducer holder, as shown in Figs. 2(b) and 2(c). A focused US transducer was fixed in the center of the fiber-transducer holder. And exit ends of the optic fibers were mounted around the transducer evenly along a circle.The angle between each fiber and the horizontal plane is 50°.So that, exit beams were converged at the acoustic focus to ensure the optimal sensitivity of PA signal generation and detection. Since the diameter of the light spot illuminated on the sample surface is about~4 mm, the optical fluence is about~0.80 mJ/cm2, less than the American National Standards Institute (ANSI) safety limit for 400-700 nm (20 mJ/cm2).

Fig. 2. The experimental setup. (a) The schematic diagram of the dual-mode microscope system. DAQ card, data acquisition card; BS, beam splitter; PD,photodiode; CL,convex lens; WT,water tank; UT,ultrasonic transducer; FB,fiber bundle. The part in the dotted frame is the fibertransducer holder. (b)The photograph of the fiber-transducer holder. (c)The arrangement of optic fibers and US transducer in the fiber-transducer holder. The angle between each fiber and the horizontal plane θ is 50°. The exit beams are converged at the acoustic focus to ensure the optimal sensitivity of PA signal generation and detection.
The same US transducer was also used to generate US pulse and detect US echoes. In our experiment,the spherical transducer (Olympus NDT, V319-SU-F) with a central frequency of 15 MHz, a focal length of 19 mm, and a relative bandwidth of 60% at-6 dB was used to emit US pulses and detect PA signals/US echoes. When detecting PA/US signals,the US transducer and the ends of the fiber were immersed into the water tank to ensure good acoustic coupling. The bottom of the water tank was sealed with a polydimethylsiloxane(PDMS)layer for waterproofing and good light transmission. An electrical impulse produced by the pulse generator(Goworld,CTS-8077PR)was applied on the transducer to emit US pulse. The detected PA/US signals were amplified by a low-noise amplifier with a gain of~46 dB and digitized by a data acquisition card(National Instruments, NI-5761)at a sampling frequency of 250 MHz. A photodiode (Thorlabs,PDA10AEC) was used to monitor the intensity of the laser pulse. Its output was also used as a time reference to trigger the data acquisition card and control the pulse generator. A two-dimensional motorized translational stage (Zolix Instruments,KSA050-11-X,PSA050-11-X)was driven by the motion controller(Zolix Instruments,MC600)to perform thex-yplane scanning. Figure 3 describes the time sequence of the laser emission,PA signal detection,US emission and US echo detection. Each period of PA/US emission and detection was triggered by the laser emission. 12 µs after laser emission,PA signal was recorded for a duration of 4 µs. Then, 20 µs after laser emission, US emission was emitted. US echo was recorded 24µs after US emission(48µs after laser emission).The duration of the recorded US echo is 8µs. Repeating the above process,the system achieved three-dimensional PA and US image,simultaneously.

Fig.3.Time sequence of the laser emission(trigger),PA detection,US emission and US echo detection. Each period of PA/US emission and detection starts from the laser emission.
4. Phantom experiment
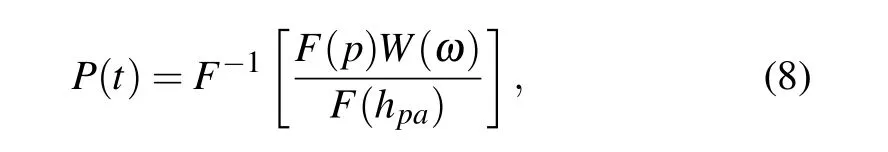
The performance of the SA-PA dual mode microscopy was firstly examined by imaging five tungsten wires with a diameter of~100 µm. Figures 4(a) and 4(b) give the maximum amplitude projection (MAP) images of samples. Both AR-PAM image and SAM image can present the five tungsten wires clearly. Figure 4(c)gives the 1D normalized crosssectional profiles of a tungsten wire, along the white dashed lines on(a)and(b). Red empty dots and black empty squares in Fig.4(c)correspond to the PA image and US image,respectively. And their Gaussian fittings are given by the red solid line and black dashed line. The full widths at half maximum(FWHMs)of the tungsten wire images are about 288±16µm and 266±13µm for PAM and SAM,respectively.As the matter of fact, the image of an object is the result of convolution between the real shape of the object and the point spread function of the imaging system. The lateral resolution of the system can be estimated by extracting the real size of the object from the FWHM.[38]Since the tungsten wire is not perpendicular to thex-axis,the actual size of the object in the 1D profile marked by the white dashed line should be equal to (real diameter/cosα),whereαis the angle between the normal direction of the tungsten wire and thex-axis(αis an acute angle).Here,since cosα=0.97 and the real diameter of the tungsten wire is~100µm, the actual size=100µm/0.97=103µm.As a matter of fact, the lateral resolution of the system can be estimated by extracting the actual size of the object from the FWHM.Based on this,the lateral resolutions of PAM and SAM are estimated to be about 185 µm and 163 µm, which are closed to their theoretical values 183µm and 150µm.[39]From the result we can see that this test can successfully justify the effectiveness of the AR-PAM and SAM imaging modes.
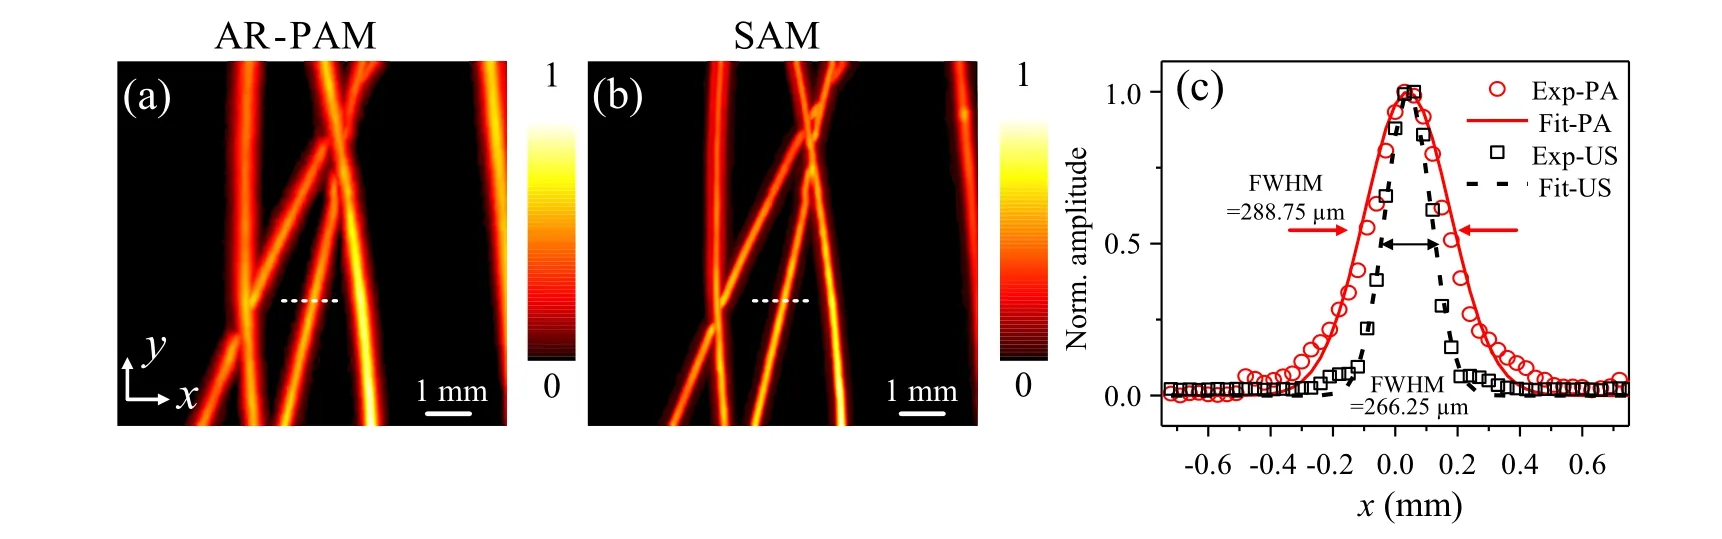
Fig.4. The test of the dual-mode microscope by imaging tungsten wires. (a)The MAP image of the conventional AR-PAM.(b)The MAP of the SAM image. (c)The normalized 1D cross-sectional profiles of a tungsten wire, as indicated by the white dashed lines in(a)and(b). Red empty circle dots and black empty square dots indicate the 1D PA profile and US profile. Their Gaussian fittings are given by red solid line and black dashed line,respectively.
A phantom experiment was used to examine the ability of our proposed method for removing reflection artifacts induced by a multilayered cover. The phantom is made of six randomly arranged tungsten wires, which act as optical absorbers, something like the brain vessels below the scalp and the skull. A multilayered cover is fixed above the phantom. The cover consists of three reflection layers, which from top to bottom are PDMS layer,acrylic layer,and PDMS layer, respectively. Here, the top PDMS film layer has a thickness of~0.5 mm, with acoustic impedance of about 1.08×10⁶kg/(m2·s).[40]The middle layer is made of acrylic with a thickness of about 0.5 mm that is closed to the thickness of the skull of small animals. The acoustic impedance of the middle film is 3.24×10⁶kg/(m2·s),[37]which is closed to that of the skull of small animals,but much higher than that of the surrounding water. The bottom layer is also made of PDMS and has a thickness of about 0.2 mm. In short, the cover has much higher acoustic impedance than the surrounding water,and its three layers have quite different acoustic impedances.Therefore, the cover induces complex and strong acoustic reflections,as well as the scalp,and the skull.
Figure 5 gives the typical waveforms obtained by conventional SAM, conventional AR-PAM, and LAPAM. Synthetic aperture focusing technique (SAFT) is used here to improve the image resolution and signal-to-noise ratio in out-of-focus regions, and consequently broadens the depth-of-field of the image. The black line in Fig.5(a)shows a US echo waveformu(t) obtained by SAM. The detected US echo has many reflected waves due to the impedance mismatch. The four highest peaks correspond to four interfaces between the three cover layers and the surrounding water, as pointed out by black arrows. Then, considering that the second peak in US echo has the strongest amplitude among the reflection peaks, the reference signalU(t) [blue line in Fig. 5(a)] can be derived from the simplified detected US echou(t) by modifying the second peak ofu(t) by correction factor 1/C=-3.02 as
Fig. 5. The process of removing the reflected artifacts caused by three different reflecting layers in a typical A-line. (a) Comparison of typical waveform of the detected US echo u(t) (black curves) and reference signal U(t)(blue curves). The four peaks in u(t)correspond to four interfaces of the layers. Here, we multiply the second peak of u(t) with correction factor1/C=-3.02 to get U(t). (b)Typical waveform of the PA signal p(t)detected at the same position (red curves) and the reference signal U(t),where the artifacts reflected by interface between layer 2 and layer 3, and interface between layer 3 and layer 4 are pointed out by red arrows. The corresponding reflection waves in U(t)are marked by blue arrows. A:artifacts. R:reflections. (c)Typical low-artifact PA waveform P(t)obtained by the proposed method.
U(t)∝us(t)∗[(1/C)Ca'2δ(t)+R2;1h2(t)]=us(t)∗[a'2δ(t)+R2;1h2(t)],according to the acoustic impedance of acrylic film and PDMS. The red line in Fig. 5(b) gives the PA signalsp(t) detected at the same position as the US echou(t). Besides the first peak, which is directly transmitted from the tungsten wires to the transducer, the left two peaks (pointed out by red arrows) come from reflections in the multilayered cover. For comparison, the waveform ofU(t) is plotted in Fig. 5(b) again and the corresponding reflection waves inU(t) are marked by blue arrows. The similarity betweenp(t) andU(t) can be easily observed. Therefore,U(t) can be utilized to estimate the transfer function in the spectral domainF(hpa) =F-1[F(U)W(ω)/F(us)] to suppress multiple reflections in PA waves. Figure 5(c) gives the signalP(t) =F-1[F(p)W(ω)/F(hpa)] processed by our proposed method,where the reflected signals have been effectively suppressed.
Figure 6 gives the 3D rendering display of the phantom obtained by two-dimensional scanning along thex-yplane.The scanning range is 12 mm×12 mm and the scanning step is 30µm. The SAM image given in Fig.6(a)indicates the interface profiles of the multilayers. The conventional AR-PAM image is given in Fig.6(b). A mass of reflection
artifacts seriously degrade the quality of the image, and prevent the real information from being distinguished. The corresponding LA-PAM image obtained by the proposed method is shown in Fig. 6(c). We can see that the reflection artifacts have been effectively removed, while the real image of the optical absorbers in the phantom is kept.

Fig.6. The 3D rendering display of the phantom. (a)SAM image. (b)Conventional PAM.(c)LAPAM image. C1,C2,and C3 point out the positions of three slices in Fig.7.
In order to show the advantage of LAPAM more clearly,we comparex-ycross sectional slices at three different layers achieved by different methods in Fig.7. The top row[(a),(b)], the middle row [(c), (d)] and the bottom row [(e), (f)]correspond to the three different layers C1, C2, C3 indicated in Fig. 6. The distance between each layer is 0.6 mm. The three images at the left column[(a),(c),and(e)]are obtained by conventional AR-PAM,where many reflected artifacts are mixed with real images. Benefitting from our method, the quality of three images on the right column [(b), (d) and (f)]is strongly improved. The artifacts are suppressed and the real images are left. To conclude, the proposed method significantly suppresses the reflection artifacts and improves the image quality under the multilayered strong reflectors.

Fig. 7. Comparisons of the image obtained by conventional ARPAM and LAPAM at three different depths. The top [(a) and (b)], middle [(c) and(d)],and low[(e)and(f)]rows correspond to the layers of C1,C2,and C3 indicated in Fig.6. The left column[(a),(c)and(e)]illustrates the conventional AR-PAM images with many reflection artifacts, which are indicated by white arrows. The right column [(b), (d) and (f)] gives the images obtained by the proposed method,where the artifacts are removed.
5. In vivo brain imaging experiments
We applied the proposed scheme to image mouse brainin vivo. Male nude mouse(around six weeks old and weighting~20 g)was selected as the animal model forin vivoimaging experiments. The mouse was initially anesthetized by using the isoflurane gas with a concentration of 3%in an induction box. After that,the mouse was moved onto the animal holder and maintained general anesthesia by breathing isoflurane gas through an anesthetic mask and an animal anesthesia machine.The isoflurane gas had a concentration of 3% during the experiments. Before imaging, hairs on the scalp were removed by using an over-the-counter depilatory cream,and ultrasound gel was also applied on the scalp to ensure good ultrasound coupling. During the imaging process,both the scalp and the skull were kept. Therefore, the imaging modality was completely non-invasive and non-destructive.
The SA-PA dual mode microscopy was used to noninvasively scan the mouse brainin vivo. Figure 8 presents the dual modal images of the mouse brain. The scanning range is 7.5 mm×12 mm with a step size of 30 µm alongxandydirections. Figure 8(a) is the photoacoustic MAP image.Color encodes the depth in thezdirection. Since the highsensitivity optical absorption at 532 nm in the hemoglobin domain, vessels generate strong PA signals under the illumination of the laser with a wavelength of 532 nm. Therefore,ARPAM image clearly indicates the profile of the major vascular landmarks(sagittal sinus,coronal suture)under the scalp and the skull. However, it is hard to clearly image the structure of the cortex vessels by using a conventional optical camera[Fig.8(c)],because of the strong optical scattering. In order to further verify the AR-PAM image in Fig.8(a),we removed the scalp with the skull intact after imaging. Thein situanatomical photograph of the brain is shown in Fig.8(d). The major vascular landmarks in AR-PAM image [Fig. 8(a)] agree well with the photograph in Fig.8(d).
A SAM image was obtained by the microscope at the same time. In comparison to AR-PAM image,SAM image reveals different structural information. Since the serious acoustic impedance mismatch between the scalp,skull and the surrounding environment,strong US reflections occur at their interfaces. SAM implements US echoes to reconstruct the image,which indicates the distribution of the acoustic reflectors.Therefore,SAM image displays the skull clearly,as shown in Fig.8(b). The SA-PA dual mode microscopy obtains the distribution of optical absorption (blood vessels), as well as the structure of acoustic scatterers (skull and scalp), simultaneously.
However,the negative effects of acoustic reflection could be easily noticed if we observe the imaging results fromx-zandy-zcross-sections,as shown in Fig.9. The four columns from left to right shown in Fig. 9 correspond toy-zcrosssection B1,x-zcross-sections B2, B3, B4 pointed in Fig. 8,respectively. SAM images are displayed on the top row[Figs. 9(a), 9(d), 9(g), 9(j)]. Due to the acoustic impedance mismatch,the US echoes can reveal the profiles of the PDMS film layer (purple arrow), scalp (green arrow) and the skull(white arrow). Since the strongest reflection occurs on the interface between scalp and the skull, the MAP image of SAM[Fig. 8(b)] effectively manifests the structural information of the skull.
The middle row [Figs. 9(b), 9(e), 9(h), 9(k)] gives the original AR-PAM images before artifact suppression. The strongest PA signals are generated by vessels under the skull.PA waves of vessels propagate through skull, scalp, PDMS film layer,water in order,and finally reach the US transducer.Acoustic impedance mismatch between these layers induces multiple acoustic reflections, which form serious artifacts in the AR-PAM image. The red arrow,orange arrow,yellow arrow in Fig. 9(b) point out the reflected artifacts, which correspond to the artifacts indicated in Figs. 9(e) (red arrow),9(h) (orange arrow), 9(k) (yellow arrow), respectively. Also,the blue arrow in Fig.9(k)points out another position affected by artifacts. The real images are mixed with the artifacts and the PA imaging quality is badly degraded by acoustic reflections.

Fig.8. Noninvasive in-vivo experiment of the mouse brain. (a)The MAP image of the mouse cortex vasculature obtained by AR-PAM.Color coding along the depth direction is applied on this image to represent the distribution of blood vessels on the depth direction. SS:sagittal sinus. CS:coronal suture. (b) The MAP image of the mouse skull and the scalp obtained by SAM. (c) Photograph taken after imaging, where the cortex vessels of the brain are invisible. (d)Photograph taken after imaging with the scalp removal,where the result in(a)agrees well with(d). The yellow arrows point out several major vascular landmarks and corresponding locations in(a)and(d). B1,B2,B3,B4 point out the positions of four sections in Fig.9.
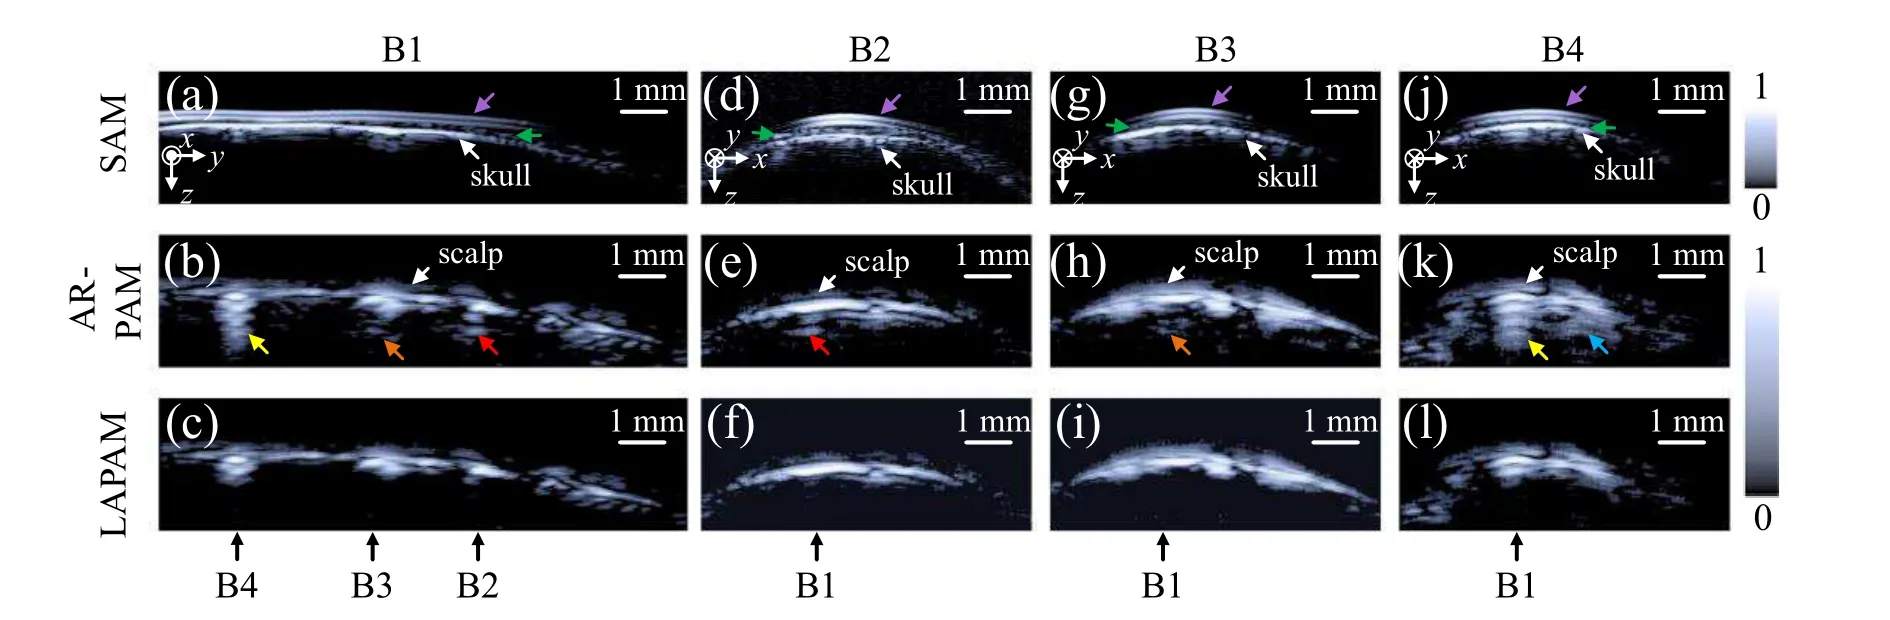
Fig.9. Comparisons of the images in x-z and y-z sections obtained by SAM,conventional AR-PAM and the proposed method. The top row[(a),(d),(g), (j)]gives the SAM images of the y-z plane B1, x-z plane B2, B3, B4 marked in Fig.8. The US echoes can reveal the profiles of the PDMS film layer(purple arrow), scalp(green arrow)and the skull(white arrow). The middle row[(b), (e), (h), (k)]shows the results obtained by a conventional AR-PAM scheme. The red arrow,orange arrow,yellow arrow in(b)point out the reflected artifacts,which correspond to the artifacts indicated in(e)(red arrow), (h) (orange arrow), (k) (yellow arrow), respectively. The corresponding LAPAM images are shown in the bottom row [(c), (f), (i), (l)],where the artifacts pointed out in the middle column are suppressed and the real images of vessels are still left.
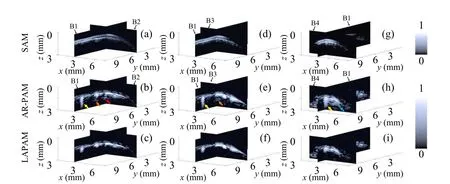
Fig.10. Comparisons of the images in B1-B2 slices,B1-B3 slices,B1-B4 slices obtained by SAM,conventional AR-PAM and the proposed method.The top row[(a), (d)and(g)]gives the SAM images of the B1-B2 slices, B1-B3 slices, B1-B4 slices. The conventional AR-PAM results are shown on the middle row [(b), (e) and (h)] and the corresponding artifacts marked by red, orange, yellow, blue arrows in Fig. 9 are pointed out again. The corresponding artifact-suppressed LAPAM images are displayed on the bottom row[(c),(f)and(i)].
The bottom row [Figs. 9(c), 9(f), 9(i), 9(l)] shows the LAPAM images obtained by the proposed method.Since the acoustic impedance of the skull is about 4.69×10⁶kg/(m2·s),[41]and the acoustic impedance of the tissue is about 1.65×10⁶kg/(m2·s),[42]the correction factor 1/Cused here is-3.35.The results demonstrate that the processing successfully suppresses the artifacts induced by the skull, scalp and the film,but keeps the real image of the vessels. This experiment verifies the practicality of the method inin vivobrain imaging.
For better comparison, Fig. 10 gives the profiles of B1-B2,B1-B3,B1-B4 slices on the left column,middle column,right column, respectively. The top row [Figs. 10(a), 10(d),10(g)]gives the SAM images. The conventional AR-PAM results are shown on the middle row and the corresponding artifacts marked by red,orange,yellow,blue arrows in Fig.9 are pointed out again.The artifact-suppressed LAPAM images are displayed on the bottom row, demonstrating the effectiveness of the proposed strategy.
6. Conclusion
In this work, we propose a LAPAM method to suppress the reflection artifacts caused by multilayered inhomogeneous media, therefore, improve the imaging quality of PAM in its application of imaging the brain of small animals through the scalp and the skull.
We find that when imaging optical absorbers below several acoustically inhomogeneous layers, the multiple reflections of PA signals will appear. Benefitting from the similarity of the propagation scheme between the PA signal and the US echo,the PA signal can be guided by the US echo to suppress the multi-reflections. Based on this finding,we combine conventional AR-PAM and SAM.Implementing our imaging system,the AR-PAM image and the SAM image can be obtained at one scan. And then we propose a method called LAPAM.In this method,we obtain a filter from the US echo to suppress the multiple reflected artifacts and obtain the LAPAM image.
A phantom experiment of imaging several tungsten wires below several acoustic reflecting layers verifies the effectiveness of LAPAM.Finally,anin-vivoexperiment of mouse brain imaging justifies the practicality of LAPAM for biomedical applications. Since multilayered inhomogeneous media often exist in biological tissues,such as the scalp and the skull above the brain tissue, there will be strong reflections that will degrade the quality of brain image.Therefore,the method of LAPAM improves the imaging quality of PAM in some biomedical applications by suppressing the reflection artifacts induced by multilayers,especially in brain imaging without destroying the scalp as well as skullin vivo.
Acknowledgements
Project supported by the National Natural Science Foundation of China(Grant Nos.12027808,11874217,11834008,81900875,and 81770973)and Natural Science Foundation of Jiangsu Province,China(Grant No.BK 20181077).
猜你喜欢
资源导刊(信息化测绘)(2022年6期)2022-08-06
作文小学高年级(2020年12期)2021-01-16
证券市场红周刊(2018年21期)2018-05-14
证券市场红周刊(2018年21期)2018-05-14
证券市场红周刊(2018年22期)2018-05-14
证券市场红周刊(2018年22期)2018-05-14
证券市场红周刊(2018年27期)2018-05-14
证券市场红周刊(2018年27期)2018-05-14
证券市场红周刊(2018年24期)2018-05-14
证券市场红周刊(2018年24期)2018-05-14
- Chinese Physics B的其它文章
- Quantum walk search algorithm for multi-objective searching with iteration auto-controlling on hypercube
- Protecting geometric quantum discord via partially collapsing measurements of two qubits in multiple bosonic reservoirs
- Manipulating vortices in F =2 Bose-Einstein condensates through magnetic field and spin-orbit coupling
- Beating standard quantum limit via two-axis magnetic susceptibility measurement
- Neural-mechanism-driven image block encryption algorithm incorporating a hyperchaotic system and cloud model
- Anti-function solution of uniaxial anisotropic Stoner-Wohlfarth model