
Wide dynamic detection range of methane gas based on enhanced cavity absorption spectroscopy
2022-04-12 03:45YuWang汪玉BoKunDing丁伯坤KunYangWang王坤阳JiaoXuMei梅教旭ZeLinHan韩泽林TuTan谈图andXiaoMingGao高晓明
Chinese Physics B 2022年4期
Yu Wang(汪玉) Bo-Kun Ding(丁伯坤) Kun-Yang Wang(王坤阳) Jiao-Xu Mei(梅教旭)Ze-Lin Han(韩泽林) Tu Tan(谈图) and Xiao-Ming Gao(高晓明)
1Anhui Institute of Optics and Fine Mechanics,Hefei Institutes of Physical Science,Chinese Academy of Sciences,Hefei 230026,China
2University of Science and Technology of China,Hefei 230026,China
3Anhui Advanced Spectroscopy Optical-electric S&T Co.,Ltd.
Keywords: integrated cavity output spectroscopy(ICOS),trace gas,wide dynamic detection,absorption positions
1. Introduction
High-sensitivity gas detection techniques are of great interest in many fields from the industrial process to the emission control and pollution monitoring. In the past few decades,there have been numbers of exciting developments on high-sensitivity spectroscopy techniques,such as photoacoustic spectroscopy, ring-down cavity spectroscopy and cavityenhanced absorption spectroscopy.Each of these methods displays advantages and drawbacks in terms of sensitivity, dynamic range,stability and cost. For instance,the photoacoustic spectroscopy has zero background, good linearity and a wide dynamic response range. However, its sensitivity depends on the laser power, and the response speed is on the order of seconds. The ring-down cavity spectroscopy exhibits a high sensitivity and is insensitive to the laser intensity fluctuations. But it requires fast electronics and high stability of the system. Cavity enhanced absorption spectroscopy(CEAS)is another competitive method in the real applications, owing to its high sensitivity,simple experimental apparatus and ease of operation.
So far, the integrated cavity absorption spectroscopy(ICOS) based on the high reflective mirrors has been widely used in high sensitivity and high-precision trace gases detection. It can be applied to various fields, such as industrial process,[1-3]atmosphere,[4,5]environment[6-8]and human health.[9-11]It also enables many applications for marine exploration,[12,13]aerospace[14]and defense.[15]Different application scenes have different technical requirements. Some applications, such as monitoring the background atmosphere,require both the highest sensitivity and precision. For some other applications, such as gas leak detection and exploring the distribution of the gas hydrate in the methane-rich region,the concentration of target gas can vary over 4-5 orders of magnitude. In this context,both the large dynamic range and the high sensitivity are needed.
To improve the performance of these gas detection techniques, there has been much effort to extend the detection range.In 2009,Li Zhengyinget al.[16]chose two spectral lines with close frequencies and large differences of line strength to improve the dynamic detection range. In 2016, Liet al.[17]proposed a method combining direct absorption and wavelength modulation for uncalibrated trace gas detection, and proved that this can extend the dynamic measurement range of the system. Such a method realized the balance between the measurement range and the accuracy. However,for measuring gases with high concentrations,the long optical path induces a strong absorption of the probing laser and leads to a very weak signal being detectable. As a result,this method has a limited upper bond dynamic detection range,and thus it is challenging to use them for measuring gases with high concentration. To improve the dynamic range of the ring-down cavity absorption spectroscopy, Cuiet al.[18]studied the relation between the total loss in the cavity and the effective optical path. Based on this,they extended the measurement range by tuning the effective cavity length through cavity detuning. However,due to the difficulty of precisely controlling the cavity detuning, the fluctuation of the cavity length results in a large variation of the measurement results. For this concern,Stowasseret al.[19]improved the accuracy of the pressure control in the cavity ring-down spectroscopy and extended the measurement range.But in the real application, the gas concentration is hard to predict,and it is difficult to respond to the large change of the environmental concentration in the real time, which causes a large measurement error due to the fluctuation of the pressure.
In this paper, we propose a method combining an offaxis integrated cavity and a laser that is largely detuned from the absorption peak. This method enables a large dynamic range of the integrated cavity absorption spectroscopy. We extend the upper limit of the measurement range from 0.1%(1000 ppm) to a large dynamic range of 20% gas concentration. This method provides a way for the applications requiring the measurement of the gas concentration with large concentration fluctuations, such as gas leak detection, ocean acidification, carbon sequestration and deep-ocean online exploration of methane hydrate and hydrothermal vents.
2. Principle of ICOS for gas sensing
The basic principle of ICOS is shown in Fig.1. The device uses a tunable laser and two high-reflectivity mirrors to form a high-finesse Fabry-Perot cavity. The gas sample is filled into the cell of the cavity. To formulate the transmission power,we consider a radiation fieldEi=E0ei2πνtof the laser passing through the cavity mirror with a reflectivity ofRand transmission ofT,whereνis the laser frequency andE0is the amplitude. The transmitted light amplitude is obtained from the summation of the beam amplitudes leaving the cavity:[20]
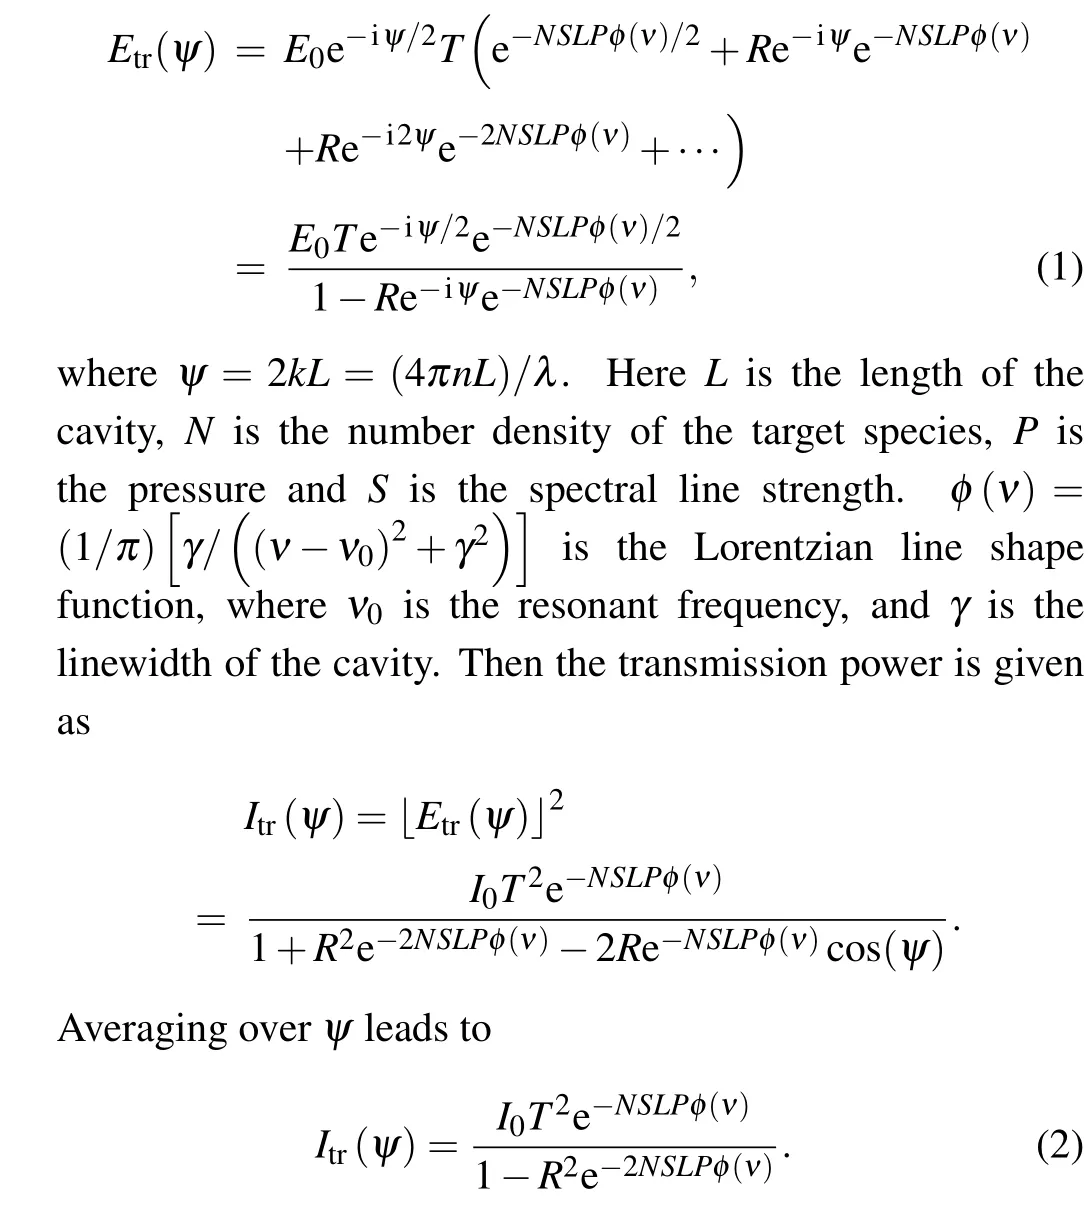
To make the equation concise,we denoteα=SLPφ(ν). For the low gas concentration condition, where the absorption is weak,Nα ≪1, so that e-2NSLPφ(ν)≈1-Nα. Equation (2)can be simplified as
This formula shows a linear dependence of the output intensity on the gas concentration.
In the non-weak absorption case,the transmitted laser intensity of the integral cavity at the position of the spectral linewing is given by

In Fig. 2(a), we calculate the absorption spectra in the integrated cavity at different gas concentrations from 2 ppm to 100%.P1is located at the center of the absorption peak,andP2is chosen to be largely detuned from the absorption peak. The intensity of the transmitted light at the absorption peakP1decreases with the increasing gas concentration. At a high concentration,the intensity of the transmitted laser becomes approximately zero and is barely measurable.When the measurement frequency is largely detuned from the absorption peak, the transmitted laser intensity is much stronger due to the low absorption. Figure 2(b)presents the concentration dependence of the transmitted laser intensity when the gas concentration is low. The results show good linear relationships between the intensity and the concentration with different detunings from the absorption peak. When the gas concentration is high,the transmitted laser intensity shows strong nonlinear relationships to the concentration with different laser detunings from the absorption peak(Fig.3).
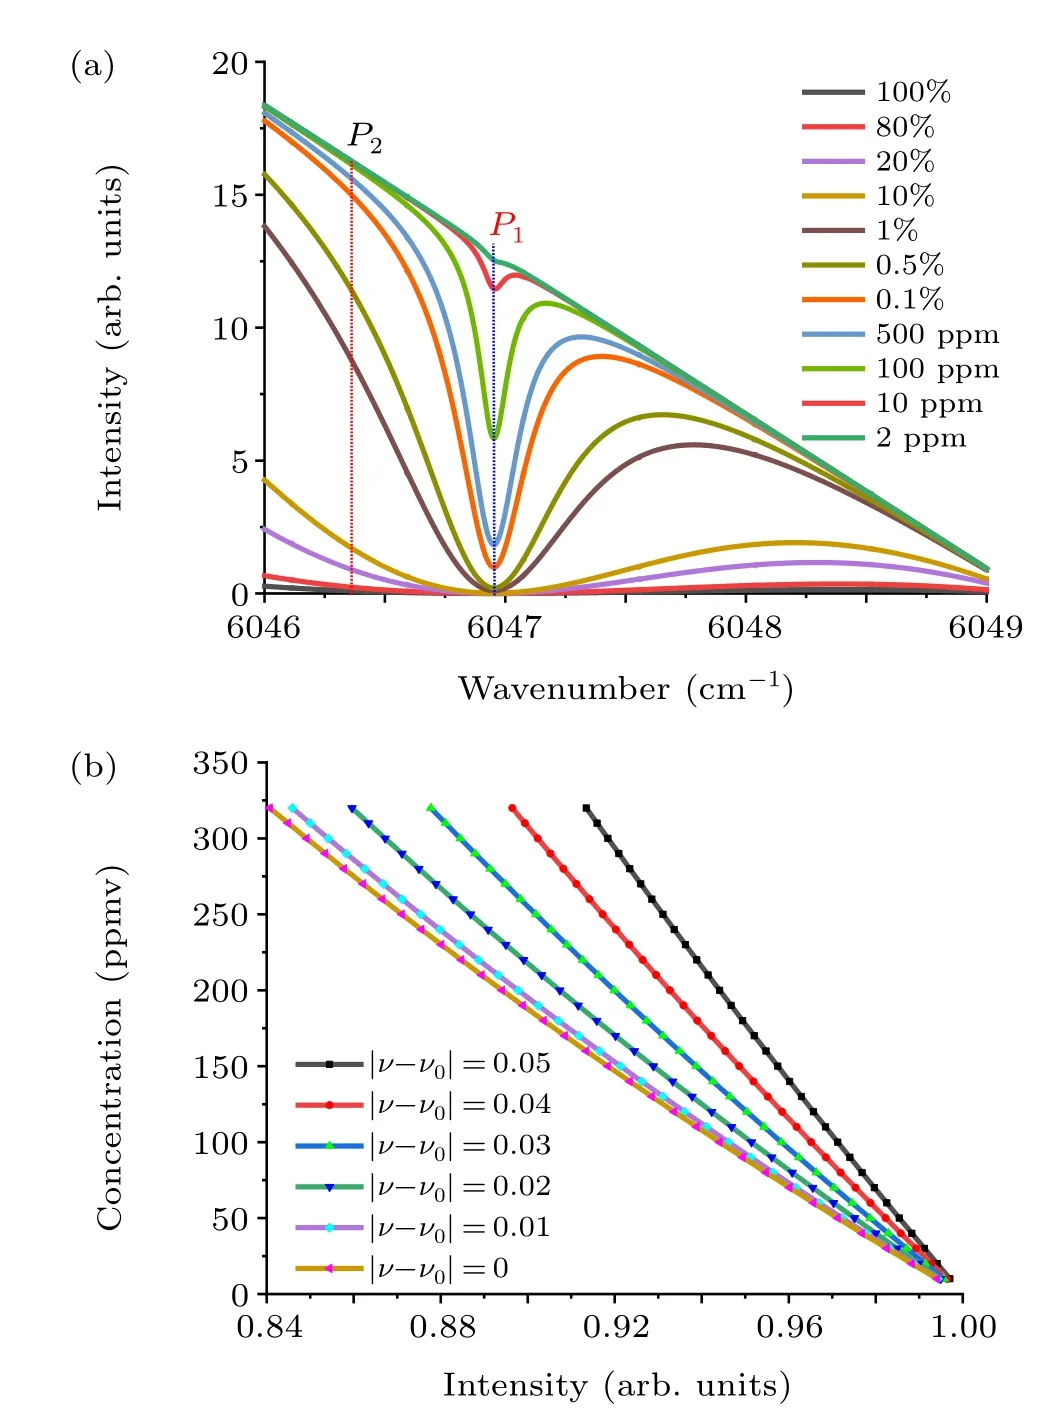
Fig.2. (a)Simulated absorption spectra of integrated cavity at different gas concentrations; (b) Simulation of the transmitted laser intensity at different positions away from the absorption peak at low gas concentrations.
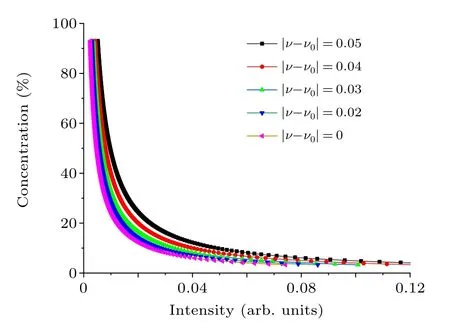
Fig. 3. Simulation of the gas concentration as functions of the transmitted laser intensities in the non-weak absorption case.
3. Experimental setup
The experimental setup is shown in Fig. 4. A 1654 nm InGaAsP distributed feedback (DFB) laser is powered by a high-precision laser controller(LDC 3724,Newport). The injection current is set at 90 mA so that the output power is maintained around 12 mW. We use a sawtooth signal to modulate the on and off of the DFB laser. We first utilize a photodetector to record the laser intensity when the laser is off, and use it as a reference to eliminate the background noise. Then the transmitted laser intensity is measured as the real signal when the laser is on. In order to improve the signal-to-noise ratio,a power adjustable RF white noise source[21]is injected into the DFB semiconductor laser via a bias tee to widen the laser linewidth. The RF noise source power can be adjusted between-40 dBm and-10 dBm to improve the performance of the off-axis integrated cavity instrument with this disturbance. The laser output is collimated by a fiber optical collimator and coupled to an off-axis integrated cavity composed of two lenses with a curvature radius of 1 m and a reflectivity of 99.999%. Two mirrors were placed co-axially on both sides of the optical cavity. The distance between the mirrors is 28 cm and the volume of the cavity was approximately 88 cm3.The output of the integrated cavity is focused onto an InGaAs detector to measure the laser intensity.
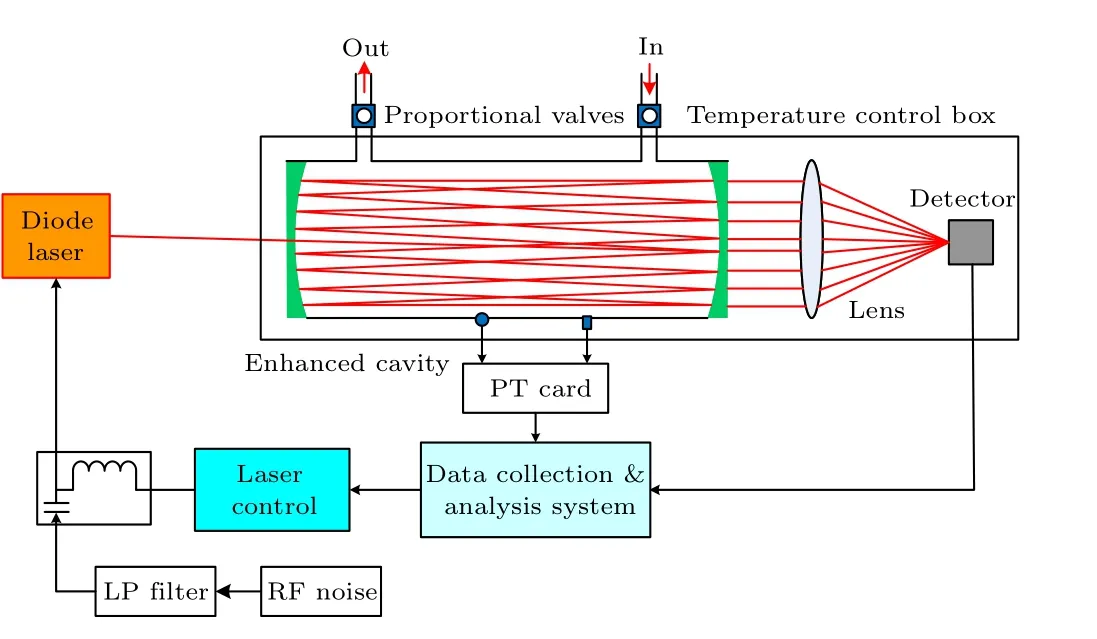
Fig.4. Experimental schematic of off-axis cavity absorption spectroscopy.
4. Results and analysis
First,we measure the transmission spectra of the off-axis integrated cavity absorption spectroscopy at different concentrations. Figure 5(a)shows the integrated cavity transmission spectra at different gas concentrations from 0.2 ppm to 1 ppm.Figure 5(b)presents the differential signal between intensities atP1andP0as a function of the concentration, ΔI=I1-I0,whereI1is the transmitted laser intensity at the absorption peakP1, andI0is the detector dark current atP0when the laser is off. By fitting that data to Eq.(4),we obtain the fitting coefficients asb1=7.96 W/cm2andb2=10.13 W/cm3. The results show a good linear relationship between the transmitted laser intensity and the concentration. The linear correlationR2is 99.85%, and the error between the measurement value and calibration curve is≤±10%.
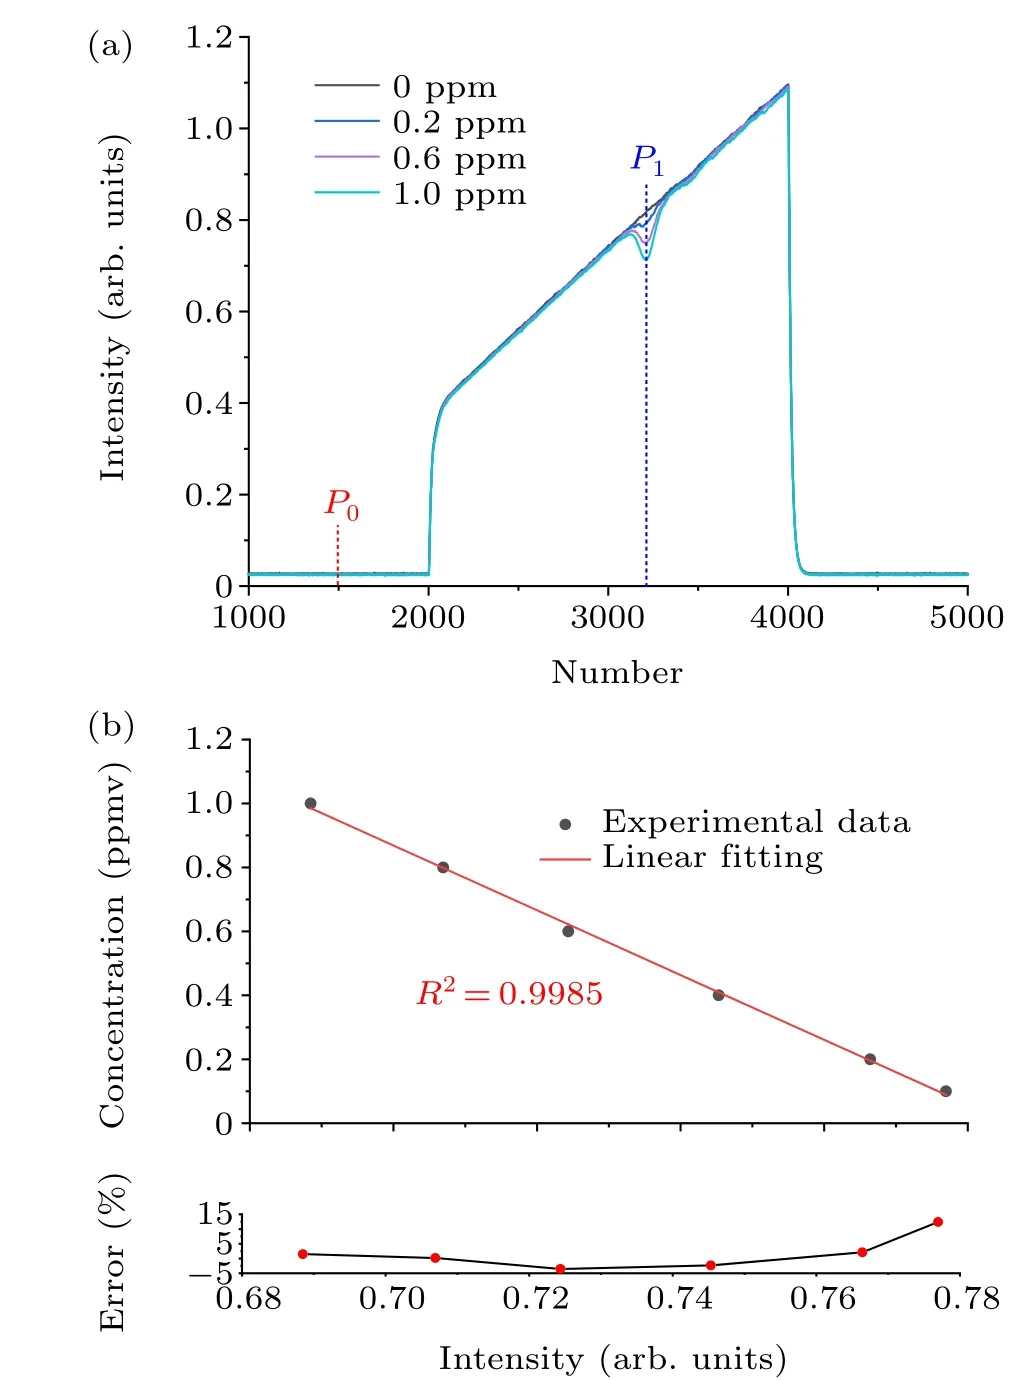
Fig. 5. (a) Plots of the actual output signal of the photon detector. (b) Relation between the gas concentration and the transmission intensity of integrated cavity in the weak absorption case(low concentration).
Figure 6(a) presents the integrated cavity transmission spectrum of the 10 groups of data with concentrations ranging from 1.5 ppm to 20%. The lineshape of the absorption spectroscopy in Fig. 6(a) shows a significant deformation at high gas concentrations. Also,the transmitted laser intensity at the absorption peaks is approximately zero at high concentrations.Therefore,it is hard to use the absorption depth at or close to the absorption peak to determine the gas concentration. In this case,we utilize a laser that is largely detuned from the absorption peak to decrease the absorption intensity. This method helps avoid the absorption saturation and extends the upper limit of the dynamic range of the integrated cavity absorption spectroscopy. Figure 6(b) shows the experimental results of the transmitted laser intensity as a function of the gas concentration when the laser is set to be far off-resonant from the absorption peak. Here we compare the results at four different positions of the output signal of the photon detector(number 3200, 3400, 3650, and 3800). When the laser wavenumbers are very close to the absorption peak,the transmitted laser intensity dramatically drops to approximately zero with an increasing gas concentration, and then stays unchanged around zero within a large concentration scale. Therefore, the intensities at different gas concentrations cannot be distinguished due to the saturated absorption. In contrast, when the laser is detuned far away from the absorption peak,the transmitted laser intensity decreases slowly with an increase gas concentration. This enables the precise measurement of the absorption to determine the gas concentration. Therefore,by choosing a proper laser frequency,we are able to measure both high and low gas concentrations.

Fig. 6. (a) Plots of the actual output signal of the photon detector. (b) The variation curve of the transmitted laser intensity with concentration (high concentration) at different positions away from the absorption peak of the integrated cavity.
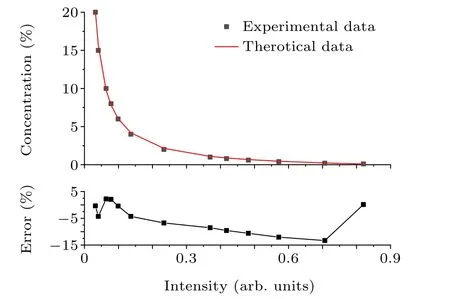
Fig.7. The gas concentration as a function of the transmitted laser intensity of the integrated cavity. The laser frequency is set to be far away from the absorption peak.
Figure 7 shows experimental results of the transmitted laser intensity as a function of the concentration. The actual output signal intensity of the photon detector is acquired at the positions that is 450 numbers detuned from the absorption peak. The data fits well to Eq.(5),which gives the coefficientsa1anda2as 1.87×10⁻⁵W/cm2and 1.4×10⁻⁵cm-3, respectively. The deviation between the experimental value and theoretical calibration is within±10%.Therefore,the gas concentrations can be measured with a high precision in a large dynamic range.
5. Conclusion
Gas detection with a large dynamic range has extensive applications in various fields, such as industry, environment,etc. We propose and experimentally demonstrate a method that can extend the dynamic range of the off-axis integrated cavity output spectroscopy. Such a method extends the upper limit of the dynamic detection range from 0.1%(1000 ppm)to 20%concentrations. With a low gas concentration,the system shows a good linear response. At a high gas concentration, a largely detuned laser is chosen to decrease the absorption intensity. This enables the precise quantitative measurement of the gas concentration in a large dynamic range,with a less than 10%uncertainty. Our results meet the requirements of natural gas detection and other industrial applications.
Acknowledgments
Project supported by the National Key Research and Development Program of China (Grant No. 2017YFC0209700)and the National Natural Science Foundation of China(Grant No.41730103).
- Chinese Physics B的其它文章
- Quantum walk search algorithm for multi-objective searching with iteration auto-controlling on hypercube
- Protecting geometric quantum discord via partially collapsing measurements of two qubits in multiple bosonic reservoirs
- Manipulating vortices in F =2 Bose-Einstein condensates through magnetic field and spin-orbit coupling
- Beating standard quantum limit via two-axis magnetic susceptibility measurement
- Neural-mechanism-driven image block encryption algorithm incorporating a hyperchaotic system and cloud model
- Anti-function solution of uniaxial anisotropic Stoner-Wohlfarth model