
Effects of Combined Stress from Salt and Herbicide on Microbial Remediation of Soil Contaminated by n-Hexadecane and Phenanthrene
2022-07-16 15:04LiuBingkunZuoShuaiWangRuiruiDongKangningZhangXiuxiaLiRuyueHaoBoyuLiJingYinLinghaoBaiYuhaoSongJiayuGuYingyingSunJuan
中国炼油与石油化工 2022年2期
Liu Bingkun; Zuo Shuai; Wang Ruirui; Dong Kangning; Zhang Xiuxia; Li Ruyue;Hao Boyu; Li Jing; Yin Linghao; Bai Yuhao; Song Jiayu; Gu Yingying; Sun Juan
(1. State Key Laboratory of Petroleum Pollution Control, Beijing 102206;2. Department of Enνironment and Safety Engineering, China Uniνersity of Petroleum, Qingdao 266580;3. Department of Computer Science and Technology, China Uniνersity of Petroleum, Qingdao 266580)
Abstract: In this study, physicochemical, cluster, and high-throughput sequencing analyses were used to investigate the joint effects of salt and herbicide (glyphosate) stress factors on the microbial remediation of soil contaminated by n-hexadecane and phenanthrene. Based on the soil’s physical and chemical properties, differences in microbial quantity and enzyme activities were analyzed among the samples, and how that influenced distribution of soil community structure was focused upon. After 120 days of indoor simulated remediation, the cumulative degradation rate of n-hexadecane decreased by 94.92% (blank control), 96.96% (low concentration salt and glyphosate stress group), 65.07% (high concentration salt and glyphosate stress group), while that of phenanthrene decreased by 87.33% (blank control), 86.25% (low concentration salt and glyphosate stress group), 58.45% (high concentration salt and glyphosate stress group). The combined stress of salt and herbicides was capable of lowering the reduction efficiency of organic matter, total nitrogen, and total phosphorus,and also restricting the growth of microorganisms and enzyme activities. Cluster analysis results indicated that the nonstress group was similar to the low-concentration compound stress group during different remedial period, whereas both of those differed starkly from the high-concentration compound stress group. High-throughput sequencing revealed that the dominant soil bacteria phyla shifted from Firmicutes to Actinobacteria within 120 days of remediation.
Key words: oil-contaminated soil; cluster analysis; common quantity sequencing; microorganisms; salt stress; glyphosate stress
1 Introduction
During the extraction and transportation of petroleum products, serious pollution problems sometimes occur[1].Large mounts of petroleum flow into soil, causing large-scale pollution and threatening the survival of animals, plants, and microorganisms[2]. Most petroleum hydrocarbon pollutants are characterized as organic compounds and their by-products. Due to their properties of persistence and stubbornness, they are officially listed as priority environmental pollutants; for example,as persistent organic pollutants (POPs) and polycyclic aromatic hydrocarbons (PAHs)[3]. Most of them are durable and stable, so they can remain in the environment for a long time and are not easily degraded[4-5].
Bioremediation can directly carry out thein-situremediation of a contaminated site. The use of microorganisms to decompose organic matter is considered to be an efficient and effective strategy to break the chain or open-ring structure of oil molecules.Although simulatingin-situmicrobial remediation of petroleum-contaminated soil has proven effective in the laboratory, the result is usually not nearly as satisfactory in the field. That is because the restoration speed of microbes is relatively slow, being weakly resistant to toxic substances in soil and easily restricted by environmental conditions, which further decreases the efficiency of the soil restoration process[6]. Even after biostimulation, the remediation effect in the field fails to match that in the laboratory.
The use of herbicides is quite common in weed control management. It is a main feature of modern industrial agriculture and has become a major environmental and health problem in agricultural systems worldwide[7]. To eliminate weeds, glyphosate was usually sprayed many times after the establishment of most oil well production sites. However, this chemical exerts a dual impact on microorganisms. Long-term exposure to glyphosatecontaminated drinking water will directly affect the host’s molecular process and profile and intestinal microbiota,resulting in the embryonic development failure ofDaphniacrustaceans and changes in their key metabolic functions[8]. Biofilms could bioconcentrate glyphosate,whose concentration could be 2-3 orders of magnitude higher than that in the ambient water system. Additionally,glyphosate can also be rapidly metabolized into AMPA(α-amino-3-hydroxy-5-methyl-4-isoxazole-propionicacid)in the biofilm[9]. As herbicides are widely used during the operation and maintenance of oil well pads, a large number of herbicides will remain in the soil, and the impact on microbial remediation of oil contaminated soil remains to be studied. In this context, most researchers have focused on the magnitude of soil’s oil pollution while ignoring its prior pollution. Accordingly, the effect of herbicides on microbial remediation of petroleumcontaminated soil is rarely studied.
On the one hand, the soil around an oil well site typically consists of saline-alkaline-rich soil, and excessive salt stress usually could inhibit the functional activities of microorganisms. Salt stress can mitigate the dispersion of organic pollutants in soil[10]but also reduce the carbon resources for common microorganisms. Given that soluble salts could lower the solubility of hydrophobic organics in water, this could inhibit the bioavailability of hydrocarbons in high-salt environments. The higher salt concentration in the water phase, the stronger tendency is for organic compounds to be absorbed into the solid matrix (i.e., sediment or soil)[11]. Moreover, high salinity has been shown to impair the endogenous respiration of microorganisms[12]and to affect the production and activity of hydroxylase. Salinity inhibition effects may include a long lag time and slower efficiency of microbial degradation[13].
So far, much research has focused on the PAH degradation of halophilic bacteria or halophilic flora, such as work done in ecological studies[14-15], as well as the relationship between hydrocarbon biodegradation and salinity[16].But other factors such as glyphosate went ignored.Therefore, this study analyzed and discussed the effects of salt and herbicide on soil and its microorganisms.Physical and chemical analysis were used to study the joint impact of salt and glyphosate as a compound stress on soil and microorganisms; cluster analysis was used to discern the degree of affinity of samples under various conditions; high-throughput sequencing was used to investigate changes to soil bacterial community structure and its relationship with environmental factors under various conditions. Our results addressed problems of bioremediation for oil pollution in the presence of salt and herbicides, thereby broadening current knowledge of bioremediation techniques for oil pollution.
2 Experimental
2.1 Soil
The uncontaminated soil used in this study came from the campus of the China University of Petroleum (East China). It was collected and taken to the laboratory for air-dried, and then sieved to remove any large pieces of sand as well as rhizomes. Urea was used to adjust the ratio of carbon, nitrogen, and phosphorus in the sieved soil,to which 900 mg/kg ofn-hexadecane and 100 mg/kg of phenanthrene were each added at contrasting levels (low vs. high, described below). According to theTechnical Specification for Soil Analysis(2014), the soil organic matter (SOM), total phosphorus (TP), total nitrogen (TN),water content, pH, and total water-soluble salts were quantified. The physical and chemical properties of soil are presented in Table 1.

Table 1 Basic physical and chemical properties of contaminated soil
2.2 Experimental treatments and analyses
Three treatments were imposed to study the effects of salt and herbicide glyphosate as a compound stress upon microbial remediation of petroleum-contaminated soil:(1) Blank control (A1), applied as follows: Put 1 kg of the above soil and 10% of the target pollutants’ degradingbacteria into a flowerpot (with an external diameter of 14.5 cm, a bottom diameter of 10.2 cm, a height of 12.5 cm), place this in a box having a constant temperature and humidity, and regularly add sterile water to the soil to maintain the soil moisture at 17%. (2) Stress from low concentrations of salt and the herbicide glyphosate(A6), applied as follows: Put 1 kg of the above soil, 10%of the target pollutants’ degrading bacteria, 2 g of NaCl,and 50 mg of glyphosate into a flowerpot. The next are the same as for A1. (3) Stress from high concentration of salt and the herbicide glyphosate (A7), applied as follows: Put 1 kg of the above soil, 10% of the target pollutants’ degrading bacteria, 10 g of NaCl, and 500 mg of glyphosate into a flowerpot. The remaining steps are the same as for A1. The entire remedial period is 120 days. During the restoration process, samples of soil were serially taken on the 0th, 15th, 30th, 60th, 90th, and 120th day, by using the method of coning and quartering (pass the soil sample through a sieve with a diameter of 2mm,mix it, lay it in a circle, divide it into four equal parts,take two opposite parts for mixing, and then divide it equally).
2.3 Physicochemical analysis
In the laboratory, the SOM of treated soil samples was determined by the potassium dichromate volumetric method—dilution heat method; TN was measured using the Kjeldahl nitrogen analyzer (ATN-300); TP measured using the alkali fusion—molybdenum antimony spectrophotometric method. The pH of the soil was recorded with a pH meter (PHSJ-4F); the dehydrogenase activity in soil was determined by applying the TTC(2,3,5-triphenyltetrazolium chloride) reduction method[17].The catalase activity in soil was quantified by a UV spectrophotometer (UV-2100). The total number of bacteria and fungi in soil were each estimated by the dilution coating method.
2.4 Analysis of phenanthrene and n-hexadecane content
To extract phenanthrene andn-hexadecane from the soil,10 g of dry soil and 100 mL ofn-hexane were mixed with each of the three treatments (i.e., A1, A6, A7) by using the method of coning and quartering. A Soxhlet extractor was used for 24 h, with siphoning done six times per hour. Afterwards, the extracted liquid was filtered through anhydrous sodium sulfate, and a dry nitrogen blower used to concentrate it to 5.00 mL at room temperature.Gas chromatography-mass spectrometer (Agilent 7890B-5977C) was used to quantify the concentrations of the two pollutants.
2.5 High-throughput sequencing analysis
Fresh soil (2 g) from the pots under three imposed conditions (three parallel replicated treatment for each treatment) was taken by using the quarter method on the 30th and 120th day. By following the instructions of the E.Z.N.A.® soil kit (Omega Bio-Tek, Norcross, GA, USA), from each sample its total DNA was extracted; the concentration and purity of this DNA were checked by NanoDrop2000(ThermoFisher, USA), while DNA extraction quality was tested by 1% agarose gel electrophoresis. The V3-V4 variable region was PCR amplified with the 338F(5’-ACTCCTACGGGAGGCAGCAG-3’) and 806R(5’-GGACTACHVGGGTWTCTAAT-3’) primers.Specific information on these primers can be found in Wang[18]. The ensuing PCR products were recovered by using 2% agarose gel, purified by AxyPrep DNA Gel Extraction Kit (Axygen Biosciences, Union City, CA,USA), eluted with Tris-HCl, and finally detected by 2%agarose electrophoresis. QuantiFluor™-ST (Promega,USA) was used for detection and quantification steps.According to the Illumina MiSeq platform’s (Illumina,San Diego, USA) standard operating procedures, the purified amplified fragments were constructed into a PE 2×300 library. Their sequencing analysis was done using QIIME2 pipeline[19]; for details on the taxonomic and diversity methods, please refer to the descriptions in Caporaso et al.[20], Nicola et al.[21], and Mandal et al.[22]
3 Results and discussion
3.1 Physical and chemical properties
Figure 1 shows the changes in soil physical and chemical properties under the A1, A6, A7 during the entire remedial period. After 120 days of remediation, the SOM content decreased from 51.22, 51.74, and 51.10 mg/kg to 21.22, 18.25, and 35.05 mg/kg under A1, A6, and A7,respectively. The results showed that the combined stress of low concentration of salt and herbicide glyphosate did not inhibit the consumption of organic matter. On the contrary, as glyphosate from A6 and A7 likely provided additional N and P elements, the consumption of organic matter exceeded A1 in the later period. The combined stress of high concentrations of salt and glyphosate significantly inhibited the consumption of organic matter. The degradation of glyphosate was related to the SOM content, for which high organic matter quality is beneficial for the absorption of glyphosate[23]. The high SOM content mitigated the adverse effects of glyphosate to a certain extent.
At 120day total nitrogen decreased from 8743, 8544,and 8716 mg/kg to 3901, 4285, and 4305 mg/kg under A1, A6, and A7, respectively. Evidently, the combined stress treatments, even for high concentrations of salt and glyphosate, negligibly affected the consumption of TN.The reason for this might be that urea could react with water to form NH3. Therefore, TN’s consumption was very large at the initial stage, and the smell of NH3was discernible throughout the remedial period. Continuous ammonia volatilization might also have obscured an effect of compound stress on TN in soil.
The TP content decreased from 1540, 1512, and 1934 mg/kg to 711, 714, and 1521 mg/kg under A1, A6, and A7,respectively. The effect from a combined stress of low concentrations of salt and glyphosate was similar to A1,whereas combined stress of high concentrations salt and glyphosate significantly inhibited the consumption of TP in soil. Glyphosate was conducive to the accumulation of soluble organic phosphorus in the first 14 days but not after 30 days[24]. In this experiment, 15 days was the threshold point distinguishing a rapid versus slow decline of TP. Glyphosate degraded fastest, for which pH and moisture were the main factors affecting its degradation[25]. About 50% of the glyphosatederived P was bioavailable and easily recycled by soil microorganisms. Among them, glyphosate-derived P was preferred, which can circulate faster than the P in soil[26].Therefore, the phosphorus consumed in the early stage mainly came from glyphosate itself, after which soil properties accelerated its degradation.
The pH changed from 7.99, 7.57, and 7.61 to 7.59, 7.34,and 7.67 under A1, A6, and A7, respectively. Urea is usually involved in regulating nutrients. It could have reacted with water in the soil, to raise the soil pH in the early stage after which it fell. The results implied that the combined stress of low concentrations of salt and glyphosate accelerated the decline in pH midway along the restoration period (ca. 30 days), such that it was lower than the pH under A1 at 120 days. The pH declined most slowly for the A1 group. The pH of group A6 decreased the slowest, and the pH at the end of restoration was still higher than the initial pH. The degradation of glyphosate in the soil is often affected by temperature, total organic carbon, and pH[27]. High-concentration salt stress caused the soil pH to increase, which hindered the degradation of glyphosate to a certain extent, exacerbating the compound stress.
3.2 Number of microorganisms and enzyme activity
Figure 2 shows the trends in soil enzyme activity and the number of bacteria and fungi under the three treatment conditions (A1, A6, A7) during the entire remedial period. After 120 days, the dehydrogenase activity in soil changed from 0.333, 0.281, and 0.310 mg TPF/g dry soil/h to 0.501, 0.524, and 0.049 mg TPF/g dry soil/h under A1, A6, and A7, respectively. Both A1 and A6 reached their maximum values at 30 days, that is 0.888 and 0.960 mg TPF/g dry soil/h, respectively. During the entire remedial period, these two groups had similar trends.The combined stress of low concentrations of salt and glyphosate in the early stage had a slight inhibitory effect on dehydrogenase activity, whereas in the later stage, due to glyphosate providing additional N and P inputs, its activity now surpassed that under A1. During the whole repair period, the combined stress of high concentrations salt and glyphosate significantly inhibited dehydrogenase activity, whose decline was continuous. Glyphosate could interact with the binding site of mitochondrial succinate dehydrogenase to inhibit dehydrogenase activity[28]. In this study, the combined stress of salt and glyphosate exacerbated that inhibitory effect.

Figure 1 Changes in soil physical and chemical properties under A1, A6 and A7
Values for catalase activity changed from 0.332, 0.326,and 0.318 to 0.542, 0.427, 0.152 (units of 0.1 KMnO4/g/h) under A1, A6, and A7, respectively. Both A1 and A6 reached their maximum values at 30 days, respectively 0.799 and 0.654 0.1 KMnO4/g/h. Glyphosate could disrupt the oxidation process of cells, causing damage to the antioxidant system and thereby reducing catalase activity[29]. The results implied that the combined stress of low concentrations of salt and glyphosate had a slight inhibitory effect on catalase activity, but the overall trend was similar to that of A1. The combined stress of high concentrations salt and glyphosate strongly inhibited catalase activity, whose value declined continuously during the whole repair period.
Total number of bacteria changed from 11.3, 9.9, and 3.4 to 14.6, 10.9, and 2.1 (units: 107/g soil) in response to A1, A6, and A7, respectively. At 30 days and 60 days,A1 and A6 reached their highest values of 24.3 and 16.8 (107/g soil), respectively. Saline-alkali stress likely affected chemical and biological processes, resulting in less microbial biomass[30]. The results implied that the combined stress of low concentrations of salt and glyphosate could negatively impact the number of soil bacteria, while that of high concentrations had a very significant inhibitory effect on bacteria, whose total number remained at an extremely low level throughout the repair period.
Total number of fungal changed from 5.7, 5.9, and 2.6 to 8.4, 8.2, and 1.9 (units: 105/g soil) in response to A1, A6,and A7, respectively. For both A1 and A6, the number of fungi peaked at 30 days, being respectively 11.7 and 11.1(105/g soil). High doses of glyphosate could lower number of fungi in the soil and exert a short-term stimulation effect on soil fungal biomass in the early stage. Longterm use of glyphosate negatively alters the structure and composition of soil fungal communities[31]. The results showed that the combined stress of low concentrations of salt and glyphosate barely affected the number of fungi,but the N and P elements of glyphosate probably enabled the fungi population to exceed that under A1 at 60 to 90 days. By contrast, the high-concentration compound stress had a very significant negative impact on the number of fungi; despite a small increase at 60 days occurred, total number of fungal was still lower at 120 days than its initial value. Fertilization effects can cause huge changes in the composition of soil microbiota, for which the sensitivity of fungi significantly exceeds that of bacteria[32]. Compared with bacteria, fungi’s richness and alpha diversity is generally influenced more by soil texture[33]. This would explain the high similarity we found between A6 and A1 treatments in terms of their changing total number of fungal.
3.3 Phenanthrene and n-hexadecane content
Figure 3 shows the changes in the phenanthrene andn-hexadecane content of soil under the three treatment conditions. With a longer restoration time, there was downward trend for their content. By 120 days of restoration, under A1, A6, and A7 the phenanthrene content had decreased from 100 mg/kg to 12.67,13.75, and 41.55 mg/kg, and then-hexadecane content decreased from 900 mg/kg to 45.72, 27.36, and 314.37 mg/kg, respectively. These results demonstrated that the combined stress of low concentrations salt and glyphosate affected the two pollutants differently. Within the first 15 days, that treatment had a slight promotion effect onn-hexadecane and a very small inhibitory effect on phenanthrene, being indistinguishable from A1 for most days afterward. This might be due to the relatively low toxicity of low-concentration glyphosate,and glyphosate provided a part of phosphorus, which supplemented the nutritional conditions to a certain extent. Probably, as the salinity increased, the number and types of carbon sources available to ordinary microorganisms were correspondingly reduced[34]. The high-concentration compound stress had an obvious inhibitory effect on both phenanthrene andn-hexadecane in soil.
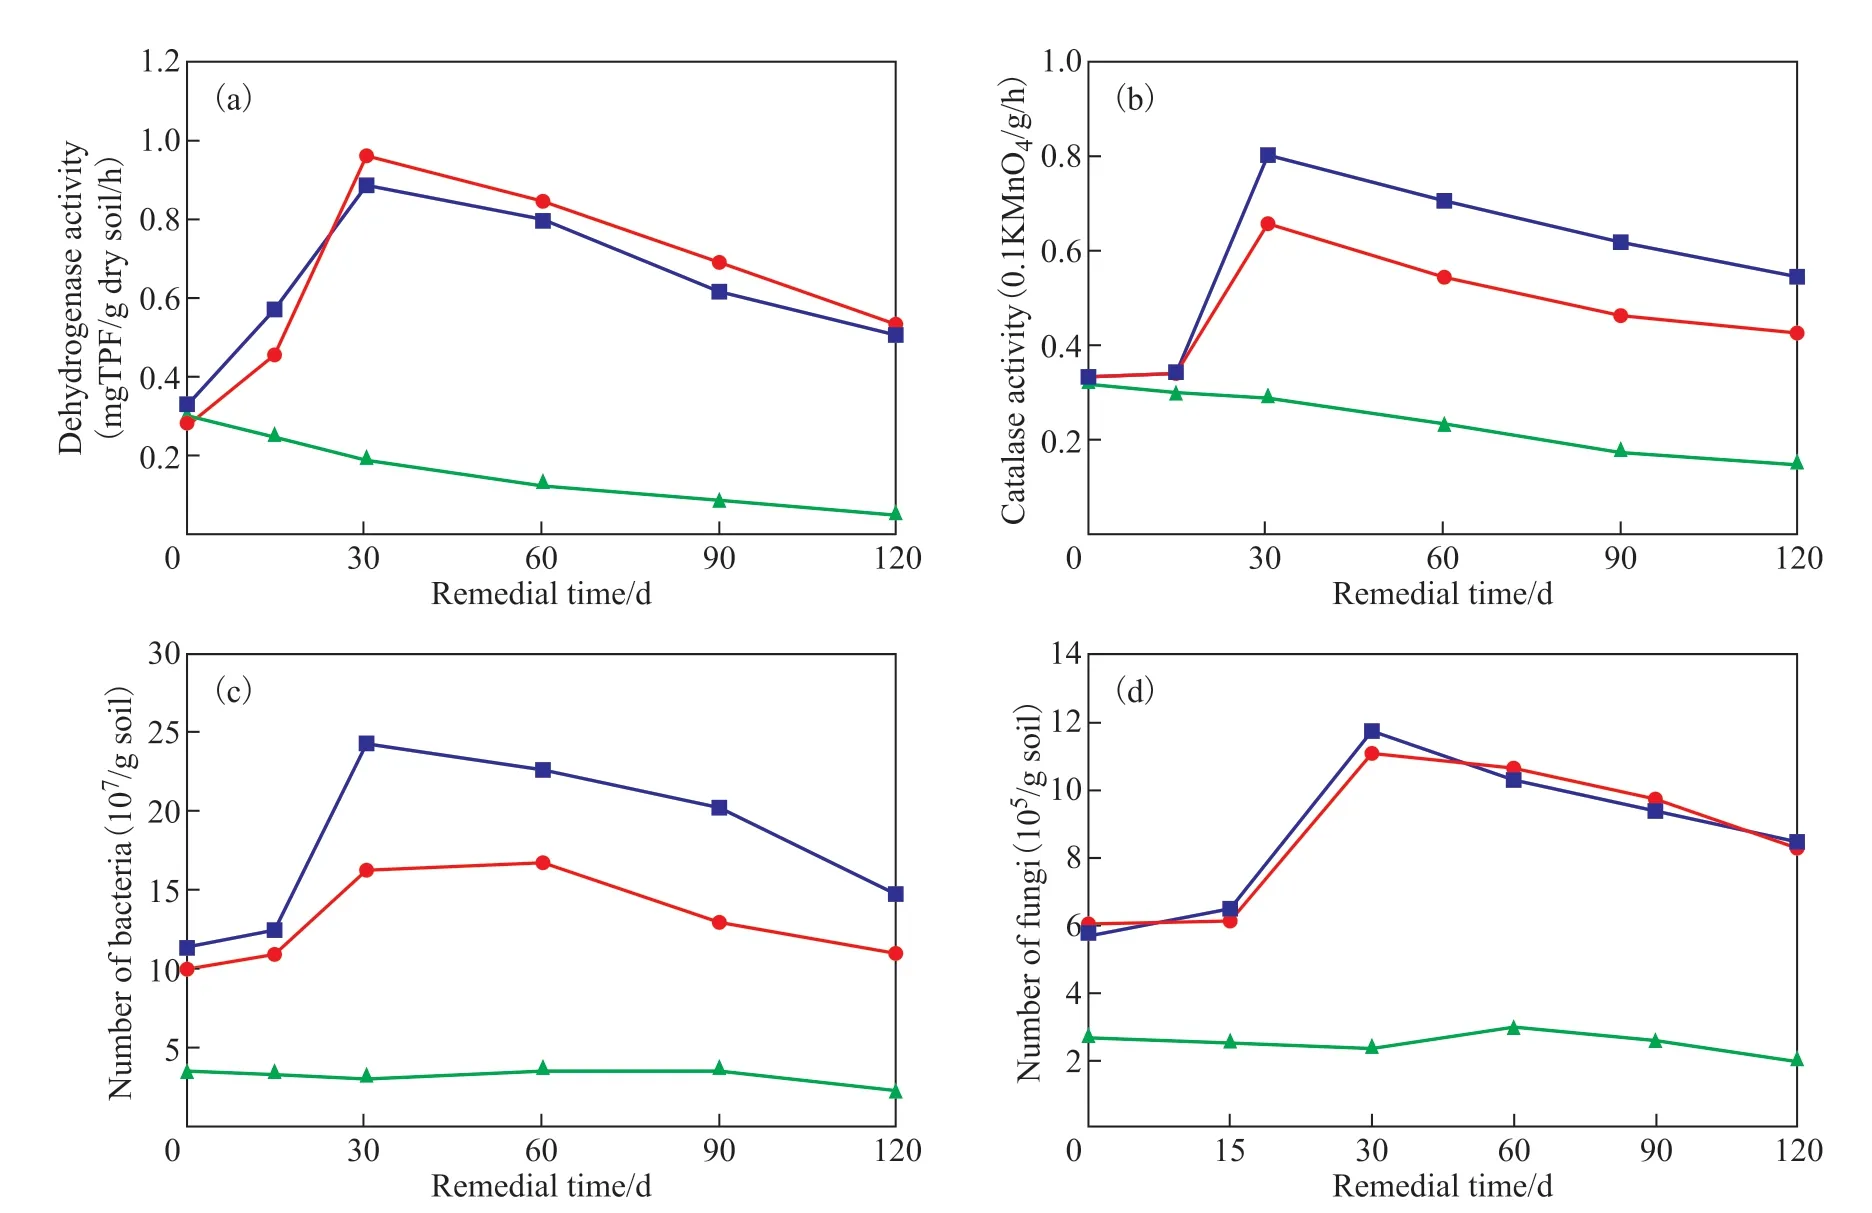
Figure 2 Changes to enzyme activity, bacteria, and fungi in response to various treatment conditions

Figure 3 Degradation of phenanthrene and n-hexadecane in soil under various treatment conditions
3.4 Cluster analysis
Cluster analysis is often used in biology and economics to measure the similarity between different kinds of data. For example, it was applied to large amount of consumption data to study consumer decision-making behavior[35]. Cluster analysis has since been adopted in field of environmental restoration to study the similarity between different samples.
The cluster analysis results are shown in Figure 4. On the 15th day, because the bacteria responsible for degrading pollutants were still adjusting to their local environment,the differences between samples were insignificant.On the 30th day, due to the close clustering distance between A1 and A6, it can be comprised one category,this indicating that at low concentrations, the compound stress treatment had little effect upon the soil samples.Those of A7 formed another separate category, this indicating that the stress arising from high concentrations salt of glyphosate stress had a greater impact on the differences between samples. At 60, 90, and 120 days,the differences between A1 and A6 samples were small,such that any adverse effects incurred early on could be reversed to stand on par with the control by the late stage of remediation. In sum, the ultimate impact on the samples’ differences was driven by the high-concentration compound stress.

Figure 4 Cluster analysis diagram of different remedial periods under various treatment conditions
3.5 High-throughput sequencing analysis
3.5.1 α-diversity
Microbial α-diversity under each stress treatment condition is presented in Table 2. On the 30th day,values for all parameters were generally highest under the A1 treatment. A7 had the lowest values among all samples, indicating the high-concentration compound stress seriously affected the abundance and diversity of soil microorganisms remedial periods. By the 120th day,the various metrics had undergone declines vis-à-vis their values on the 30th day. Due to the lack of sufficient nutrients, the α-diversity of A1 dropped significantly from the initial stage, while that of A6 only fell very slightly.It is worth noting that the decline of A7’s diversity index was the smallest, the opposite of the result we expected.A possible reason was that by the 30th day, any bacteria which had not yet adapted to high-concentration salt stress were eliminated. The bacteria in soil at the 120th day did not differ much from that at the 30th day, likely because the soil lacked nutrients by the end of the restoration period. By then, accordingly, the inter-species competition had gradually increased, so the diversity index decreased in tandem. The loss of soil bacterial diversity in soil was mainly due to a lower pH[36]. Yet the diversity of A6, with the largest decline in pH, surpassed that of A1 by the restoration period’s end, which we mainly ascribe to the continuous stimulating effect of glyphosate upon bacteria in the soil.

Table 2 α-diversity index of A1, A6 and A7 at day 30 and day 120
3.5.2 Bacterial community composition
The distribution of bacterial communities at the phylum level is shown in Figure 5. At the 30th day of remediation,Firmicuteswere generally present in the soil under various treatment conditions and its abundance was the highest(relative abundance was 35.24%, 35.24%, and 42.11% in A1, A6, and A7, respectively). Hence,Firmicuteswere the dominant bacteria genus, followed byActinobacteria,(relative abundance was 26.27%, 28.97%, and 42.96% in A1, A6, and A7, respectively). Yet, it was worth noting thatActinobacteriawas significantly more abundant than other phyla under A7, evenFirmicutes, leading us to speculate thatActinobacteriaare more tolerant to a high salt concentration. The relative abundance ofChloroflxiowas 17.76%, 19.72%, and 11.92% in A1, A6,and A7, respectively, and it ranked third, followed byProteobacteria, whose relative abundance was 13.11%,7.76%, and 1.87% in A1, A6, and A7, respectively. ButProteobacteria’s proportion under A7 is lower than under the other two treatment groups, implying it is more susceptible to salt stress. On the 120th day, the dominant bacteria phylum wasActinobacteria, attaining a relative abundance of 28.49%, 28.87%, and 39.27% in A1, A6,and A7 respectively, which was significantly higher in A7 than the other two treatment groups. ForChloroflxio,its relative abundance was 29.24%, 26.85%, and 14.13%while that of ofFirmicuteswas 15.95%, 16.09%, and 36.89%, in A1, A6, and A7, respectively; however,compared with the latter phylum, we should note thatActinobacteriaaccounted for a higher proportion of bacteria in A7. The relative abundance ofProteobacteriaremained rather low, being only 19.57%, 15.48%, and 1.50% in A1, A6, and, A7, respectively, changing little from its proportions on the 30th day. This might be explained the differential sensitivity ofActinobacteriaandProteobacteriato salt. Using glyphosate four times a year could damage beneficial microorganisms in soil,and its repeated use could impact soil biota[37]. However,in our study, glyphosate was applied only once, and the microbial impact arising from salt stress might be more severe than that from glyphosate stress.
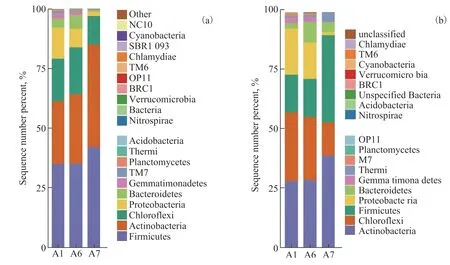
Figure 5 Bacterial community distribution at the phylum level
The distribution of bacterial communities at the genus level is shown in Figure 6. When the species is annotated,there is an unidentified genus in the corresponding database. This indicated that the taxonomic status ofJG30_KF_CM45at the family level was no longer certain. On the 30th day,JG30_KF_CM45was found to be the dominant bacteria genus; its relative abundance in soil under the A1, A6, and A7 treatments was 13.25%,14.59%, and 7.87%, respectively. Followed byBacilalesandBacilaceae, these phyla together accounted for 27.99%, 30.16%, and 22.85% of all bacteria under A1,A6, and A7, respectively. The proportion represented byVirgibacilluswas 12.20% in A7, exceeding that ofJG30_KF_CM45, making it the dominant genus of group A7;hence, the abundance ofVirgibacillussurpassed that of the other two treatment groups. By the 120th day, in both A1 and A6, theJG30_KF_CM45was still favored with a relative abundance of 22.39% and 20.04%,respectively, at least double that present on the 30th day.But in A7,Virgibacilluswas instead dominant, with a relative abundance of 14.12%. The second and third most dominant bacteria were changed toLysobacter(15.25% and 10.76% in A1 and A6, respectively) andNocardioidaceae(8.62% and 7.16% in A1 and A6,respectively) at the end of restoration, but not in A7 under which the relative abundance ofLysobacterwas greatly reduced. From the 30th day to 120th day, the genus-level community structure of A1 and A6 changed relatively little, which also suggests that the stress of low concentrations of salt and the glyphosate stress was able to exert a certain influence on microbial abundance in the soil, albeit less pronounced The range of changes in A7 was the most significant. The high-concentration compound stress treatment severely affected the diversity and abundance of bacteria, microbial responses that could also explain why the cumulative degradation rate ofn-hexadecane and phenanthrene under A7 was the lowest.The diversity and abundance of the bacterial community were not affected by glyphosate, but glyphosate could have served as a source of phosphorus[38,39]. Salt content could significantly change the horizontal community structure, in that the higher the salinity, the greater are the differences[40]. Alongside previous studies, based on our results we speculate that salt had a stronger inhibitory effect than glyphosate in the compound stress treatment.
3.5.3 Redundancy analysis (RDA)
The relationship between environmental factors and bacterial communities is conveyed in Figure 7.On the 30th day, the angle between NaCl and total phosphorus (TP) vectors is > 90°, indicating their negative correlation. The vector is longer for NaCl than TP, which indicates a greater influence of NaCl on the soil bacteria. The angle betweenActinobacteriaand NaCl or TP is < 90°, which implies positive correlations. This might be the reason why that taxon became the dominant one by the 120th day. The angles ofChloroflxio,Proteobacteria,Bacteroidetesvis-à-vis NaCl or TP are all > 90°, illustrating obvious negative correlations. On the 120th day, the angle betweenActinobacteriaand both environmental factors NaCl and TP were still < 90°; hence,Actinobacteriaare positively correlated with NaCl and TP throughout the remediation process, and likewise forFirmicutesandAcidobacteria.However the former’s abundance increased while the latter’s decreased. This could be explained by biological competition and insufficient nutritional conditions.ConcerningChloroflxioandProteobacteria, each remained negatively correlated with NaCl and TP on the 120th day. The loss of soil biodiversity and the simplification of soil community composition could impair or abolish multiple ecosystem functions, such as plant diversity, decomposition, nutrient retention, and nutrient cycling. The average response of all measured ecosystem functions (i.e., ecosystem versatility) has a strong positive linear relationship with soil biodiversity indicators, which suggests that soil community composition could be a key factor in regulating ecosystem functions[41]. That most of the bacterial taxa had strong negative correlations with NaCl, implicates salt stress as key factor hindering the regulation of ecosystem functioning possibly.

Figure 6 Bacterial community distribution at the genus level

Figure 7 RDA ordination plot of NaCl and total phosphorus (TP) and taxa in the bacterial community
4 Conclusion
This study demonstrated the effects of salt (NaCl)and glyphosate as a compound stress on the remedial effect and soil microbial community by examining the physical and chemical properties of soil and via cluster and high-throughput sequencing analyses. Although the low-concentration compound stress had little effect on physicochemical properties, it did negatively affect dehydrogenase activity and bacterial abundance.Moreover, the high-concentration compound stress had an obvious negative impact upon physicochemical properties during the entire remedial period and significantly inhibited the degradation of n-hexadecane and phenanthrene. Cluster analysis showed that lowconcentration compound stress contributed very little towards explaining the differences between samples,while high-concentration compound stress caused huge differences and lasted the entire repair period. The results of high-throughput sequencing analysis implied that the distribution of bacterial communities in the soil changed significantly across three imposed treatment conditions. Changes under low-concentration complex stress and no-stress changes were similar. However, the high-concentration complex stress was responsible for a significant adverse impact on the structure of the soil bacterial community. Finally, the RDA results showed that NaCl and total phosphorus differed in how they affected soil bacteria.
Acknowledgment:This study was supported by the Open Project Program of State Key Laboratory of Petroleum Pollution Control (Grant No. PPC2019021); the Fundamental Reseach Funds for the central universities (22CX01004A-6); the CNPC Research Institute of Safety and Environmental Technology and CNPC Technology Innovation Fund Research Project(Grant Nos. 2017D-5007-0601 and 2018D-5007-0605); and the Research and Promotion Project of key technologies for safety and environmental protection of CNPC (2017D-4013).
- 中国炼油与石油化工的其它文章
- Amorphous Catalysts for Electrochemical Water Splitting
- Tetralin Hydrocracking Reaction Network to Single-Ring Aromatics on Bifunctional Catalysts
- Upgradation of Heavy Crude Oil Via Hydrodynamic Cavitation Through Variations in Asphaltenes
- Wet Desulfurization of High-Sulfur Petroleum Coke Improved via Pre-calcination, H2O2 Treatment, and Ultrasound
- Removal of Heteroaromatic Sulfur Compounds by a Non-noble Metal Fe Single-atom Adsorbent
- A High-Performance Composite Epoxy Coating Based on the Cooperative Enhancement of 2D Co2(OH)2BDC and Electrospun PAN Nanofiber Membrane