
Comparative study of pulsed breakdown processes and mechanisms in self-triggered four-electrode pre-ionized switches
2022-11-17 02:59TianchiWANG王天驰ChuyuSUN孙楚昱YouhengYANG杨友恒HaiyangWANG王海洋LinshenXIE谢霖燊TaoHUANG黄涛YingchaoDU杜应超andWeiCHEN陈伟
Plasma Science and Technology 2022年11期
Tianchi WANG(王天驰),Chuyu SUN(孙楚昱),Youheng YANG(杨友恒),Haiyang WANG(王海洋),Linshen XIE(谢霖燊),Tao HUANG(黄涛),Yingchao DU(杜应超) and Wei CHEN(陈伟),*
1 Key Laboratory of Particle &Radiation Imaging(Tsinghua University),Ministry of Education,Beijing 100084,People’s Republic of China
2 State Key Laboratory of Intense Pulsed Radiation Simulation and Effect,Northwest Institute of Nuclear Technology,Xi’an 710024,People’s Republic of China
3 State Key Laboratory of Electrical Insulation and Power Equipment,Xi’an Jiaotong University,Xi’an 710049,People’s Republic of China
Abstract This work investigates the pulsed breakdown processes and mechanisms of self-triggered preionized switches with a four-electrode structure in nitrogen through intensified charge coupled device photographs.The diameter of the trigger plane hole mainly determines the switch’s electric field distribution.Two configurations with minimum and maximum trigger plane holes are adopted for comparison.In the switch with a minimum trigger plane hole,the maximum electric field distributes at the surfaces of the main electrodes.Although charged particles in the triggering spark channel cannot drift out,homogeneous discharges can be stimulated from both the cathode and anode surfaces through ultraviolet illumination.Two sub-gaps are likely to break down simultaneously.In the switch with a maximum trigger plane hole,the maximum electric field locates near the trigger electrodes.Discharges in both sub-gaps initiate from the trigger electrodes in the form of a positive or negative streamer.Due to the lower breakdown voltage and electric field threshold for discharge initiation,the cathode side sub-gap breaks down first.The analysis of two extreme examples can be referenced in the future design and improvement of self-triggered four-electrode switches with different trigger electrode structures.
Keywords:gas switch,optical diagnosis,pre-ionization,pulsed breakdown
1.Introduction
The generation of high-voltage fast pulses usually needs multi-stage compression and superposition of primary pulses[1-3],which requires high-voltage pulsed switches with low jitter.Working mechanisms of externally triggered switches such as laser-triggered switches[4-6],trigatrons[7-9]and V/n switches[10]are relatively clear,and their jitter can be less than 1 ns[11-14].The operating voltage of a laser-triggered switch can exceed 6 MV[4].In the triggered gap,which breaks down first,the laser is powerful enough to ionize the gas molecules directly.Then the residual selfbreakdown gaps(if any)close under overvoltage in succession[4-6].A trigatron or V/n switch usually has three or more electrodes.Two electrodes first comprise the triggered gap when the external electric pulse is applied to one of them.After the triggered gap breaks down,the self-breakdown gap(s)will break down under overvoltage or with illumination and charged particles generated by the discharge of the triggered gap[7-10].Their operating voltage can also exceed 2.8 MV[10].The above externally triggered switches usually have small jitter because the triggering processes are relatively stable.However,complex external triggering sources with good synchronous systems are needed when they work under a pulsed voltage.Moreover,self-triggered switches with a simpler structure are more competitive in specific pulse drivers that need good mobility[15].Initial electrons in selftriggered switches can be generated by corona discharge of a pin electrode or other self-coupling discharges.However,they usually have larger jitter due to a less stable triggering process.Some of their working mechanisms are not completely clear under specific structures,which might also restrict their performance.In this work,we mainly focus on self-triggered four-electrode pre-ionized switches.
A four-electrode switch is a variant of the classic threeelectrode field-distortion switch[16-18].In a three-electrode switch,the external electric pulse is applied to the disk-like middle electrode,and an overvoltage gap is constructed between the middle electrode and cathode(or anode).In a four-electrode switch,the pin-pin trigger electrodes are fixed at the center of the middle electrode to provide extra preionization.Such three-electrode and four-electrode switches can work under DC or pulsed voltage,and their operating voltage ranges from tens of kV to several MV.However,in a self-triggered four-electrode switch working under pulsed voltage,there is no external electric pulse applied on the middle electrode.Only the triggering spark pre-ionization can generate the initial electrons and reduce the switch jitter.Its working mechanisms should therefore be different.Though it is known that in nitrogen the switch jitter is mainly determined by the time coordination of trigger gap and main gap discharges[19],and the energy of ultraviolet(UV)photons generated by the triggering spark discharge is 3.1-3.9 eV[20],the generation mechanisms of initial electrons and the breakdown processes of two sub main gaps are still unclear.We have analyzed the pre-ionization mechanisms of selftriggered four-electrode switches under two typical configurations with different electric field distributions[21,22]and speculated that the photoemission at the cathode is the main source of initial electrons,but direct evidence is still missing.Therefore,in this work,the breakdown processes of the main gaps in the two self-triggered four-electrode switches[21,22]are studied through an intensified charge coupled device(ICCD)camera,and the pre-ionization mechanisms are further analyzed.
2.Experimental setup
Directly photographing the pulsed breakdown process of a megavolt-class switch through an ICCD camera is challenging because the electromagnetic interference generated by the highvoltage Marx generator is difficult to eliminate.In addition,the grounding inductance under a fast pulse will also restrict the electromagnetic shielding of the ICCD camera.Therefore,a 100 kV prototype switch,whose grounding wire can be shorter,was designed and operated on a smaller platform.The ICCD camera,its power lines and signal lines are covered by a copper mesh to solve the interference problem.
2.1.Switch gap configurations
An overall perspective of the four-electrode switch and two typical configurations are shown in figure 1.Figure 1(a)demonstrates the mechanical configuration and parameters of the switch,in which the cathode and anode sides are symmetrical.The main switch gap distance is denoted asd.The trigger gap plane divides the main gap into cathode side and anode side sub-gaps.The trigger gap locates in the middle of the trigger plane.The trigger gap anode is equipotential with the trigger plane,and the trigger gap cathode is insulated from the trigger plane through the ceramic bushing.The trigger gap distance is 0.5 mm.The trigger gap cathode is made of tungsten.The other electrodes and the trigger plane are made of 304 stainless steel.

Figure 1.The configuration of the four-electrode switch(a),features of SW1(b)and SW2(c)and the equivalent circuit of the fourelectrode switch before its breakdown(d).

Figure 2.Electric field distributions in SW1(a)and SW2(b).

Figure 3.Experimental platform(a)and reading method for reference time delays(b).
The diameter of the trigger plane hole in figure 1(a)has an enormous implication for the electric field distribution,which further influences the breakdown mechanisms and processes.Two typical configurations with two different trigger plane hole diameters are shown in figures 1(b)and(c).We explain the possible working mechanisms of the four-electrode switch by investigating the breakdown processes of these two typical switches.
In figure 1(b),the trigger plane hole diameter is 1.4 cm.The shielding effect of the trigger plane will weaken the electric field near the hole.On the one hand,trigger electrodes are protected from the erosion caused by the main gap discharge current[23].On the other hand,charged particles in the trigger gap arcing channel cannot drift out[21].The UV radiation generated by the trigger gap discharge is believed to be the dominant source of initial electrons under this configuration,so the switch is called a UV-illuminated switch,briefly denoted as SW1[24].
Another extreme case is shown in figure 1(c).The trigger gap hole is large enough(diameter13 cm)to let the breakdown occur between the main and trigger electrodes directly.Charged particles in the trigger gap arcing channel probably also facilitate the breakdown of the main gap.So the switch in figure 1(c)can be called a spark-discharge pre-ionized switch,briefly denoted as SW2[22].The difference between SW1 and SW2 will be further demonstrated in the electric field simulation results in figure 2.
The equivalent circuit of the four-electrode switch shown in figure 1(d)determines the breakdown sequence of the trigger and main gaps.CCa,CaA,CcA,CCcandCcaare the equivalent capacitances between the electrodes.In SW1,whend=7 cm,Cca≈14 pF,CCc≈CcA≈0.2 pF andCCa≈CaA≈6.6 pF[21].In SW2,whend=7 cm,Cca≈5 pF andCCc≈CcA≈CCa≈CaA≈0.2 pF[22].Naturally,the trigger gap should break down first then pre-ionize the main gap.Because the breakdown processes of the main gap are the major concern in this work,we set the parallel resistorsRCc=RaA=1.6 kΩ.The trigger gap will share a large portion(>50%)of the switch voltage and break down at the very beginning under a pulsed voltage with a rise time of about 100 ns.Therefore,a jitter-free continuous pre-ionization driven by the switch leak current throughRCc,RaAand the trigger gap is generated[23].
The previous electric field simulation ignored the existence of trigger electrodes[21,22].This ought to have little influence on SW1 as the main gap electric field at the trigger gap electrodes is shielded.However,the influence of trigger electrodes cannot be neglected in SW2.To get a more precise result for the electric field distribution,three-dimensional simulations of the electric field are carried out.These are shown in figure 2,in which the gap distanced=7 cm.
In SW1,the breakdown of the main gap occurs between the cathode,anode and trigger plane.The actual main gap distanced′should cut the thickness of the trigger plane(1 cm),and the average electric fieldEav=U/d′=16.67 kV cm-1.In SW2,the direct breakdown of the main gap happens between the cathode and anode,soEav=U/d=14.29 kV cm-1.
As figure 2(a)indicates,in SW1 the local maximum electric field near the trigger electrodes is only 14.12 kV cm-1,about 85%of the average value.The maximum electric field(29.23 kV cm-1)is distributed at the surfaces of the main electrodes.The field enhancement factor is about 1.75.The characteristics are roughly the same as those under the simplified two-dimensional simulation.
However,in SW2,three-dimensional simulation is necessary.As figure 2(b)indicates,the maximum main gap electric field(31.78 kV cm-1)arises near the trigger electrodes.The field enhancement factor is about 2.22,which would be underestimated as about 1.90 if the local maximum electric field near the main electrodes(27.19 kV cm-1)were used.
The electric field distribution,determined by the trigger plane structure,strongly influences the breakdown processes,as will be shown in section 3.The simulation results are also used to estimate the threshold electric fields for breakdown initiation.
2.2.Experimental platform and method
A schematic diagram of the experimental platform is given in figure 3(a).The switch gap is put in a sealed chamber.The gas medium is nitrogen and the pressure is 0.1 MPa under all experimental conditions.The gas is renewed when the experimental conditions are changed.The pulse voltage applied to the gap is generated by a Marx generator,whose maximum amplitude and rise time are about 100 kV and 100 ns,respectively.The gap voltage and current are measured by a resistance voltage divider and a current sensor made of a small resistor(0.76 Ω),respectively.The voltage division ratio of the voltage divider is 11 563±128,which is calibrated by a North Star Probe PVM-6,and the response time is theoretically less than 7 ns.The upper cut-off frequency of the current sensor is about 20 MHz.Considering that the rise times of the voltage and current signals are both about 100 ns,the sensors can meet this requirement.An ICCD camera(model Andor DH334T-18U-E3)is used to capture the image during the gap breakdown process.Its nominal gate width is set as 5 ns,which is calculated to be 3-4 ns by reading the minimum and maximum time of the gate signal.The Marx generator and ICCD camera are triggered by the same source directly or indirectly,which guarantees synchronization.The triggering signal for the ICCD camera is generated by the oscilloscope(DPO5104B),which also records the voltage,current signals and the ICCD’s gate signals.Its bandwidth is 1 GHz,and the sampling rate is 5 gigasamples s-1.
Figure 3(b)demonstrates the waveforms and reading method for reference time delays;t=0 is determined by the falling edge of the triggering signal.However,the relative time between the triggering signal and the gap voltage signal(triggering time delay)usually has a jitter.The real zero point of the gap voltage needs to be read artificially,which might bring unnecessary errors.Therefore,the 10% peak time of the gap voltage is chosen as the reference zero point[22].The integral time of the ICCD image is the time difference between the opening and closing time of the ICCD(topenandtclose).Tens of shots were carried out under the same condition with different integral times to reveal the whole discharge process.
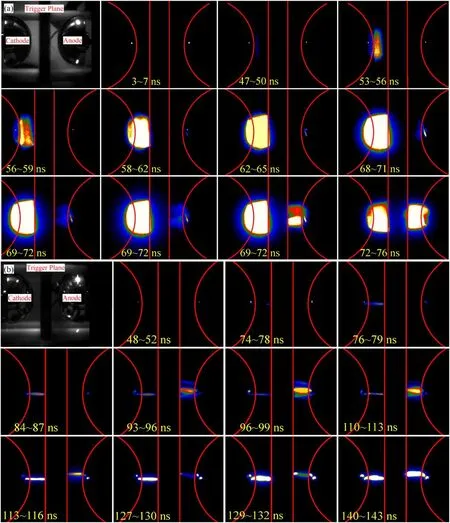
Figure 4.ICCD images of the breakdown processes of SW1(a)and SW2(b)at d=3 cm(small pictures in(a)or(b)with different integral times were taken under the same experimental conditions).
3.Experimental results
The experiments were divided into two parts.First,the breakdown processes of each whole switch with two sub-gaps were qualitatively investigated.Second,the breakdown process between the main cathode/anode and the trigger electrodes was studied.In all cases,the working medium was nitrogen,just as in the practical switches[22],and the gas pressurepwas 0.1 MPa.
3.1.Breakdown processes of two switches
The breakdown processes of the two switches(d=3 cm)were photographed(figure 4).Breakdown parameters and characteristics are compared in table 1.
In SW1,as figure 4(a)shows,the trigger gap broke down at the very beginning and two reflected light spots could be observed at the main electrode surfaces(integral time 3-7 ns).The discharge initiated at the cathode surface during the integral time of 47-50 ns,indicating that UV illumination is likely to function through photoemission at the cathode.A homogeneous discharge channel connected the cathode and the trigger plane during from 47 to 62 ns.Meanwhile,a corona-like discharge at the anode surface was observed from 58 to 65 ns.Afterward,a positive streamer with two largeradius channels connected the anode and the trigger plane from 68 to 72 ns.The integral times showed no difference,indicating a fast propagation of the positive streamer.The channels at the anode sides were quickly heated from 72 to 76 ns.Then the switch current started rising rapidly and reached its 10% peak value at 83.4 ns,defined as the breakdown time delaytd[21,22]in table 1.
The breakdown process of SW2 is demonstrated in figure 4(b).Before 52 ns,the main gap breakdown process did not start,and only the two reflected light spots of the trigger gap discharge could be observed on the surfaces of the main electrodes.Due to the local electric field enhancement,the discharge initiated near the trigger electrodes from 74 to 78 ns.First,the cathode and the trigger electrodes were connected by a positive streamer propagating from the trigger electrodes from 74 to 79 ns.Meanwhile,a corona-like discharge could be observed at the anode surface.The anode and the trigger electrodes were connected from 87 to 96 ns.This fast overvoltage breakdown process was not successfully captured.Then,the discharge channels became brighter due to the heating process.The channel connecting the cathode and the trigger electrodes seemed to first become lowimpedance after 116 ns.The switch current was then already rising rapidly since the breakdown time delaytdwas 116.0 ns.Finally,the channel at the anode side was heated to nearly the same brightness as the channel at the cathode side.
From figure 4,we know that in each switch the breakdown of the main gap can be divided into the breakdown of two sub-gaps at the cathode and anode sides,which are composed of trigger electrodes and the corresponding main electrodes,respectively.However,the influence of each subgap’s breakdown on the other can be excluded,which places limitations on learning the breakdown mechanisms.Therefore,the breakdown processes of the sub-gaps were investigated separately,and relevant mechanisms were further analyzed.
3.2.Breakdown processes of the two switches’sub-gaps
Considering the practical use[22]and capacity of the platform,the gap distancedwas set as 7 cm when we studied the breakdown processes of the sub-gaps separately.The minimum distance between the electrode surface and the center of the trigger plane was 3.5 cm.When one sub-gap’s breakdown process was being studied the other one was shorted to avoid the interaction.Namely,when we photographed the breakdown process of the cathode side sub-gap,RaAin figure 1(d)was set as zero.When we photographed the breakdown process of the anode side sub-gap,RCcin figure 1(d)was set as zero.Therefore,the discharge process did not occur in one sub-gap when we were studying another sub-gap’s breakdown process.
Figure 5 and table 2 compare the breakdown processes,parameters and characteristics of the sub-gaps in SW1.For the cathode side,as figure 5(a)shows,the breakdown initiated at the cathode surface from 53 to 58 ns.The homogeneous discharge developed to a critical length of about 1.5 cm from 54 to 81 ns.Then several much thinner discharge channels closed the residual gap quickly from 81 to 84 ns,and more thin channels formed between the cathode and the trigger plane from 84 to 86 ns,which led to a homogeneous-like discharge from 91 to 94 ns.The switch current started rising rapidly at around 96.0 ns.Finally,one of the thin channels became much brighter and was maintained to hold the switch current.
For the anode side,as figure 5(b)demonstrates,before 64 ns there was no discharge evidence captured.A coronalike discharge first appeared at both the trigger plane and the anode surfaces from 64 to 67 ns.A homogeneous discharge developed from the anode towards the trigger plane from 64 to 89 ns.The corona near the trigger plane moved towards the anode side at a much slower speed.The homogeneous discharge reached its critical length(about 1.5 cm)at around 89 ns.Between 89 ns and 92 ns,two thin channels separated from the homogeneous discharge and connected the anode and the trigger plane.Unlike the cathode side,the thin channels were directly heated,and the switch current started rising rapidly at around 100.4 ns.Although several more thin channels formed later,no homogeneous-like discharge was observed.Likewise,finally,only one bright thin channel was maintained to hold the switch current.
For comparison,we define the electric field of the initial discharge area when the discharge is first observed as the threshold electric field for breakdown initiation.It is a calculated value based on the integral time,voltage waveform and the electric field simulation results in figure 2.Obviously,this threshold field is different from the electric field when the first effective initial electron appears because the electron avalanche process with weak photoemission might not be captured by the ICCD camera.It is more likely to be the threshold electric field for coupled streamer initiation.Table 2 indicates that the threshold electric field for breakdown initiation was higher at the anode side,while its breakdown voltage was lower.This phenomenon accords with the polar effect of the non-uniform field under DC breakdown cases[25].Combined with figure 5,it also reveals that the UV illumination pre-ionized both sub-gaps.Discharge at the cathode side was observed first because the threshold field for breakdown initiation was lower,but the percentage difference in the threshold value was less than 6%.Therefore,in the practical switch with a longer gap distance,the discharge processes in the sub-gaps might be nearly simultaneous rather than the cathode side breaking down first and the anode side breaking down under overvoltage.

Table 1.Breakdown parameters and characteristics of two switches(p=0.1 MPa,d=3 cm;SD,standard deviation).
Figure 6 and table 3 compare the breakdown processes,parameters and characteristics of the sub-gaps in SW2.As figure 6(a)demonstrates,the breakdown of the cathode side sub-gap initiated near the trigger gap from 42 to 46 ns.Meanwhile,a corona-like discharge was observed at the cathode surface,but it developed much more slowly than the positive streamer initiated from the trigger electrodes.Between 43 ns and 60 ns,the positive streamer connected the cathode and the trigger electrodes.Several branches were also observed during the process,but they did not influence the propagation direction.Since the discharge channel formed after 60 ns,its resistance became smaller due to the heating process and the switch current started rising rapidly at around 82.5 ns.The channel continued to be heated and became extremely bright thereafter.
Figure 6(b)demonstrates the breakdown process of the anode side sub-gap.The discharge first initiated near the trigger electrodes in the form of a negative streamer between 41 and 46 ns.Later,a corona-like discharge was also observed at the anode surface from 55 to 58 ns,further propagating towards the trigger electrodes.The maximum thickness of the anode corona was about 5 mm.The negative streamer connected the trigger electrodes and the anode from 43 to 63 ns.The branches also seemed to have little influence on the propagation direction.After the formation of the discharge channel,the anode corona became gradually indiscernible during the next 20 ns,and the thin channel was heated to lower its resistance.The switch current started rising rapidly at about 81.6 ns.Finally,the channel was also heated to be extremely bright.

Figure 5.ICCD images of the breakdown processes of the cathode side sub-gap(a)and anode side sub-gap(b)in SW1 at d=7 cm(small pictures in(a)or(b)with different integral times are taken under the same experimental conditions).
Table 3 indicates that the threshold electric field for breakdown initiation and the breakdown voltage were both higher at the anode side.The threshold field for positive streamer initiation near the trigger electrodes(36.59 kV cm-1)was close to the threshold field for positive streamer initiation near the anode surface in SW1(35.40 kV cm-1).The threshold field for negative streamer initiation near the trigger electrodes(43.47 kV cm-1)was higher.However,the threshold fields for breakdown initiation at the electrode surfaces were both higher,and the discharges near the electrode surfaces did not lead to the final breakdown.
Table A1.Relative gains of the camera in each experiment in figure 4.
Table A2.Relative gains of the camera in each experiment in figure 5.

Table 2.Breakdown parameters and characteristics of sub-gaps in SW1(p=0.1 MPa,d=7 cm;SD,standard deviation).

Table 3.Breakdown parameters and characteristics of sub-gaps in SW2(p=0.1 MPa,d=7 cm;SD,standard deviation).
The above phenomena indicate that the breakdown processes for the two switches and the underlying mechanisms are different due to electric field distributions,which need further analysis.
4.Discussion
The experimental results demonstrating the breakdown processes were shown in the last section.As tables 2 and 3 indicate,sub-gaps in SW1 might break down simultaneously,and the cathode side sub-gap in SW2 first initiates the breakdown.In this section,the dominant breakdown mechanisms of the sub-gaps under two configurations will be analyzed.
Electric field thresholds and initial velocities reflect negative and positive discharge characteristics in the sub-gaps of two switches.Assuming that the discharge process was jitter-free,the two parameters compared in figure 7 could be estimated from figures 5 and 6 by calculating the lengths of the discharge channels at different times.Velocities of the discharges that failed to lead to breakdown were set as zero.The red region indicates the discharge initiated near the trigger electrodes(in SW2),where the trigger gap arcing channel provided sufficient initial charged particles and local spark illumination.The blue region indicates the discharge initiated at the main electrode surface(in SW1),where there were fewer initial electrons,and the triggering spark illumination was in the distance.Due to the above differences,though the initial velocities of positive and negative discharges were in the range of 0.1-1 mm ns-1,close to the previously reported streamer velocity[26],initial velocities in the red regions were remarkably higher.
In SW1,a common slightly non-uniform field is formed in the main gap.When a positive high voltage was applied to the semispherical electrode,the electric field for discharge initiation was higher,and the breakdown electric field was lower due to the space charge effect.This accords with the polarity effect in slightly non-uniform field discharge[25].In SW2,the electric field for negative streamer initiation was about 20% higher than that for positive streamer initiation,which also corresponds qualitatively to the regulation[26]in non-uniform fields.
Figure 7 also indicates that in each sub-gap the breakdown always initiated in the region with the highest electric field.The discharge in other regions did not lead to breakdown even if the electric field became higher,as the cathode corona in figure 6(a)shows.This phenomenon,the differences in electric field thresholds and initial velocities need to be further analyzed in combination with the breakdown models(shown in figure 8)under specific gap configurations.
4.1.Breakdown models of SW1’s sub-gaps in which the maximum electric field distributes at the main electrode surface
As figure 8(a)shows,the breakdown model for the cathode side sub-gap in SW1 is easy to explain.The energy of the UV photons is in the range 3.1-3.9 eV,close to the work function of stainless steel(4.48 eV)[20].Free electrons are very likely to be emitted from the cathode surface via the Schottky effect due to UV illumination.Because the triggering spark radiation propagates in the form of a spherical wave and there are varying degrees of field enhancement at the cathode surface,the initial homogeneous discharge is observed in figure 5(a).It has been proved that pre-ionization ahead of a formed streamer can accelerate its propagation[27],which can explain why the initial discharge velocity on the cathode side(0.56 mm ns-1)is higher than that on the anode side(0.21 mm ns-1).
Figure 8(b)demonstrates a breakdown model of the anode side sub-gap.The primary concern is the source of initial electrons.The first ionization energy of nitrogen is 15.5 eV,much higher than the energy of UV photons.Therefore,single-photon ionization is hardly possible.Multiphoton ionization is also questionable because the radiant power of spark UV illumination is much lower than that of a laser.Alternatively,the UV photons might excite the nitrogen molecules,and cascade ionization probably occurs.Nitrogen is not an electronegative gas,so the detachment of negative ions can usually be neglected[21].Based on figure 5(b),we know that a corona discharge can be stimulated at the trigger plane surface,where the initial electrons might also be generated by UV illumination.Although the corona discharge develops very slowly and does not directly lead to the breakdown,electrons at its head might drift towards the anode,and new electrons could arise due to impact ionization.Once some electrons have arisen near the anode surface,the electron avalanche and positive corona can be stimulated and further develop with the increasing electric field.Because the initial electrons near the anode need more time to emerge,and some of the UV photons are consumed in the excitation process,the electric field threshold for discharge initiation at the anode side is higher than that at the cathode side,and the initial discharge velocity of the anode side is lower.
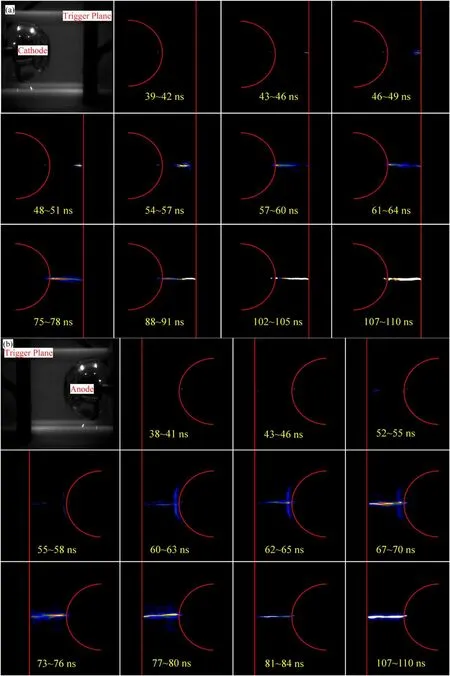
Figure 6.ICCD images of the breakdown processes of the cathode side sub-gap(a)and anode side sub-gap(b)in SW2 at d=7 cm(small pictures in(a)or(b)with different integral times are taken under the same experimental conditions).

Figure 7.Electric field thresholds and initial velocities of negative and positive discharges.
4.2.Breakdown models of SW2’s sub-gaps in which the maximum electric field distributes at the trigger electrodes
As figure 8(c)demonstrates,the breakdown model of the cathode side sub-gap in SW2 can be simplified as a positive streamer.The triggering spark channel can provide sufficient initial charged particles nearby.Meanwhile,the local illumination might facilitate the propagation of the positive streamer by exciting nearby nitrogen molecules.One of the notable phenomena is that a negative discharge is not successfully stimulated at the cathode surface under an even higher electric field as time goes on.One probable reason is that nearby neutral molecules absorb most photons generated by the trigger gap discharge and only a few reach the cathode surface.Therefore,few initial electrons are generated at the cathode surface,and the intensity of continuous pre-ionization[27]is weakened to a great degree,which might restrain the cathode discharge.
Figure 8(d)provides a breakdown model of the anode side sub-gap.The dominant process is the negative streamer propagating from the trigger electrodes towards the main anode.The electric field for its initiation is higher than that for the positive streamer,and its initial velocity is also lower than that of the positive streamer.These results can be explained[26]because more electrons are needed to stimulate a negative streamer.Some electrons might directly drift out from the trigger gap arcing channel,while others need to be generated by impact ionization.The intensity of spark illumination might also be reduced because some electrons might drift out and become initial electrons to stimulate the electron avalanches.Meanwhile,it might be more difficult for free electrons to reach the anode surface without the large area of the corona at the trigger plane surface providing source electrons.The above probable reasons also lead to another phenomenon:the anode corona arises under a much higher electric field than in SW1 and cannot dominate the breakdown process.

Figure A1.The relative brightness in figures 4-6.

Figure 8.Breakdown models of(a)cathode side sub-gap in SW1,(b)anode side sub-gap in SW1,(c)cathode side sub-gap in SW2 and(d)anode side sub-gap in SW2.
Through the above analysis of breakdown processes in SW1 and SW2 as two extreme examples,the possible working mechanisms of four-electrode switches with selftriggered pre-ionization might be explained,and the factor determining their difference is the electrode structure(electric field distribution).
5.Conclusions
Pulsed breakdown processes and mechanisms in two typical self-triggered four-electrode pre-ionized switches in nitrogen at atmospheric pressure were investigated.The following conclusions can be made.
First,in both switches,the breakdown first initiates in the sub-gap at the cathode side.If the trigger plane hole is small enough and the maximum electric field distributes at the main electrode surfaces(in SW1),the discharge originates from the cathode surface in the form of a homogeneous discharge.If the trigger plane is large enough and the maximum electric field distributes near the trigger electrodes(in SW2),the discharge first initiates near the trigger electrodes in the form of a positive streamer.
Second,if the trigger plane hole of the switch is small enough and the maximum electric field distributes at the main electrode surfaces(in SW1),pre-ionization is effective in both sub-gaps,which can stimulate a homogeneous discharge at the cathode or anode surface.In a practical switch the breakdown is likely to develop in both sub-gaps simultaneously.In the anode side sub-gap,the threshold electric field for breakdown initiation is higher,probably because the initial electrons need more time to arise near the anode,and UV photons generated by the triggering discharge are also consumed in the excitation of nitrogen molecules rather than just photoemission at the electrode surface.
Third,if the trigger plane is large enough and the maximum electric field distributes near the trigger electrodes(in SW2),the cathode side sub-gap first breaks down due to lower breakdown voltage and a lower electric field threshold for discharge initiation.A higher electric field is needed to stimulate the negative streamer propagating from the trigger electrodes and the corona at the anode surface.The cathode corona cannot be successfully stimulated even under a higher electric field,probably because most of the UV photons generated by the trigger gap discharge are expended to facilitate the positive streamer propagating from the trigger electrodes.
Appendix
Each small image in figures 4-6 is a pseudo color picture transferred from the ICCD intensity images.The brightness in these images only represents a relative brightness,which qualitatively reflects the density of charged particles in the discharge area.The relative brightness has to be adjusted because the discharge processes of the cathode and anode side sub-gaps might not be synchronous.For example,in figure 4(a),from 69 to 72 ns,the discharge channel in the cathode side formed and was very bright,but the discharge channel in the anode side was still developing and very dark.This process will be covered up if the relative brightness is not adjusted.
Therefore,the exposure time,gate width,pre-amplifier gain and relative gain in each experiment are provided in this appendix.In each experiment,the exposure time was 0.01 s,the gate width was 5 ns and the pre-amplifier gain was 4×.The relative gains in each experiment in figures 4-6 are given in tables A1-A3 below.
Figure A1 is the relative brightness in figures 4-6.‘Dark’means the density of charged particles is relatively low while‘Bright’means the density of charged particles is relatively high.
ORCID iDs
猜你喜欢
Chinese Physics B(2022年11期)2022-11-21
Plasma Science and Technology(2022年2期)2022-03-10
百科探秘·海底世界(2021年9期)2021-10-11
疯狂英语·读写版(2021年5期)2021-06-15
武汉科技大学学报(社会科学版)(2020年2期)2020-04-28
琴童(2017年7期)2017-07-31
小学科学(2017年5期)2017-05-26
河北医科大学学报(2017年2期)2017-03-10
红领巾·萌芽(2016年1期)2016-09-10
 Plasma Science and Technology2022年11期
- Plasma Science and Technology的其它文章
- An equivalent model of discharge instability in the discharge chamber of Kaufman ion thruster
- Wide-range characteristics of beam perveance and saddle point potential of LIPS-200 ion thruster
- Discharge and jet characteristics of gliding arc plasma igniter driven by pressure difference
- Investigation of stimulated growth effect using pulsed cold atmospheric plasma treatment on Ganoderma lucidum
- Nanosecond laser preheating effect on ablation morphology and plasma emission in collinear dual-pulse laser-induced breakdown spectroscopy
- Interaction of an unwetted liquid Li-based capillary porous system with high-density plasma