
Modeling and Analysis of Production Logistics Spatio-Temporal Graph Network Driven by Digital Twin
2022-12-09 14:22ZHENGLonghui郑龙辉SUNYicheng孙奕程ZHANGHuihui张辉辉BAOJinsong鲍劲松CHENXiaochuan陈晓川ZHAOZhenhong赵振洪CHENZhonghao陈钟浩GUANRuifeng管瑞峰
关键词:劲松
ZHENG Longhui(郑龙辉), SUN Yicheng(孙奕程), ZHANG Huihui(张辉辉), BAO Jinsong(鲍劲松), 2*, CHEN Xiaochuan(陈晓川), ZHAO Zhenhong(赵振洪), CHEN Zhonghao(陈钟浩), GUAN Ruifeng(管瑞峰)
1 College of Mechanical Engineering, Donghua University, Shanghai 201620, China
2 Shanghai Frontier Science Research Center for Modern Textiles, Donghua University, Shanghai 201620, China
3 Guangzhou Zhijing Information Technology Co., Ltd., Guangzhou 510220, China
Abstract: In the process of logistics distribution of manufacturing enterprises, the automatic scheduling method based on the algorithm model has the advantages of accurate calculation and stable operation, but it excessively relies on the results of data calculation, ignores historical information and empirical data in the solving process, and has the bottleneck of low processing dimension and small processing scale. Therefore, in the digital twin (DT) system based on virtual and real fusion, a modeling and analysis method of production logistics spatio-temporal graph network model is proposed, considering the characteristics of road network topology and time-varying data. In the DT system, the temporal graph network model of the production logistics task is established and combined with the network topology, and the historical scheduling information about logistics elements is stored in the nodes. When the dynamic task arrives, a multi-stage links probability prediction method is adopted to predict the possibility of loading, driving, and other link relationships between task-related entity nodes at each stage. Several experiments are carried out, and the prediction accuracy of the digital twin-based temporal graph network (DTGN) model trained by historical scheduling information reaches 99.2% when the appropriate batch size is selected. Through logistics simulation experiments, the feasibility and the effectiveness of production logistics spatio-temporal graph network analysis methods based on historical scheduling information are verified.
Key words: digital twin (DT); production logistics; job scheduling; spatio-temporal analysis
Introduction
In order to effectively improve the efficiency of production logistics and reduce the cost of production logistics, production logistics distribution as a key part of production operations, task allocation problems, and vehicle routing problems has been widely studied. In order to balance the logistics costs of suppliers and manufacturers, Yang and Wang[1]took the total logistics cost of the two-stage supply chain as the optimization target, and constructed a two-stage collaborative optimization model of delivery time and quantity from multiple suppliers to manufacturers, and from manufacturers’ warehouse to production lines. Yinetal.[2]constructed a double weight directed network model of workshop production logistics with time window, and studied the performance indices of workshop production logistics networks, such as node importance, stability, and self-repair ability. In order to solve the collaborative dynamic scheduling problem of customized workshop production and logistics, Caietal.[3]proposed a complete reactive scheduling information-physical system framework. Zhangetal.[4]studied energy saving oriented path planning for single-load automated guided vehicle (AGV) in discrete manufacturing shop environments. Aiming at the problems of high no-load ratios and low efficiency of stackers and AGVs in drug warehouse, Jiangetal.[5]established an integrated scheduling mixed command sequence operation time model with the goal of the shortest total operation time of orders in and out of warehouses. Chenetal.[6]proposed the multichromo-some genetic algorithm, which unified the solving algorithm of multi-car yards and multi-model problems with the traditional single-car yards and single-model problems. Aiming at the shortcomings of the combination of three-dimensional loading modes and transportation resource sharing modes in vehicle routing problem research, Wangetal.[7]proposed a vehicle routing optimization strategy based on transportation resource sharing under three-dimensional loading constraints. To sum up, in most studies, the process of logistics distribution optimization is as follows: firstly, multi-constraint modeling before task scheduling, then combined optimization of multi-task and multi-objective, and finally, monitoring and real-time control of the distribution process during transportation. However, in the long-term production and operation process, a large number of original scheduling data and manual scheduling experience have been accumulated, and the above research lacks the use of these data and experience.
With the development of industrial internet, Internet of Things technology, big data and artificial intelligence technology, the emergence of intelligent technology is causing significant changes in today’s logistics and transportation[8]. Chenetal.[9]proposed a novel prediction method, namely the travel time difference model, which exploited the difference between the shortest travel time and the actual travel time to predict next locations. Chenetal.[10]used deep learning to predict the layout of bike parking spaces and dynamic demand for bike scheduling. Zheng[11]summarized the techniques of trajectory data preprocessing, management and spatio-temporal data mining. In order to solve the difficult problem of manufacturing shop scheduling caused by the complexity and changeability of the man-machine material method in the transportation scene, digital twin (DT), as a technical means, has attracted more and more attention along with the proposal of a digital twin workshop(DTW)[12]. DT technology can realize the interconnection and intelligent operation control of the physical world and the information world, and realize the interaction and integration between the physical world and the digital information world of manufacturing. DTW[13-14]consists of physical workshops, virtual workshops, workshop service systems and workshop twin data. Establishment criteria[15], evaluation criteria and evaluation index system[16]of a DT model provide reference for the decision-making process at all stages. Driven by twin data, the DT system realizes the iterative operation of task combination optimization, transportation route planning, and transportation process control of production logistics between the physical world and the upper logistics service system through the real mapping, real-time interaction and closed-loop control between the physical entity and virtual model of production logistics equipment, so as to achieve seamless and intelligent production process logistics of a new production logistics operation mode[12]. In recent years, the use of DT technology to solve intelligent scheduling problems in manufacturing enterprises has been studied by experts at different levels. Since DT is characterized by virtual reality interaction, real-time mapping, and symbiotic evolution, Fangetal.[17]proposed a new job-shop scheduling method based on DT to reduce scheduling bias, and proposed a scheduling resource parameter updating method and a dynamic interactive scheduling strategy to realize real-time accurate scheduling. Zhangetal.[18]designed DT-based control framework to obtain all the information needed for decision making. The DT-enhanced dynamic scheduling method proposed by Zhangetal.[14]performed availability prediction, interference detection and performance evaluation on workshop machines, and generated rescheduling with the support of real-time data of scheduling execution and stored DT data. Liuetal.[19]proposed a real-time data-driven online prediction method for running state of the DTW, and realized the online prediction of the workshop based on continuous transient simulation by integrating real-time data. In order to realize the production line simulation technology based on DT, Shietal.[20]proposed a DT logical model construction method for production line simulation. Many scholars have also introduced DT into enterprise logistics. In order to improve the whole life cycle management of goods distribution and optimize the distribution process, Dengetal.[21]integrated DT into distribution management and studied the distribution management system based on DT. Aiming at the problem of unclear system performance and low optimization degree in distributed scheduling of the multi-robot access system with multi-seeker vehicles, Sun and Zhao[22]proposed a centralized scheduling method based on DT. Aiming at the problem of the asynchronous of assembly execution and material distribution, Zhangetal.[23]proposed a material just-in-time distribution method based on grey theory and multi-model interaction mechanism for a satellite assembly DTW. It is a valuable exploration to apply DT to optimize production logistics distribution. Most of the existing research is from the aspects of system construction, scheduling methods, algorithm decision, and online prediction, but few types of research are using historical scheduling data and manual scheduling experience in DT.
The logistics information of the whole process and all elements can be obtained by a DT system. If the traditional optimization algorithm is used, it is difficult to adapt to the huge amount of data, and the solution time is also difficult to control in an effective range. With the continuous growth of spatial data volume, spatial data contains huge value. Traditional data perception storage technology and processing and analysis methods have been unable to fully explore the value of massive spatial data[24]. The actual production logistics system can be regarded as an interactive system that changes dynamically over time, and the dynamic structure contains key information about the system. Graph network is widely used in relational and interactive systems, so we can use the memory module in the spatio-temporal graph network to construct a temporal map of logistics combined with historical experience data to explore the internal temporal and spatial relationships of the logistics system, and then use the model to predict the link relationships of workshops, roads, vehicles, and tasks. Taking full advantage of the characteristics of the DT system, such as accurate virtual-real mapping, real-time decision control and multi-source data fusion, this paper proposes a modeling and analysis method of production logistics spatio-temporal graph network, DT-based temporal graph network (DTGN), which is used to make full use of historical scheduling data and manual experience in the process of production logistics. Different from the previous research work mentioned above, the proposed method uses the memorized logistics data to predict the probability of events occurring in the next stage, so as to carry out reasonable path planning after matching engineering vehicles and tasks, and complete the process of distribution tasks.
1 DT-Driven Engineering Vehicle Job Scheduling Framework
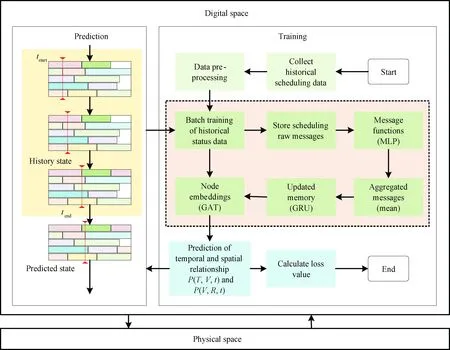
The DT aims to digitize physical entities or systems, realize the fusion of physical information world driven by twin data, and simulate the operation process of physical entities in real situations with the help of twin data. At present, a large number of historical data exist in the operation of factory engineering vehicles, which lays a certain foundation for the application of DT technology in the job scheduling of engineering vehicles. The construction vehicle job scheduling infrastructure proposed in this paper based on DT is shown in Fig. 1.
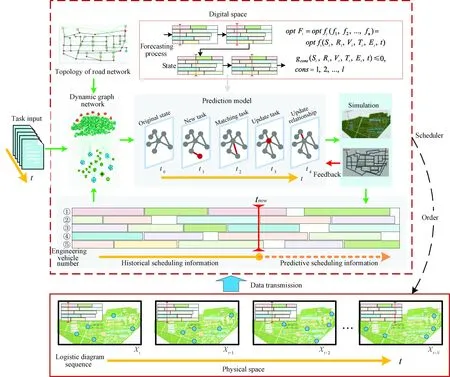
Fig. 1 DT-driven engineering vehicle job scheduling framework
1.1 Physical space
Physical space is a real logistics distribution system, which mainly receives transportation instructions from the model layer through a mobile communication module, performs corresponding workpiece transportation tasks, and collects real-time operation data of vehicles and maps by the data acquisition module. In the DT of logistics vehicle scheduling, the connection between physical space and digital space is established through virtual reality interaction and we use temporal graphs to map vehicle states, road states, workshop states, and task states. The use of virtual reality interaction can make traditional distribution transparent. The real-time monitoring and scheduling of the distribution process can meet the precise distribution requirements of production logistics.
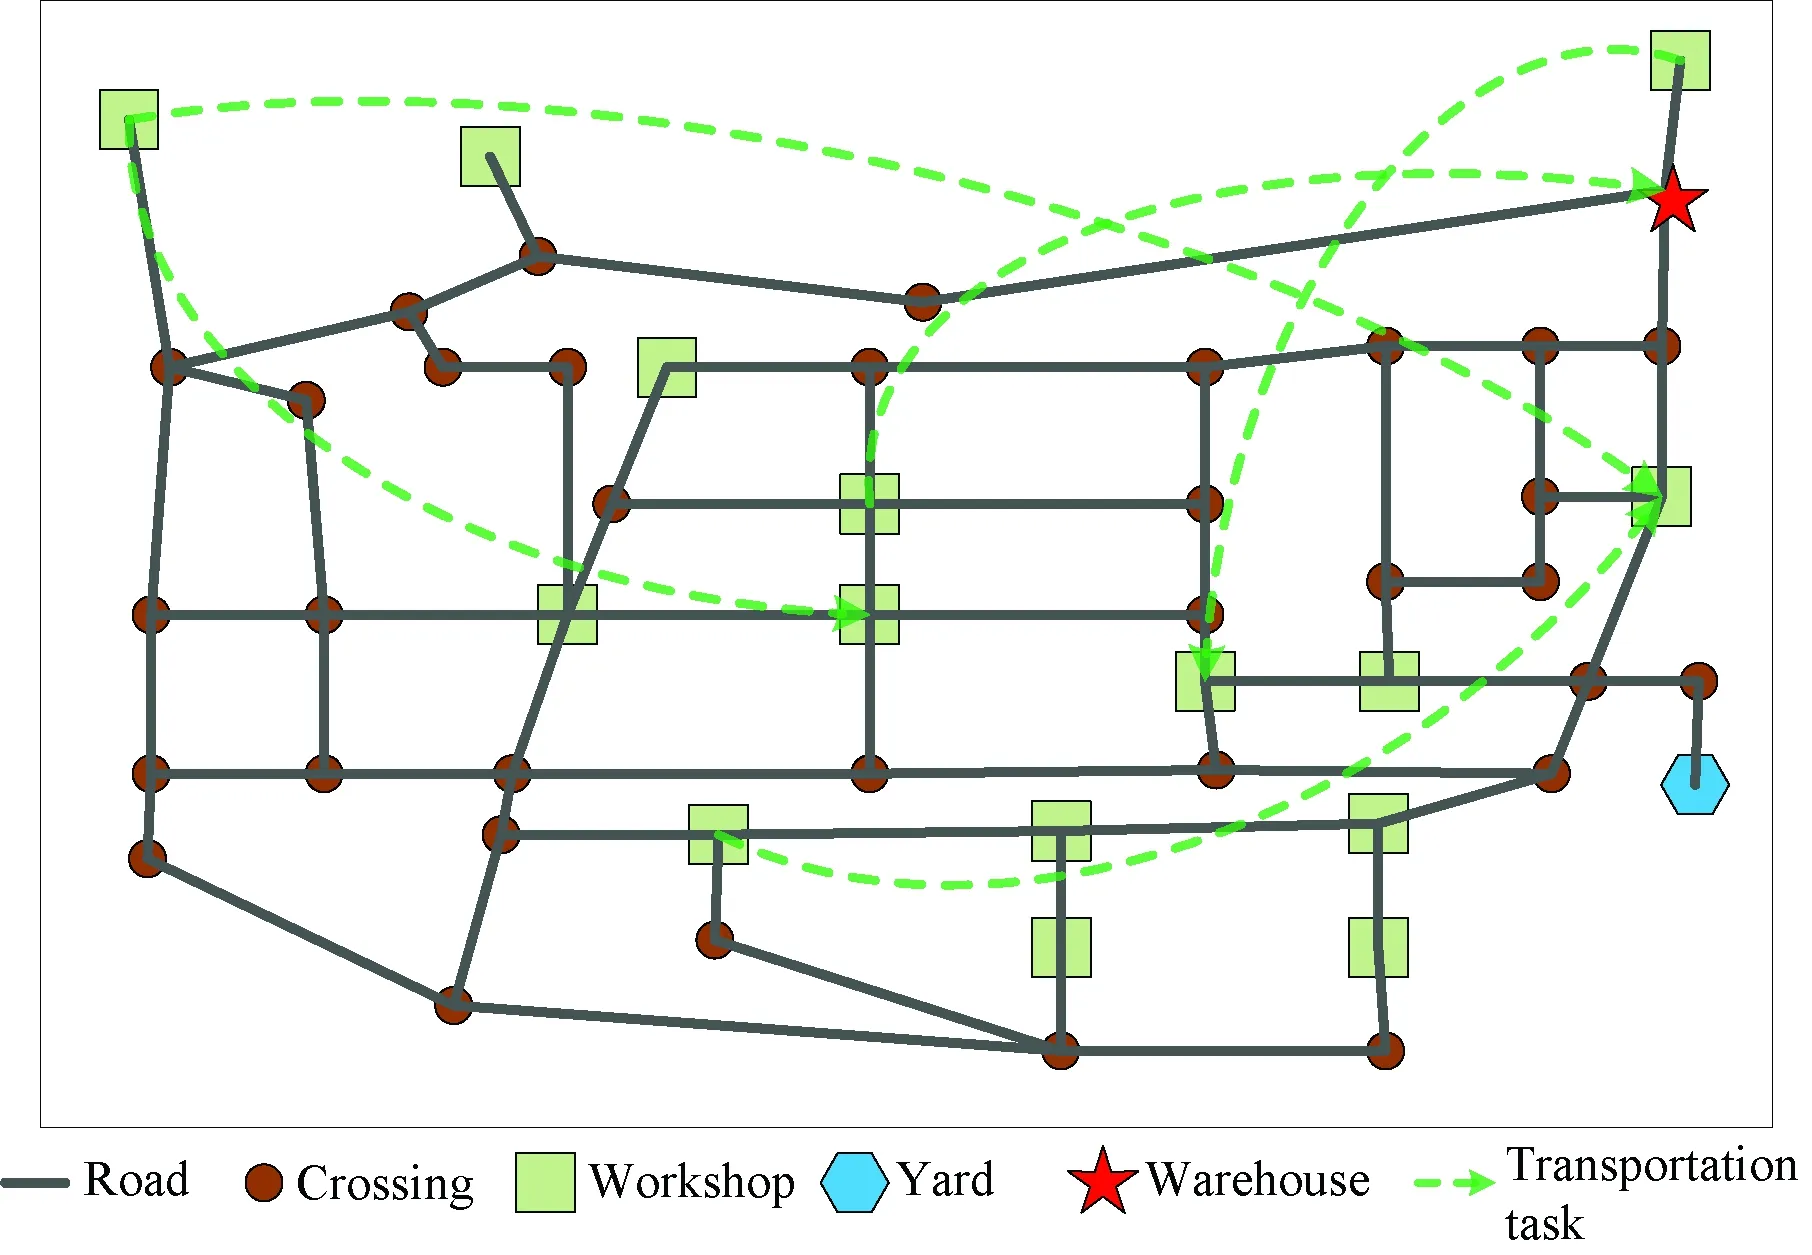
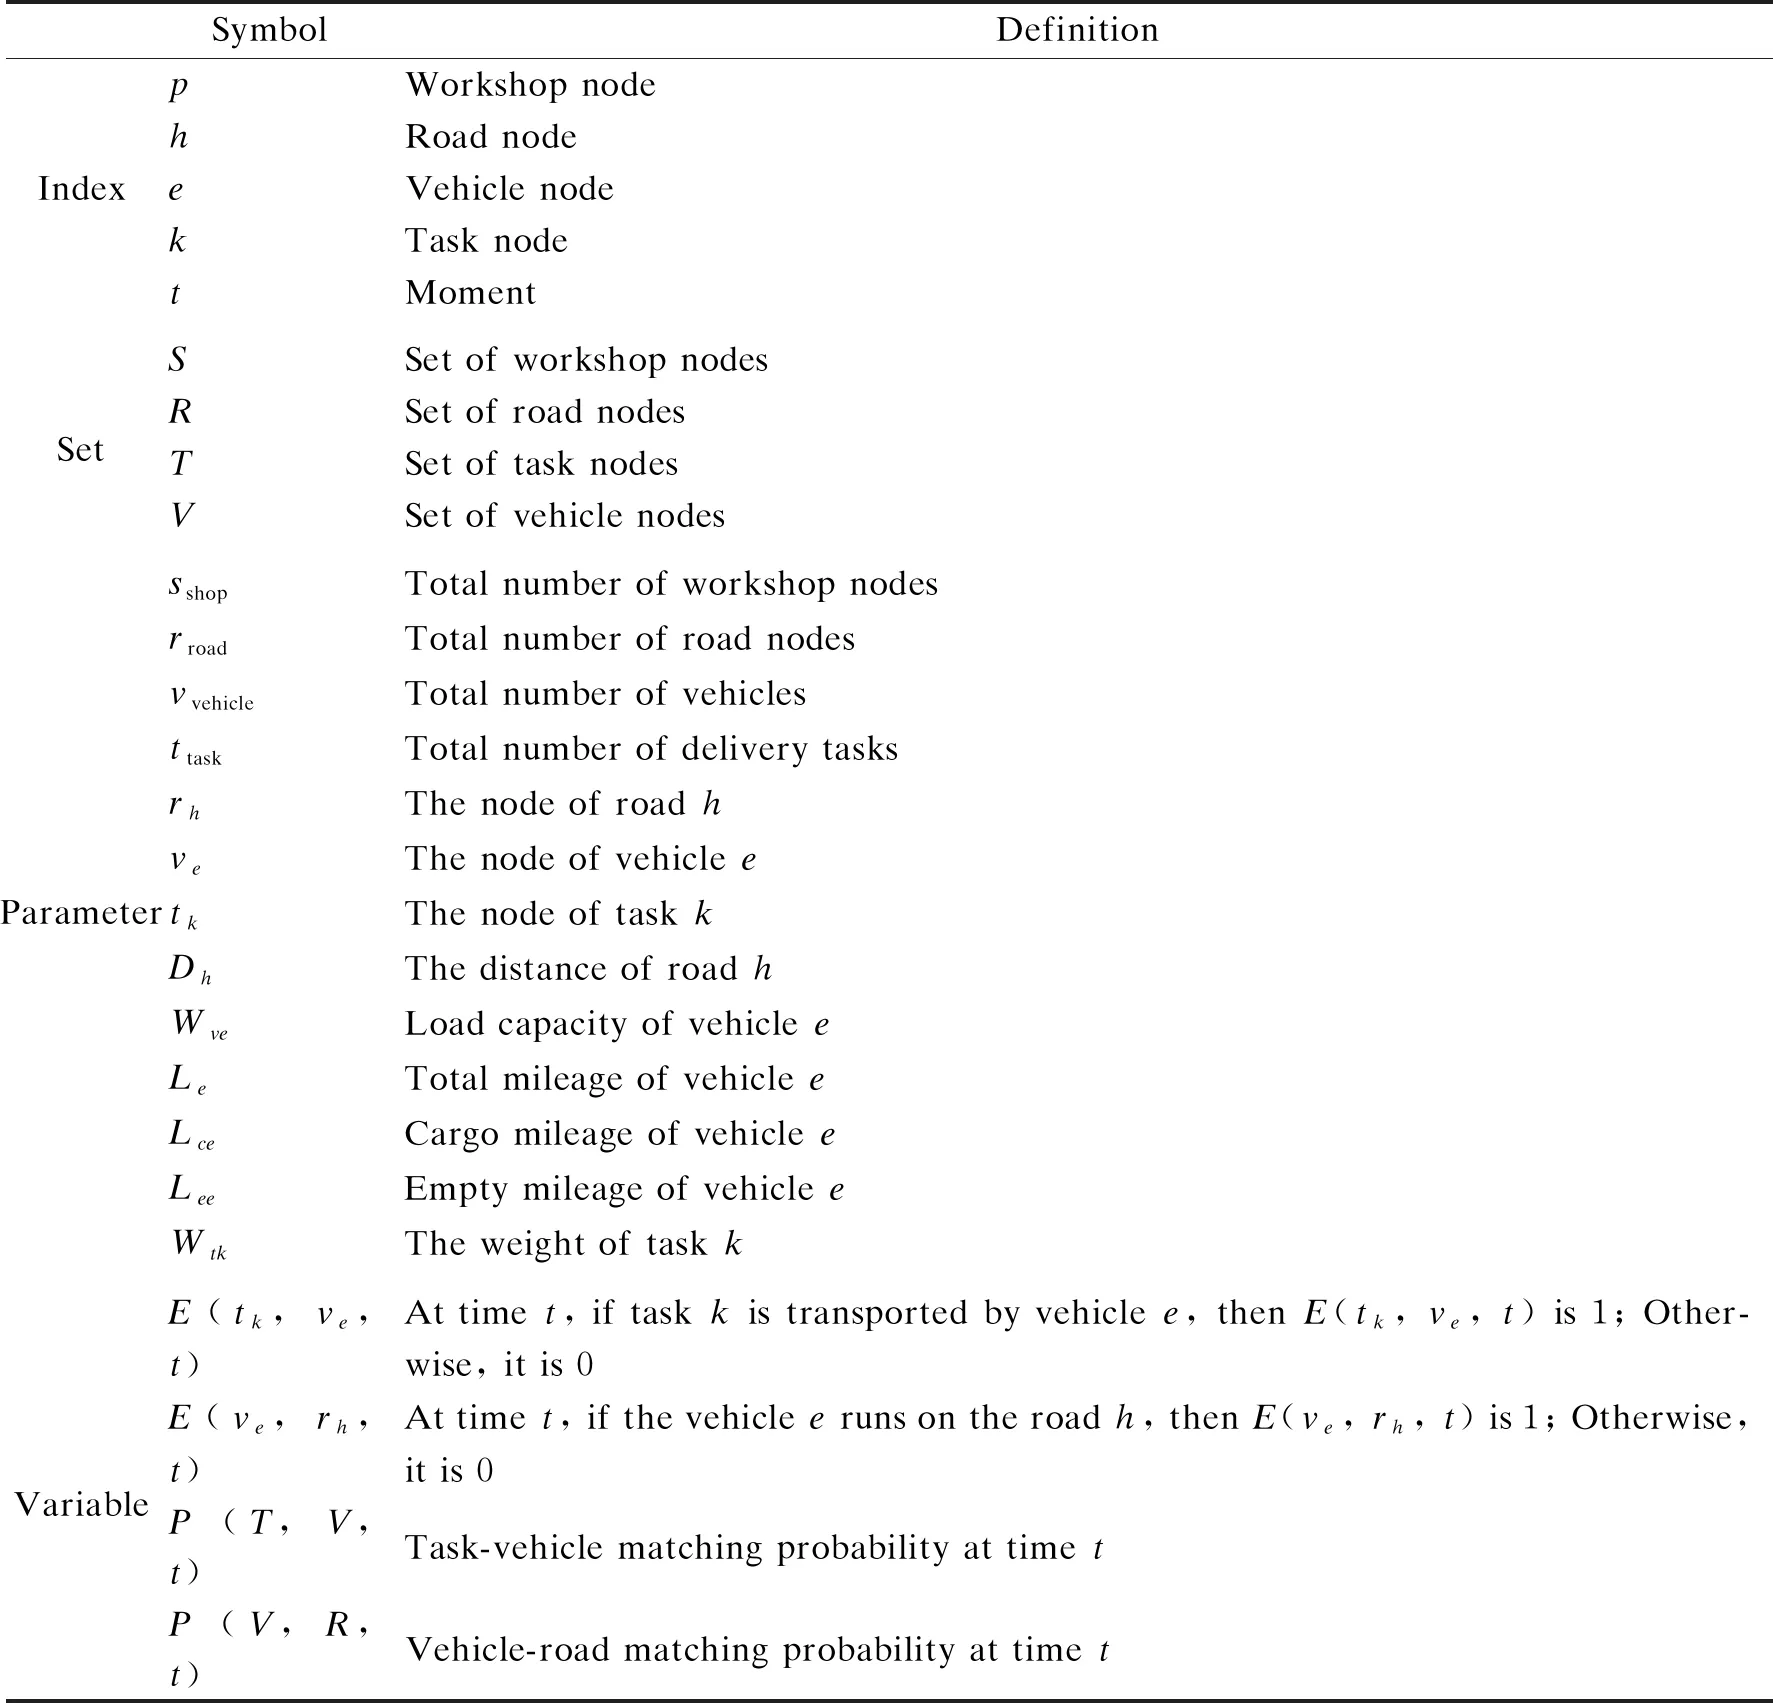
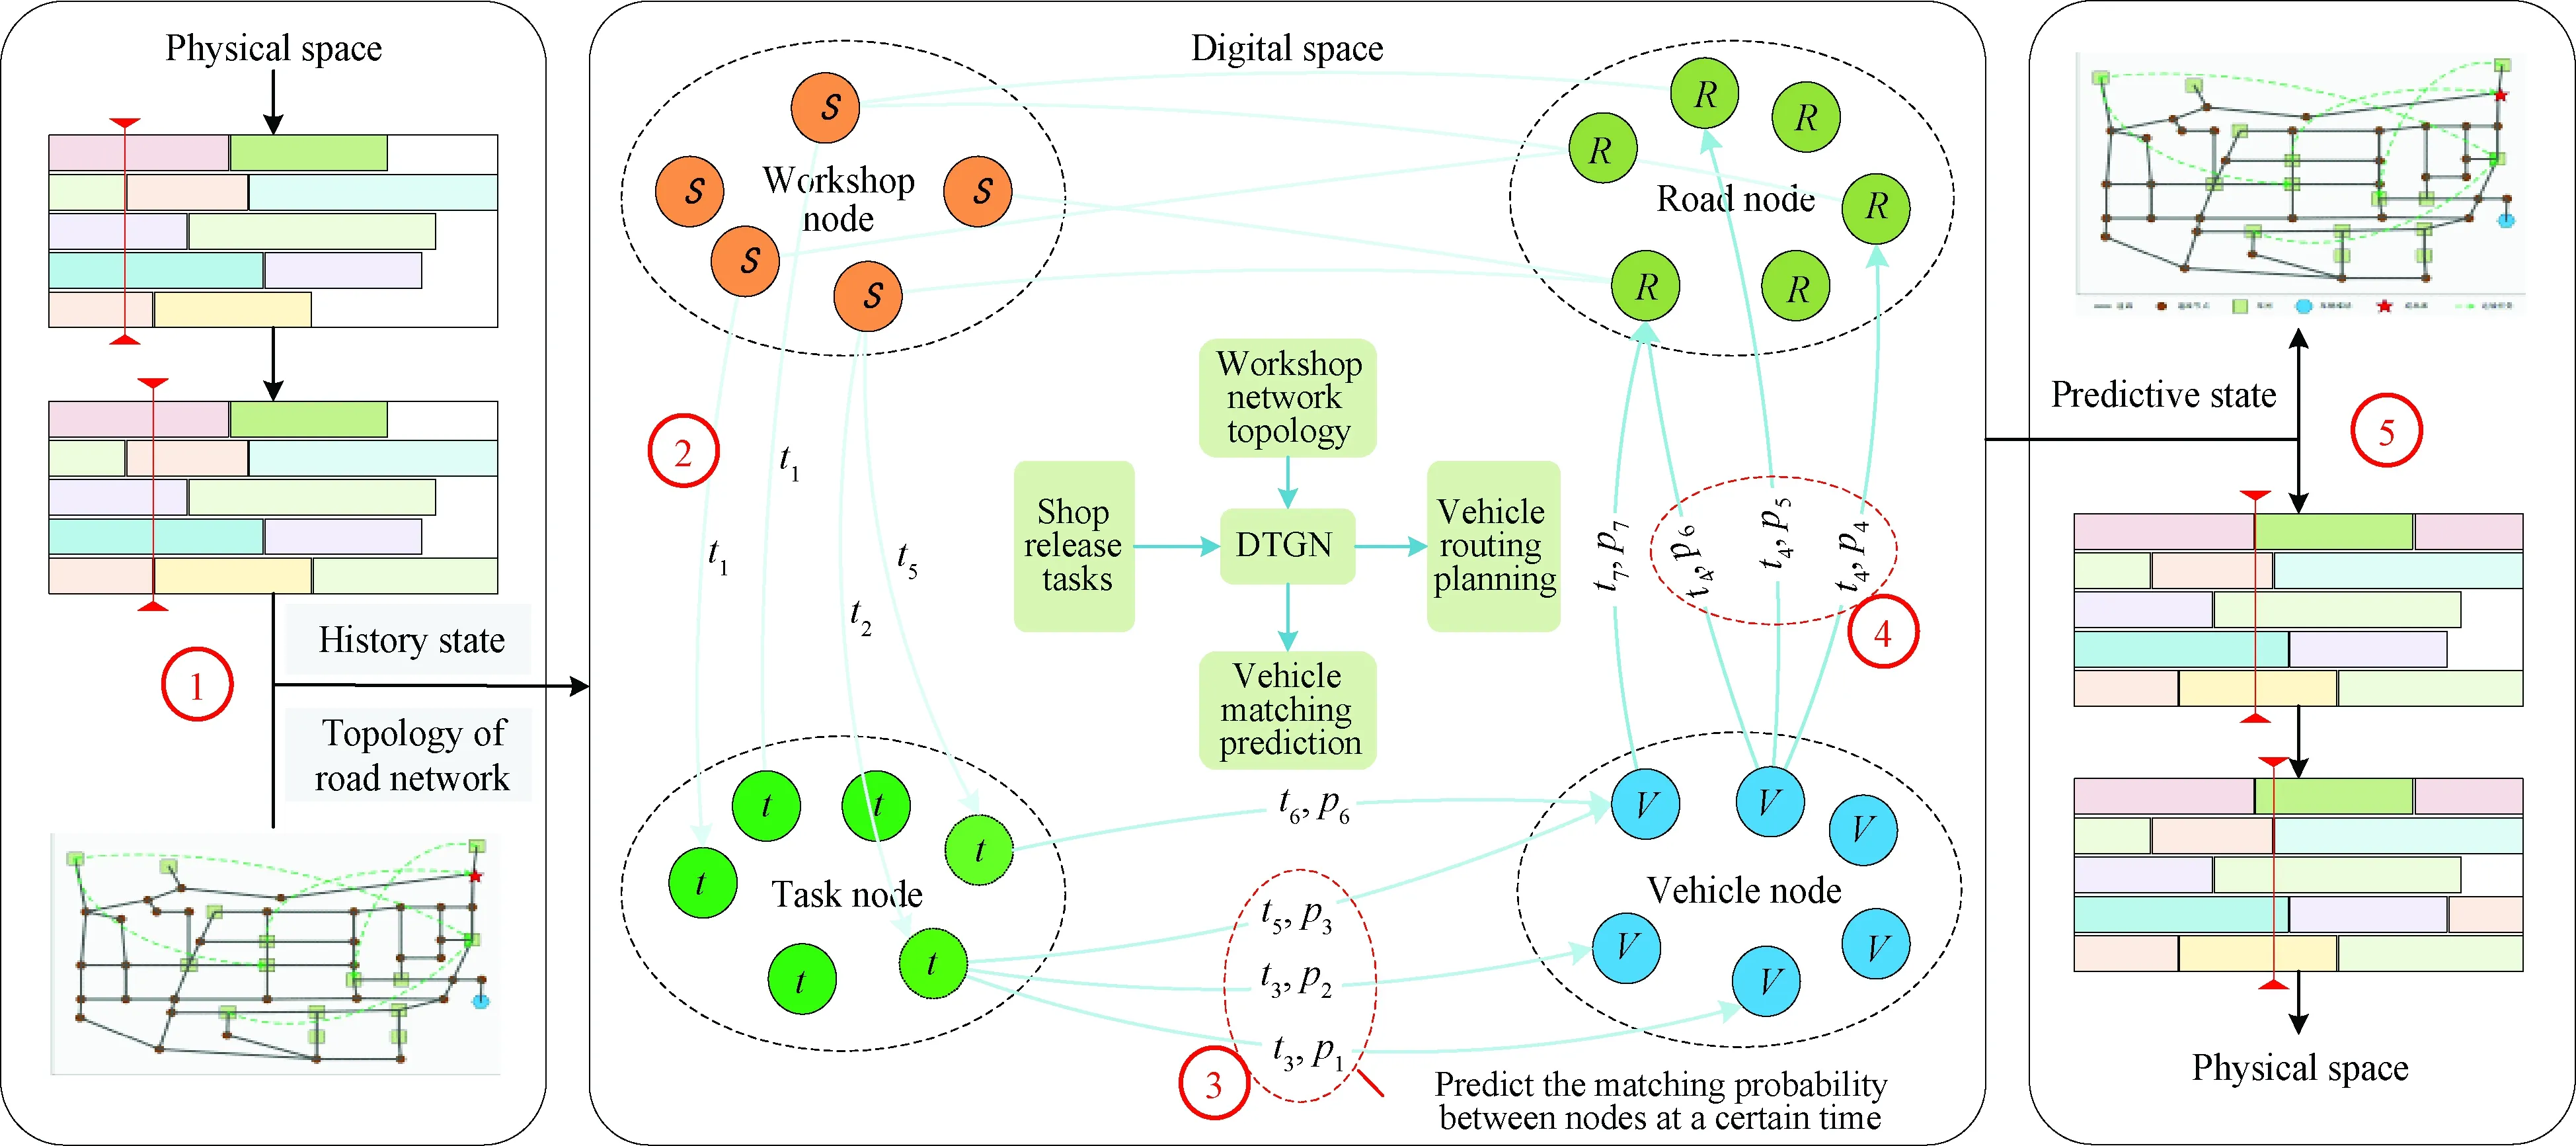
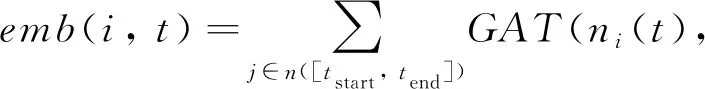
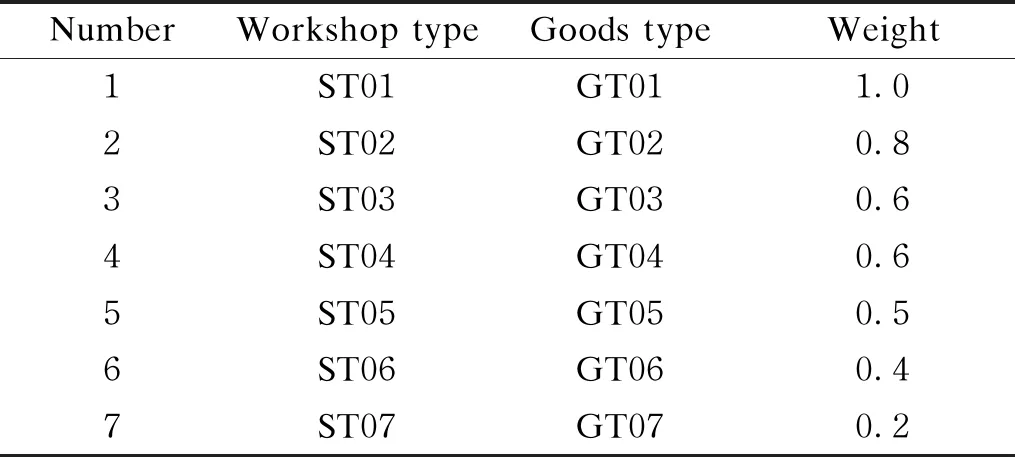
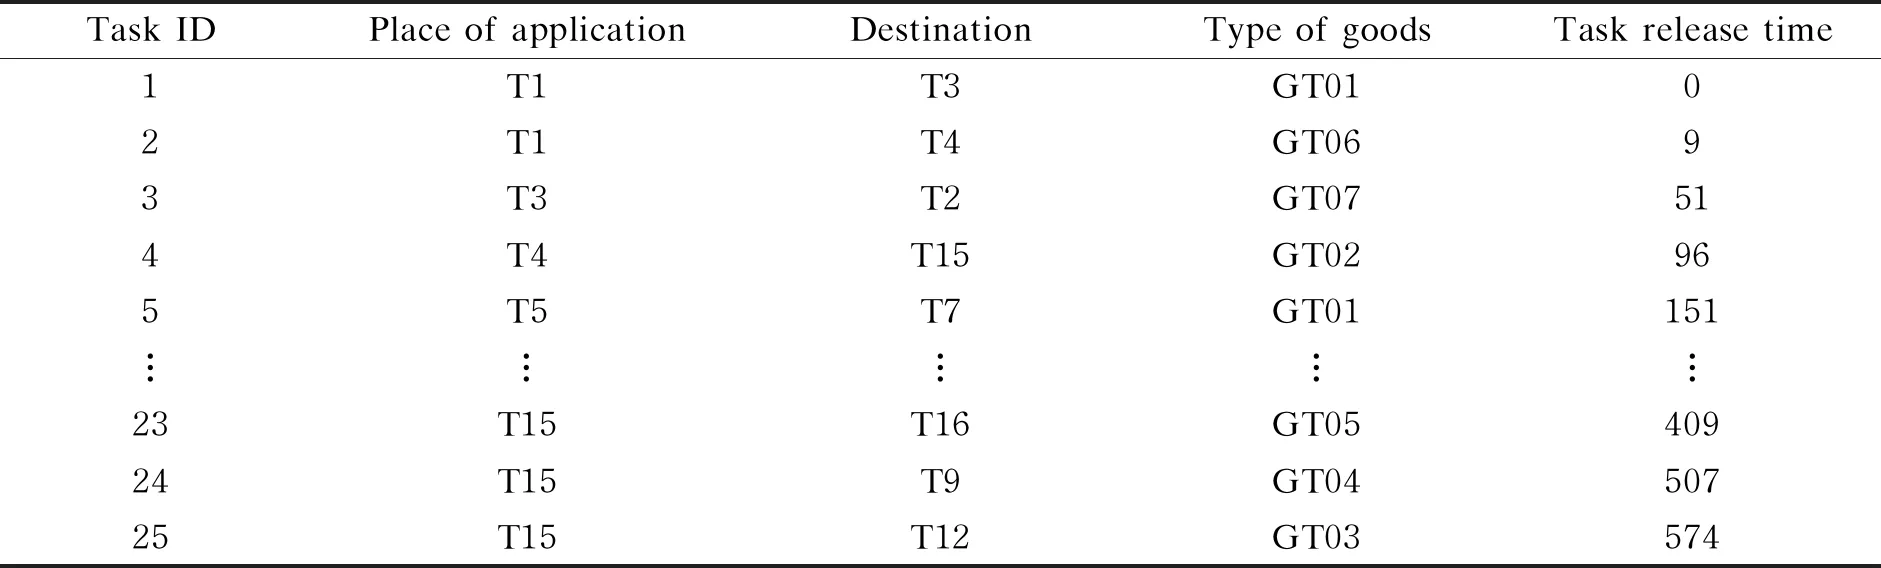
The sequence diagram is used to represent the collected logistics data. Logistics forecasting is time series analysis on the logistic map sequences of problems, including the addition or deletion of relationships such as distribution and driving, the addition or deletion of task nodes, and the prediction of feature transformation of nodes or relationships. This paper will get logistics data time series {X1,X2, …,Xt, 0 Digital space provides a model base for the production logistics DT system to describe the generated logistics process and control the distribution process. The production logistics process was described digitally by the network topology, the temporal graph network, and the prediction model, and the DT model was formed driven by dynamic tasks. Based on the above model, task matching and vehicle route selection are carried out in the logistics process. The solution to scheduling problems is often time-consuming and laborious, and the solution obtained by an ordinary optimization algorithm cannot be directly applied to practical engineering problems, and the influencing factors considered are too abstract. Because DT can provide the whole process and the whole factor information of the logistics process, this paper proposes the method of a temporal graph to describe the process, and the core of the problem is how to reveal the spatio-temporal correlation in transportation data. In the DT of logistics vehicle scheduling, the connection between physical space and digital space is established through virtual reality interaction. The steps of virtual reality interaction are as follows. Firstly, various logistics data in physical space are acquired. Real-time logistics data is the basis to realize the interaction between physical space and digital space. Logistics data can be collected through radio frequency identification (RFID), surveillance cameras, Internet of Things and sensor networks. Secondly, the logistics data between physical space and digital space can be synchronized by establishing data transfer protocol. Finally, to express the spatio-temporal property of logistics-related entities in more detail, this paper presents the logistics data with a graph network. The temporal graph network is used to store and analyze the data in digital space. By analyzing the dynamic events in the logistics process, the scheduling strategy is used to adjust and update the logistics scheme. In the temporal graph, vehicles, roads, workshops, and tasks are mapped as nodes, and relationships between entities are mapped as edges. The node information is shown in Table 1, and the edge information is shown in Table 2. Table 1 Information of nodes Table 2 Information of edges As shown in Fig. 2, the dynamic process of logistics can be represented by a temporal graph.Sis the workshop or warehouse,Ris the internal transport road of the factory,Vis the transport of engineering vehicles, andTis the dynamic generation task. If there is a corresponding relationship between the two entities, namely related events, there will be an edge. Fig. 2 Logistic transportation scheduling temporal graph network Production logistics is responsible for the integration and transfer of goods in the production base (such as raw materials, fuels, finished products, and waste), and plays a key role in connecting the preceding and the following in the factory base. The operation scheduling of engineering vehicles involves many persons, many vehicles, wide area, and complex distribution tasks. Engineering vehicles need to deliver materials to the workshop in time and transfer the finished products to avoid occupying inventory and affecting the takt time. Therefore, the operation scheduling of engineering vehicles is a link with high risk. To effectively arrange and dispatch all kinds of distribution tasks and transportation resources is the main research point of improving production logistics distribution in factories. Because the number of logistics engineering vehicles in the factory can reach thousands, and the flow momentum and flow distance of resources are relatively large, this paper mainly considers the scheduling strategy research of multiple transportation engineering vehicles in a limited range. In conclusion, the production logistics scheduling problem can be described as: in a production cycle, there are multiple transportation tasks dynamically generated, which need to be transported by engineering vehicles. Based on relevant constraints, transport tasks are assigned, and route planning is performed. The transportation vehicle is as far as possible to achieve the transportation optimization goal. In order to solve the optimization problem of engineering vehicle job scheduling, the following assumptions are considered. (1)The road planning map in the factory is known, including each distribution application point, distribution destination, and parking area of engineering vehicles. (2)Quantities, types, loading capacities, and speed limits of transportation resources in the factory are known. (3)Except for the speed control, the operation of construction vehicle drivers shall be subject to subjective operation, and other operations shall conform to the operation specifications of drivers stipulated by the factory. (4)The maximum mileage limit for transport vehicles is not considered. (5)The loading and unloading time of materials are not considered. (6)For the delivery task, the next task can be directly executed after the completion of a single task. (7)The distribution task is the smallest unit, which is no longer divided, and only one engineering vehicle is needed for transportation. On the premise that the above assumptions of the model are established, relevant definitions and mathematical models of engineering vehicle job scheduling are established as follows. Definition1Driving maps.G=(S,R) represents the road network topology in the factory, whereS={1, 2, …,sshop} represents the workshop set, andR={1, 2, …,rroad} represents the road sections between nodes, as shown in Fig. 3. Fig. 3 Road network diagram inside plant Definition2Transport vehicles. The set of existing transport vehicles isV={1, 2, …,vveshicle}, and each car has a corresponding average speed, an average load, and other attributes. Definition3Distribution tasks. The set of the existing distribution task isT= {1, 2, …,ttask}. The set of the request point isA= {1, 2, …,a} ⊆S. The set of the destination point isB= {1, 2, …,b}⊆S. The request points and the destination points have mapping relationships according to the distribution request. Each delivery task has corresponding delivery requirements, such as cargo weights and volumes. To facilitate description, parameters and symbols are defined in Table 3. Table 3 Definition of related parameters and symbols In the defined logistic graph sequenceXt, the job scheduling problem of multiple delivery pickup, unloading points and multiple engineering vehicles has multiple targetsfand multiple constraintsg. Therefore, the problem can be described as optFt=optff(f1,f2, …,fn)=optfv(St,Rt,Vt,Tt,Et,t), (1) s.t. gcons(St,Rt,Vt,Tt,Et,t)≤0,cons=1, 2, …,l. (2) Equation (1) represents the optimization objective. In the time range (tstart,tend), the whole logistics processFtneeds to be optimized. {f1,f2, …,fn} represents different optimization objective functions, andffrepresents the relationship function between these optimization objective functions. Each of the optimization objective functions is related to the basic logistics elements or decision variables {St,Rt,Vt,Tt,Et}, andfvrepresents the relationship function between these elements.Strepresents the change of workshop nodes with timet, including the progress of order task completion;Rtrepresents the change of road nodes with timet, including whether the road is usable;Vtrepresents the change of vehicle nodes with timet, including speeds, transportation tasks, and transportation routes;Ttrepresents the change of task nodes with timet, including the change of generation time of the workshop transport task;Etrepresents the change of the connection relationship between nodes with timet. Constraint (2) means that there arelconstraints, and they are all related to {St,Rt,Vt,Tt,Et}. To illustrate the problem, the following examples are given. The objective is to minimize the empty driving mileage of the used engineering vehicles and to balance the use of the dispatched engineering vehicles. (3) (4) (5) s.t. (6) (7) (8) (9) (10) Equation (3) represents the minimum empty driving mileage of engineering vehicles used in the distribution process. Equation (4) represents the balanced use of all logistics equipment involved in dispatching. Equation (5) represents the cargo mileage of vehiclee. Constraint (6) refers to the load constraint of each vehicle when the vehicle loads goods. Equation (7) indicates that each transport vehicle can only perform one task at a time, and only when the state is idle can the next job scheduling be performed. Equation (8) indicates that each delivery task is assigned to only one vehicle and can only be assigned once. Constraint (9) refers to the constraint of the number of vehicles in the job scheduling, and the number of vehicles in the job should be less than or equal to the total number of vehicles. Equation (10) indicates that engineering vehicles entering nodeiof the road network must leave from this node. As this problem is a nonlinear integer programming problem and a time-sequence related dynamic problem, it is difficult to solve by traditional methods when optimization objectives, problem constraints, and data volume increase. Therefore, this paper adopts the temporal graph network method to describe and solve the problem. To solve the scheduling problem of multiple vehicles in the dynamic environment, and to be able to adjust the logistics and transportation strategy adaptively in the dynamic environment, it is necessary to monitor the running status and task changes of transport vehicles in real-time, and provide real-time data support for the digital space. Combined with the road network topology, the constraints of task requirements, and the feedback data of the physical space, the logistics process can be adjusted in a timely manner. After getting data from physical space, logistics transportation is analyzed from spatial correlation and temporal correlation. 3.1.1Spatialcorrelation Because the production scope of enterprises is relatively closed and the spatial layout is relatively fixed, the change of logistics vehicle transportation path is mainly affected by the distribution of workshops and the topology of transportation roads. Because of the different locations of the road, the frequency of use is different. The road near the production workshop or the main road is used more frequently, while some peripheral routes are shared by the main road when the task is heavy. When each transport vehicle runs on the public route, there will be the phenomenon of resource competition, which will interfere with each other and jam the traffic condition, so it is necessary to allocate the transport route reasonably in space. 3.1.2Temporalcorrelation The amount of transportation tasks changes dynamically with time. Because workshop production has a production beat and the production cycle of each workshop is relatively fixed, the transportation tasks are also periodic, and the tasks are similar in each production cycle. Each workshop task affects the production status of other workshops through the transfer effect. There is a time window in the transportation process of each task. The arrival time of producing goods in the upstream workshop directly affects the production efficiency of the downstream workshop. To realize the dynamic adjustment of job scheduling, there will inevitably be all kinds of emergencies in the process of vehicle scheduling, such as new distribution tasks that need to be processed by inserting orders. Due to various reasons, such as urgent orders and vehicle faults, the scheduled distribution task cannot be executed normally, and the job scheduling of this task needs to be re-arranged. Tasks that are being executed or not executed cannot be executed normally due to vehicle failure. In the process of operation, due to the road condition, a section of road may not be passed normally, so it is necessary to re-plan the path. Due to manual operation, the vehicle fails to drive on the specified route, and the optimal route needs to be re-established after discovery. Given the above problems, this paper divides the time into multiple stages according to the sequence of events, and adopts the method of multi-stage prediction to minimize the impact of disturbances on production logistics. 3.1.3Multi-stageprediction In the production logistics scheduling process, the process can be divided into several interrelated stages according to the sequence of events. Prediction is required at each stage for the entire logistics process to achieve optimal optimization goals. The logistics process is divided intorstages according to the sequence of events, and the statesrrepresents the situation at the beginning of each stage. The specific decision-making process is shown in the pseudo-code of Algorithm 1 in Fig. 4. Fig. 4 Algorithm 1: multi-stage prediction process Traditional path optimization algorithms only calculate the shortest path distance between the start nodes and end nodes in the graph, and usually do not consider other information about paths, vehicles, and tasks. However, a temporal graph network can be embedded with the information of nodes and edge relationships, and a continuous-time dynamic graph can be represented as a list of events, which may include edge relationship addition or deletion, entity node addition or deletion, and node or edge feature transformation. Therefore, the temporal graph network can be used to carry out deep learning on the temporal graph which takes the time series of event occurrence as node relationships in transportation process. Combining the temporal graph network model and DT technology, this paper designs a DTGN prediction method to solve task assignment and path planning problems in DT logistics scheduling environment. The network prediction process of production logistics spatio-temporal graph network in the DT environment is shown in Fig. 5. The first step is to obtain the historical scheduling data and network topology in the DT environment. The second step is to obtain the arrival time of new taskTnewunder real-time mapping. The third step is to predict the probability of new taskTnewgenerating transport link relationship with each transport vehicle at a certain time by using a temporal graph network model. The fourth step is to predict the probability of driving link relationships between the vehicle and each road at a certain time after the vehicle is determined by transport probability, and select the road with the highest probability. The fifth step is to use the output information to predict the scheduling state. Fig. 5 Production logistics spatio-temporal graph network prediction based on DT Fig. 6 Training and prediction processes of DTGN The specific prediction method is that the graph neural network model is regarded as a pair of encoder-decoder, and the temporal graph network generated in the digital space is mapped to nodes through the encoder. The decoder takes the workshop-road-vehicle-task node and the definite moment as the input and predicts the link probability between nodes. In this paper, the temporal graph network proposed in Ref. [25] is used as the encoder. In the actual logistics transportation process, logistics transportation events are defined as a continuous-time dynamic graph, and the method of link prediction is adopted to predict the occurrence time and probability of future interactive events based on the observed process of logistics interaction events in the past in the logistics spatio-temporal graph. Figure 6 shows training and prediction processes of DTGN. The following is a detailed description of the DTGN components. (1)DT environment. On the one hand, the environment is to provide historical scheduling data, road network topology, and other data, and build the temporal graph network for training after data pretreatment. On the other hand, the link relationship predicted by the spatio-temporal relationship prediction model is transformed into the actual transport control instructions to control vehicle transport operations. (2)Store scheduling raw message. The state of all entity nodes (workshops, roads, vehicles, and tasks) in the digital space before timetis represented by vectorn(t).When an event occurs, the nodes corresponding will be updated, and using this module can retain the long-term spatio-temporal relationship of each node. (3)Message function. When interactive events (loading, unloading,etc.) occur between source nodeniand target nodenjin the logistics entity at timet, two messagesmiandmjabout the two nodes can be calculated by Eqs. (11) and (12). The information function is trained by multi-layer perceptronMLP. mi(t)=MLPs(ni(t-),nj(t-), Δt,E(ni,nj,t)). (11) mj(t)=MLPd(nj(t-),ni(t-), Δt,E(ni,nj,t)). (12) (4)Message aggregation. Because the same entity node may involve multiple events in the same period, for example, the same road may carry several cars at the same time, this paper usesmeanfunction to aggregate message in the period oft∈(tstart,tend). (13) (5)Memory update. Each event involving the node itself will update the memoryni(t) of the node, and the gated recurrent unitGRUis used as the memory update function. (14) (6)Embedding. The embedding module is used to generate the temporal embeddingzi(t) of nodeiat timet. The main goal of the embedded module is to avoid the so-called memory obsolescence problem and use the graph attention networkGATto embed operations. nj(t),E(ni,nj,t)). (15) After the above steps, the information of the predicted vehicle scheduling state can be obtained, that is, the matching probability between each node (task-vehicle, vehicle-road,etc.) at a certain time. If multiple transport vehicles have matching probability with taskTat timet, the selected vehicle isV=V(index (max(P1,P2,P3)).Thus, the matching relationship between different tasks, vehicles, and roads at different times can be obtained to guide the production logistics activities of manufacturing enterprises. The DT-driven engineering vehicle job scheduling framework described in this paper is applied to a steel factory in Shanghai, China. Iron and steel production process is the ferrous metal smelting and processing of industrial production activities. Raw materials include metal iron, chromium, manganese and other minerals. The production activities also need to transport fuel to provide energy, recycle waste, middleware produced in upstream workshops,etc. Production logistics refers to the transportation of raw materials, fuel, middleware, steel slag, scrap,etc. The process of material transportation in steel production can be described as follows. In the plant, there are multiple workshop units, multiple storage units, and a transportation yard. The engineering vehicle dispatching management center arranges the dispatching of engineering vehicles, and organizes and arranges multiple vehicles to collect goods from multiple distribution application workshops at the same time. The engineering vehicles will send the goods to the corresponding yard or other process workshop within the specified time according to the distribution request and scheduling arrangement. After finishing the delivery request, each engineering vehicle shall continue to perform the task according to the task arrangement or park in the nearby engineering vehicle parking area waiting for the next task deployment. The job scheduling of engineering vehicles is the process of allocating resources reasonably, optimizing distribution routes and completing distribution tasks efficiently. Since the workshops of the factory are scattered, and vehicles are mainly used to distribute materials, the rational use of engineering vehicles is an important part of ensuring the normal production of steel. In this paper, the actual production situation of the enterprise is investigated, combined with the actual production historical data of the factory and the simulation data in the test. According to the content mentioned above, the DT management platform as shown in Fig. 7 is constructed, which mainly provides data services for the entire vehicle scheduling process, including map information storage, vehicle information storage, task information release, and scheduling algorithm service integration. Firstly, the temporal graph network of logistics scheduling is established according to the transportation tasks of different workshops. Nodes store resource information and side stores transportation relationship information. Then, logistics scheduling strategy is used for task assignment. Finally, the temporal graph network is updated by feedback of entity node information. In the process of information iteration update, the optimization control of logistics vehicle transportation task is realized. Fig. 7 DT management platform The partial layout of the factory is shown in Fig.8(a). This area contains 16 workshop-level units and multiple storage units, including wharfs, power plants, blast furnaces, steel works, and warehouses. According to the actual transportation distance between each unit, the virtual simulation model shown in Fig.8 (b) is established to conduct simulation tests on the actual factory and generate virtual data. The experimental platform is implemented by Python language, and the experimental environment is Intel(R) Core(TM) i5 CPU, RAM 8 G, and Windows 10 operating system. Fig. 8 Factory layout: (a)physical space; (b)virtual space Fig. 9 Graph network representation of two vehicles 4.1.1Logisticssampledata Based on the investigation of historical production data and transportation scheduling experience of enterprises, the following methods are determined to generate workshop-task data sets, task-vehicle matching data sets and vehicle-routing planning data sets. The specific settings of three types of data in this experiment are as follows. (1)Workshop-task data sets. Different workshops produce different tasks, which are reflected in goods types, weight, volume, distribution requirements,etc. In this paper, goods types and weight are selected for experimental settings, as shown in Table 4. ST01 to ST07 represent workshop types, and GT01 to GT07 represent goods types. To ensure the standardization of model input, the weight is normalized, and the transportation task is uniformly coded according to the time of task occurrence. Table 4 Workshop-task data sets (2)Task-vehicle matching data sets. The transportation process of enterprises relies on human experience to direct vehicles. Table 5 shows the heuristic rules to simulate human experience. The earliest task release time rule, the proximity principle rule, and the genetic algorithm (GA) are selected to produce different task-vehicle matching data sets. Table 5 Logistics task transport rules (3)Vehicle-routing planning data sets. Because the locations of workshops and roads are fixed and the quantity is known, the transportation road selection of goods transshipment between workshops remains basically unchanged, that is, the shortest path is basically determined, so Dijkstra method is used to select the shortest path every time. The experimental data sets above are used to simulate the historical production process of the enterprise, and is applied to train and test the temporal graph network model, so as to realize the probability prediction of the occurrence of links between two entity nodes in a given time in the future enterprise transportation graph network. Figure 9 shows the graph network to represent the status of two vehicles in the DT management platform. 4.1.2Experimentalparameters A temporal graph prediction network based on the DT is built by using Python language and neural network algorithm library such as Pytorch. Module parameters are listed in Table 6 below. Table 6 Parameters of each module Graph network algorithm in different problem scenarios, and different hyperparameters, such as training periods and batch sizes, has a great influence on the training speed and experimental results. Experiments are done to verify that the prediction model is fast and accurate. Because the batch size has a great influence on the training speed and the algorithm memory update, and directly affects the convergence speed and the prediction accuracy of the model, this paper determines the batch size through the following experiments. Because the large batch size leads to a slow training speed, while the small batch size easily leads to the low prediction accuracy of the model, this experiment selects five batch sizes {50, 100, 150, 200, 250} as test values and selects the best value. Figure 10 shows the curve of the loss of the training set for 100 iterations and the convergence of the average accuracy on the test set with the number of iterations, showing the influence of different batch sizes on the loss and the accuracy. According to Fig. 10 and the actual training process, when the batch size is 100, the model training speed is fast and the accuracy on the test set is high, reaching 99.2%. Fig. 10 Effect of batch size: (a) loss of training set; (b) average accuracy of test set According to the actual production and the manufacturing situation, a variety of task data was designed to test the model concerning the task delivery request of the selected factory in a certain period. The detailed task information is shown in Table 7. The spatio-temporal analysis method based on the DT proposed in this paper was used to assign the transport task to five transport vehicles. In the constructed virtual experimental environment, the batch size is 100, experimental parameters are shown in Table 6, a temporal graph network model of 200 generations is trained as the decision core, and FIFO and GA algorithms of scheduling rules are selected as the control group. GA is aimed at minimizing the empty driving mileage of engineering vehicles and balancing the use of engineering vehicles participating in dispatching. The validity of the proposed spatio-temporal graph network analysis method for production logistics DT system is verified. Empty driving mileageLee, empty driving rateαand equilibrium standard deviationβof each vehicle are measured.αandβare defined by Eqs. (16) and (17). Table 7 Information of tasks (16) (17) As can be seen from Table 8, compared with the rules, DTGN can effectively reduce empty driving mileages and balance vehicle loads. However, the selection of transportation rules and the delivery of transportation instructions are relatively simple and can be completed manually. Compared with GA, DTGN reduces less empty driving mileages and has a poor equalization effect. However, it can complete the training process offline and give transportation instructions quickly in the production process. When the transportation process continues and the amount of data increases, GA becomes slower to solve, which is more conducive to training and prediction of DTGN. In addition, due to the reduction of total travel, the empty driving rate after GA and DTGN optimization increases. Table 8 Comparison of DTGN with other scheduling methods This paper studies and analyzes the production logistics distribution process based on the DT using the spatio-temporal graph network and solves the problem of link relationship prediction in the logistics process. Its main contributions are as follows. (1) A DT-driven engineering vehicle job scheduling framework is proposed to describe the logistics process in the way of a sequence diagram, and a dynamic job scheduling process is established in the digital space. (2) Considering various constraints in the process of job scheduling, a mathematical model of the engineering vehicle job scheduling is established with the minimum empty driving mileage and the balanced use of dispatching vehicles as the optimization objective. (3) The temporal graph network model is established by using the historical scheduling data in the DT and the network topology structure. The spatio-temporal analysis of the historical data of logistics is carried out, and the DTGN algorithm is used to train the prediction model. When there is task input, the multi-stage prediction of the workshop-road-vehicle-task link relationship in the physical space is carried out. It can cooperate with the field dispatch personnel to issue transport instructions and achieve the reasonable scheduling of roads, vehicles, and tasks. The logistics distribution of a steel manufacturing enterprise is taken as an example to verify the feasibility of the method. There are still some deficiencies. The high-fidelity logistics transportation model has not been completely established, and only some constraints and optimization objectives are selected according to the actual situation. The scheduling experience and historical data collection have a great influence on the optimization performance of the training model. When the logistics environment changes, the model cannot adapt quickly. Given the above problems, the future research directions are as follows: for the more complex distribution environment, more diversified optimization objective functions are chosen to make the model prediction effect more in line with the needs of enterprises; reinforcement learning related content is introduced to optimize the data of the training model so that the effect of the trained prediction model is closer to the optimization goal; transfer learning related content is introduced to adjust the prediction model with the change of transportation scenarios and enhance generalization performance.1.2 Digital space
1.3 Vehicle scheduling DT data representation


2 Vehicle Job Scheduling Mathematical Model
2.1 Problem description
2.2 Mathematical model

3 Logistics Scheduling Strategy Based on DT
3.1 Spatio-temporal analysis and multi-stage prediction

3.2 Temporal graph network prediction method based on DT
4 Case Analysis


4.1 Experimental settings


4.2 Determination of training batch size


4.3 Validity verification of the method

5 Conclusions
猜你喜欢
电影文学(2022年8期)2022-05-24
故事会(2022年7期)2022-04-03
小小说月刊(2022年1期)2022-02-07
山东陶瓷(2021年5期)2022-01-17
苏州工艺美术职业技术学院学报(2020年1期)2020-07-20
疯狂英语·读写版(2019年4期)2019-09-10
时代邮刊(2019年20期)2019-07-30
High Technology Letters(2017年3期)2017-09-25
Chinese Physics B(2017年9期)2017-08-30
武大国际法评论(2017年5期)2017-05-29
 Journal of Donghua University(English Edition)2022年5期
- Journal of Donghua University(English Edition)的其它文章
- Preparation of Hydrophilic and Shrink-Proofing Wool Fabrics Through Thiol-Ene Click Chemistry Reaction
- Performance of Array-Type Noncontact End Gripper Based on Coanda Mechanism for Gripping Garment Fabrics
- Expression and Purification of Serine/Arginine-Rich Splicing Factor 1 from Escherichia coli Expression System
- Navigation Method Based on Improved Rapid Exploration Random Tree Star-Smart (RRT*-Smart) and Deep Reinforcement Learning
- Residual Network with Enhanced Positional Attention and Global Prior for Clothing Parsing
- Research Status and Development Direction of Smart Clothing Materials