长江典型江段水体PAHs的分布特征、来源及其生态风险
2022-12-19 12:50杨梦茹王东红刘权震林利华王殿常陈永柏梁文艳
中国环境科学 2022年11期
杨梦茹,徐 雄,王东红,刘权震,吕 婧,林利华,王殿常,陈永柏,梁文艳
长江典型江段水体PAHs的分布特征、来源及其生态风险
杨梦茹1,2,徐 雄2*,王东红2,刘权震2,吕 婧2,林利华2,王殿常3,陈永柏3,梁文艳1**
(1.北京林业大学环境科学与工程学院,北京 100083;2.中国科学院生态环境研究中心,中国科学院饮用水科学与技术重点实验室,北京 100085;3.中国长江三峡集团有限公司,湖北 武汉 430014)
针对我国长江典型江段丰、平、枯不同时期的地表水,采用了固相萃取—气相色谱质谱联用(GC-MS)的分析技术,调查了16种优先控制多环芳烃(PAHs)的污染状况.研究了长江干流PAHs的污染水平和分布特征,并在定量分析的基础上评估了长江干流PAHs的来源和生态风险.结果显示,Σ16PAHs浓度范围为2.22~1450.91ng/L,均值为107.04ng/L,其中,平水期武汉江段Σ16PAHs浓度最高,均值为1050.64ng/L,长江干流PAHs污染状况与近5a国内其他水体相比处于中等偏低水平.空间分布上长江典型江段地表水中Σ16PAHs从上游攀枝花江段到下游南京江段呈现出先上升后下降的趋势;时间分布上Σ16PAHs的变化趋势为平水期(187.78ng/L)>丰水期(73.30ng/L)>枯水期(38.02ng/L).由同分异构比值法分析表明:在枯水期和平水期中,煤炭、生物质燃烧和石油源是长江干流PAHs的主要来源,而丰水期PAHs主要源于煤炭、生物质燃烧,其中南京江段PAHs的来源较为复杂.采用物种敏感性分布评估法对PAHs进行生态风险评估,结果显示长江典型江段地表水中PAHs尚未对水生生物造成显著的负面影响,与历史数据比对表明现阶段长江干流PAHs生态风险低于长江大保护政策实施前的生态风险.
长江干流;多环芳烃;生态风险评价
多环芳烃被联合国环境规划署(UNEP)列为管控类的持久性有机污染物.由于人类活动过程中燃料的不完全燃烧、车辆和船舶尾气排放以及工业废料的排放,使得大量的PAHs进入到各种环境介质中,不论在大气[1-2]还是土壤[3]、沉积物[4]等介质中均有PAHs被检出的研究报道,进而PAHs通过地表径流、大气沉降[5]、废水排放以及石油泄漏等方式最终进入到河流生态系统中,进入到河流生态系统中的PAHs一部分会溶解在水体中,另外一部分PAHs由于其高疏水性极易吸附于悬浮颗粒物表面并随着水流的迁移沉于底泥中[6],而处于底泥表层的PAHs随着水文等因素的扰动,PAHs会重新进入河流水体中,从而对水生态系统和人类健康造成潜在危害[7].
长江是中国的第一长河,城市经济的快速发展给长江带来了巨大的环境压力,在过去几十年里长江沿岸建设了30多家石油化工厂,导致大量的PAHs排放到河流中[8-10].因此人们对长江流域中PAHs的赋存特征进行了长期的监测和研究.Yang等[8]调查了2006~2017年长江地表水PAHs的污染状况,发现PAHs为长江主要的风险微污染物.由于水体受到严重污染,长江已被列入世界十大濒危河流名单中[9],因此引起了社会各阶层的广泛关注.2016年通过的《长江经济带发展规划纲要》[12]以及2017年开展的长江干流岸线保护和利用专项检查行动[13],坚持生态优先,绿色发展,共抓大保护、不搞大发展,督促各地推进涉嫌违法违规项目的整改.长江大保护政策实施期间,长江中游岸线PAHs污染状况(58.17ng/L)[14]低于长江大保护政策实施前的状况(2006年:2095.00ng/L[15];2007年:247.45ng/L[16]),同样南京江段也发现相同规律,2018年南京江段PAHs的浓度(208ng/L)[4]低于2004年和2015年南京PAHs的浓度(2004年:1511ng/L;2015年:12826ng/L)[17-18].这一系列的研究结果表明国家出台的一系列长江大保护政策和各种有效的控制手段,使得长江流域PAHs的污染程度有下降的趋势.
目前对于长江干流地表水中PAHs的浓度水平和分布状况的研究大都集中于部分江段,如重庆江段[19]、三峡江段[20]、武汉江段[21]、下游江段[22]等江段,而PAHs污染往往受到当地工业模式和人口密度的影响,长江大保护行动期间,PAHs在长江干流上的整体污染情况目前研究较少.尽管已有研究报道了2021年枯水期和丰水期长江流域重点江段PAHs的污染情况并评估了长江流域地表水中PAHs的健康风险[23],然而地表水中PAHs对水生生物的危害同样不容忽视,近年来长江流域干流地表水中PAHs对水生生物造成的生态风险状况不清.
因此,本研究针对长江干流典型江段地表水,包括攀枝花、宜宾、重庆、三峡库区、武汉以及南京江段,从2019~2020年在丰水期、平水期和枯水期进行样品采集,以16种优控PAHs为研究对象,分析PAHs在长江干流的浓度以及时空分布特征,识别长江典型江段地表水中PAHs的来源,并对长江干流PAHs进行生态风险评价.
1 材料与方法
1.1 实验材料与试剂

1.2 样品采集与前处理
根据长江沿岸城市的工农业发展程度以及人口密度的不同,选取长江干流6个受人类活动影响较大的典型江段作为本次的研究区域,共设置了51个采样点:包括攀枝花江段(P1~P6),宜宾江段(YB1~YB6),重庆江段(C1~C11),三峡库区江段(SX1~SX12),武汉江段(WH1~WH6),以及南京江段(N1~N10).每个典型江段采样点均囊括城市上下游区域,整体地反映城市不同功能区对长江地表水中PAHs的影响.采样点示意见图1.于2019年12月(枯水期)、2020年6月(丰水期)以及2020年10月(平水期)分3次在以上采样点对长江干流地表水进行样品采集,共计采集了127个样品.2020年6月(丰水期)武汉江段由于疫情的原因未进行样品采集.在长江中弘线的垂直方向上使用不锈钢盛水器直接采集水面下约0.5m处的表层水,水样采集时均避开了明显的污染源,采集的2L地表水样存储于预先清洗的避光棕色玻璃瓶中,水样在4℃条件下保存和运输,且在48h内完成过滤和固相萃取等前处理操作.
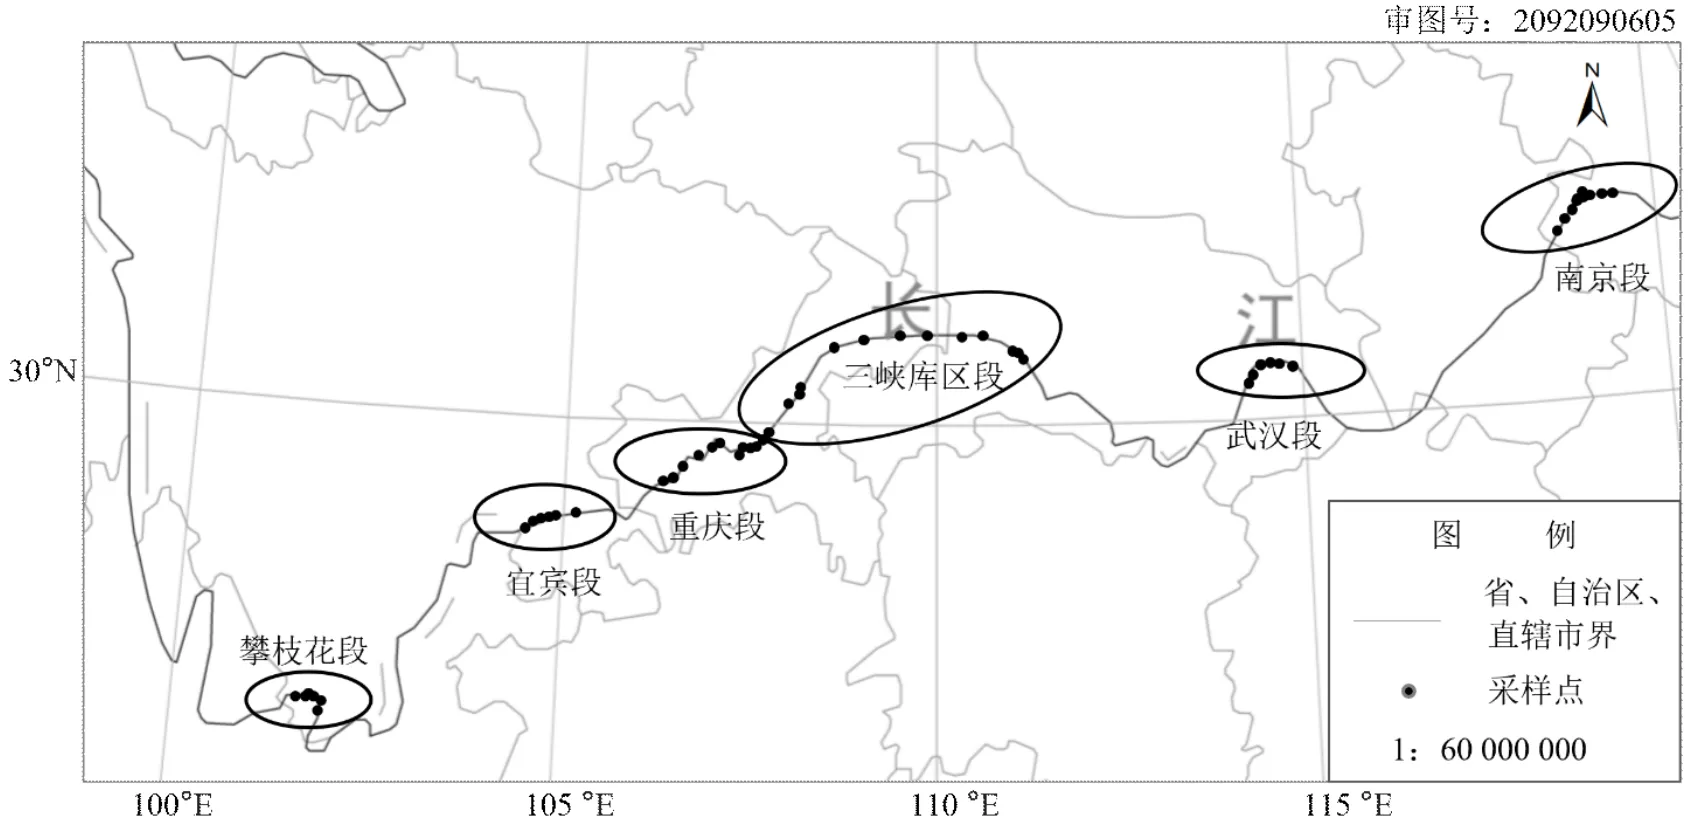
图1 采样点示意
样品前处理方法参照文献[24],采集到的2L水样首先使用0.7μm孔径的玻璃纤维滤膜去除水体中的悬浮颗粒物.加入回收率指示物氘代菲100ng,混匀后使用C18固相萃取柱对水样进行富集:富集前固相萃取小柱依次用5mL二氯甲烷、甲醇和超纯水进行淋洗和活化,在负压条件下使水样通过固相萃取小柱富集.富集好的小柱使用10mL二氯甲烷进行洗脱,洗脱液使用无水硫酸钠进行脱水处理,氮吹并置换溶液为正己烷,定容至0.5mL后于-20℃条件下保存以供后续仪器分析.
1.3 仪器分析与质量控制
PAHs的定性和定量分析使用安捷伦6890N气相色谱以及安捷伦5975B质谱联用仪.色谱柱为安捷伦DB-5MS柱(30m×0.25mm×0.25μm),柱温箱升温程序为:初始温度为60℃,保持2min,然后以10℃/min的速率升至300℃,保持10min.高纯氦气为载气,恒流模式下载气流速为1mL/min,采用不分流进样模式,进样量为1μL.质谱仪在选择离子模式(SIM)下进行定量分析,16种PAHs以及氘代菲的保留时间、特征离子、标准曲线等信息列于表1.
本研究采取了严格的质量控制过程,使用2L超纯水作为实验室空白,16种PAHs的实验室空白在n.d.~14.31ng/L间,除了萘的空白最高为14.31ng/L,其余15种PAHs浓度均在4.12ng/L以下,其中高环PAHs(>4环)在空白样品中均未检出,该实验空白对后续数据的解读和分析影响不大;在所有样品中加入回收率指示物氘代菲,结果表明氘代菲的回收率为(107%±12.13%) (=130,包括127个实际样品和3个空白样品);PAHs的检出限使用仪器自带的信噪比(/)工具进行估算,以/≈3时的进样浓度为仪器检出限(LOD),16种目标PAHs的LOD在0.05~ 0.2μg/L间;目标化合物的回收率通过实验室空白加标来测定,PAHs的回收率为65%~118%.
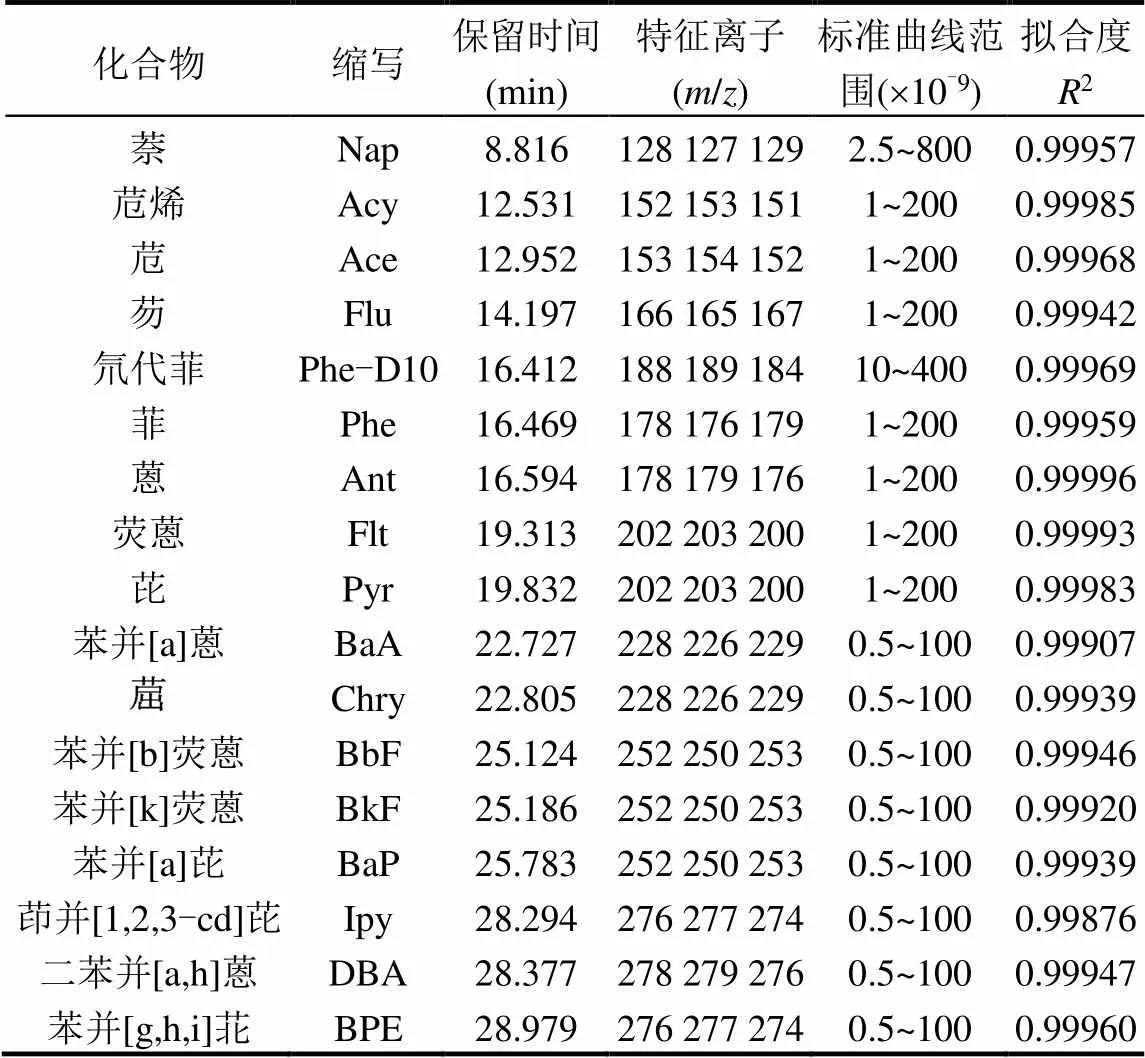
表1 16种PAHs以及氘代菲的保留时间,特征离子以及标准曲线
1.4 生态风险评价
采用物种敏感性分布评估法(SSD)对PAHs的生态风险进行评价,该方法描述了在一定污染物暴露浓度下预计受影响的物种比例,被广泛应用于评价某一污染物或多种污染物对生物的生态风险[25].SSD构建和应用的步骤如下:(1)毒性数据的获取;(2)SSD曲线拟合;(3)计算可能受影响的物种比例(PAF);(4)单一PAHs的生态风险评估.
生物毒性数据由美国环保署EPA ECOTOX数据库提供.毒性数据优先选择慢性毒性数据,当慢性数据量不足以构建SSD曲线时,可采用急性数据,并通过急/慢性毒性比率(ACR)来预测化合物相应的慢性值[25-26].本研究使用急性毒性数据来构建PAHs的SSD曲线,急/慢性毒性比率选用10[27]并选择暴露终点为半数致死浓度(LC50)及半数有效浓度(EC50),暴露时间小于4d的标准测试品种的毒理数据.所选物种的信息列于表2中.

表2 构建SSD曲线的物种信息
注:物种信息均来自EPA ECOTOX数据库.
Log-Normal, Log-logistic和Burr III型分布(包括Burr III、ReWeibull和Weibull)是构建SSD常用的拟合方法[26].与其他两个方法相比,Burr III型分布通常可以较好的拟合SSD曲线,本研究采用Burr III型分布拟合SSD曲线,并通过Burrli OZ软件构建SSD曲线[28].Burr III型分布可有公式(1)表示:
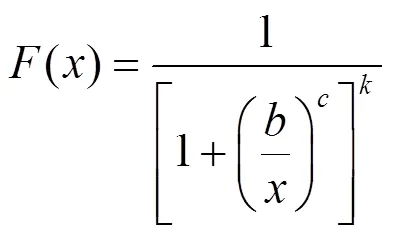
式中:为环境浓度,μg/L;、、为函数3个参数;当趋于无穷大时,Burr III分布函数变为Repareto 分布函数;当趋于无穷大时,可变成ReWeibull分布函数.
在SSD模型中,水生态风险以PAF值表征,PAF值越大,则污染物带来的水生态风险越高.当PAF值小于5%时,认为生态风险低或不显著;大于等于5%时生态风险被定义为高风险[29].PAF值的计算方法以公式(1)为例说明:取为污染物的浓度值带入式中,计算得到()值,即为PAF值.
2 结果与讨论
2.1 长江典型江段PAHs污染水平及时空分布特征
2.1.1 长江典型江段PAHs污染水平 水生态系统中低分子量PAHs因其高溶解性更倾向存在于水体中,而高分子量PAHs由于其对颗粒具有较强的亲和力更容易积聚于沉积物中[30-31],因此水体中16种PAHs的浓度以及检出率可能存在差异.如表3所示,从PAHs的组成上来看,2环和3环PAHs浓度在总量中占很大比例(中位数占比:82.54%;均值占比: 91.53%),其中Nap、Phe以及Flu是主要的组分,4环和5~6环PAHs浓度中位数分别占总量的15.69%和1.77%,浓度均值占总量的比值分别为6.97%及1.5%,可以看出2~4环PAHs浓度(中位数占比:98.23%;均值占比:98.50%)占比最大.Σ16PAHs浓度范围为2.22~1450.91ng/L,平均浓度为107.04ng/L.从长江典型江段PAHs的检出率来看,2~4环PAHs检出率较高,其中Nap、Flu、Flt以及Pyr的检出率均为100%,5~6环的PAHs除了BbF的检出率为98.43%外,其他PAHs的检出率均较低.研究发现平水期长江干流地表水中Nap以及丰水期3环和4环PAHs在上游江段存在累积现象,而枯水期和平水期PAHs几乎不存在累积.
本研究长江干流地表水中PAHs污染水平与近5a内(2017~2021年)报道的我国其他水体地表水中PAHs浓度相比(图2),长江干流的Σ16PAHs平均值与黄河[32]、丰水期海河[33]及潮白河[34]水体相似,高于丹水河流域、鄱阳湖等水体[33,35-38],低于松花江、台湾盐河以及观澜河等水体[39-44].可以看出近5a内长江干流PAHs污染在我国地表水中处于中等偏低水平.
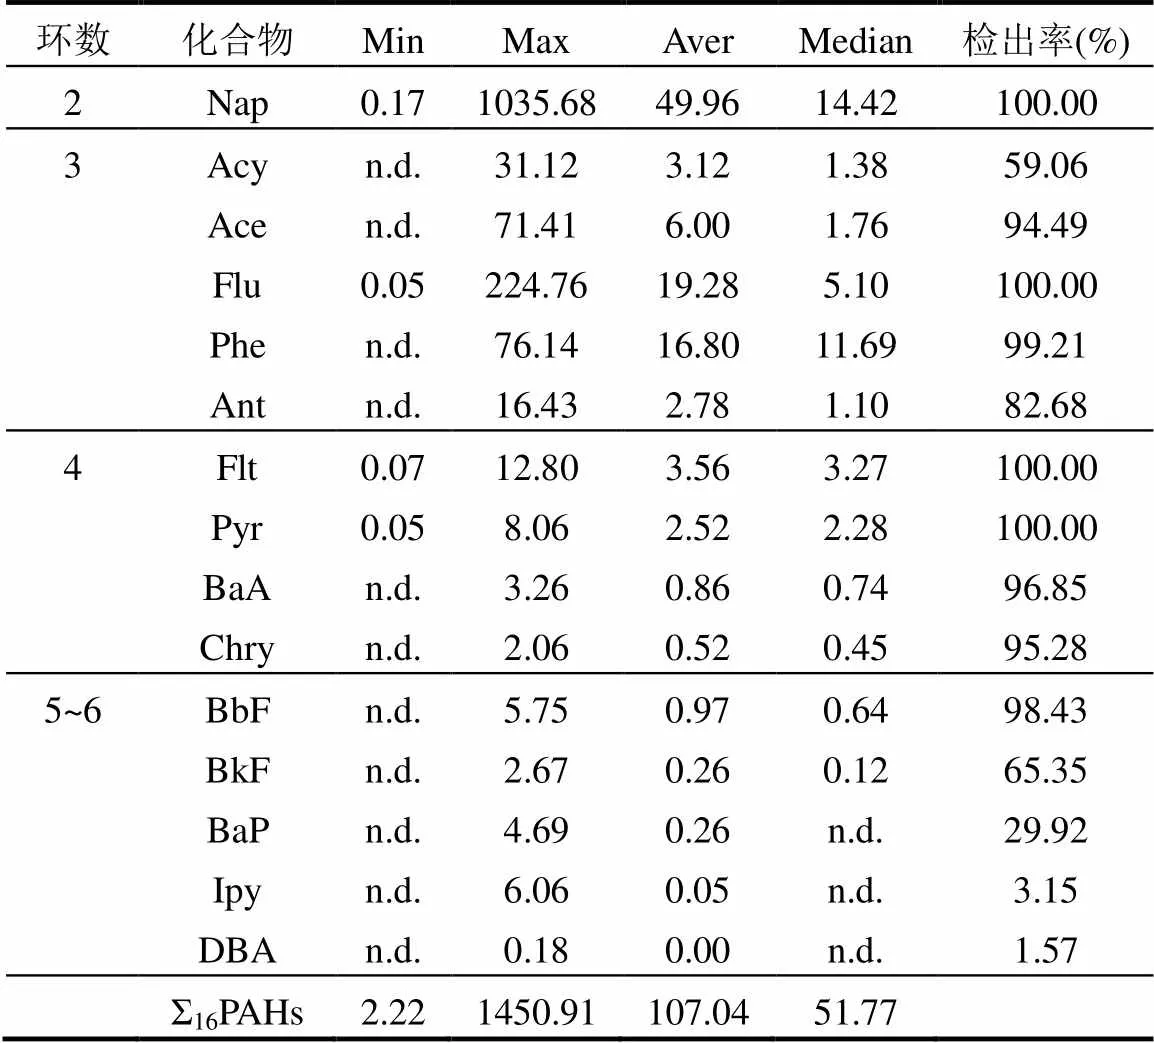
表3 16种PAHs在长江干流地表水中浓度统计(ng/L)
注:Min、Max、Aver以及Median分别为浓度最小值、最大值、平均值以及中位数; n.d.为未检出.

图2 近5a内(2017~2021)中国不同水体地表水中PAHs的浓度范围和均值
2.1.2 长江典型江段PAHs的时空分布特征 长江流域水系众多,支流、湖泊的汇入以及沿岸城市人文活动导致长江干流ΣPAHs在时空分布上可能存在明显的差异.图3显示了不同时期典型江段Σ16PAHs的分布特征,首先从空间分布上看,平水期PAHs的浓度从上游攀枝花江段(Σ16PAHs均值为43.61ng/L)到中下游武汉江段(1050.64ng/L)有上升趋势,下游的南京江段(94.61ng/L)较武汉江段浓度有所降低,但其浓度高于三峡江段(71.33ng/L);丰水期PAHs的浓度上游从攀枝花江段(23.59ng/L)到三峡库区江段(122.86ng/L)有上升趋势,下游的南京江段浓度较低(33.67ng/L),该江段浓度值仅高于上游的攀枝花江段浓度值;枯水期PAHs的浓度从上游到下游没有明显的变化趋势.总体上长江地表水中Σ16PAHs含量从上游攀枝花到下游南京江段呈现先上升后下降的趋势,下游南京江段Σ16PAHs含量(51.11ng/L)高于上游攀枝花(39.41ng/L)和宜宾江段(44.71ng/L). Nguyen等人研究表明工业区地表水中PAHs含量高于居民区[45],另外三峡[46]以及中下游[4,8]的工业较上游其他地区发达,可能是造成长江三峡库区以及中下游地区PAHs含量高于上游的攀枝花和宜宾江段的原因.
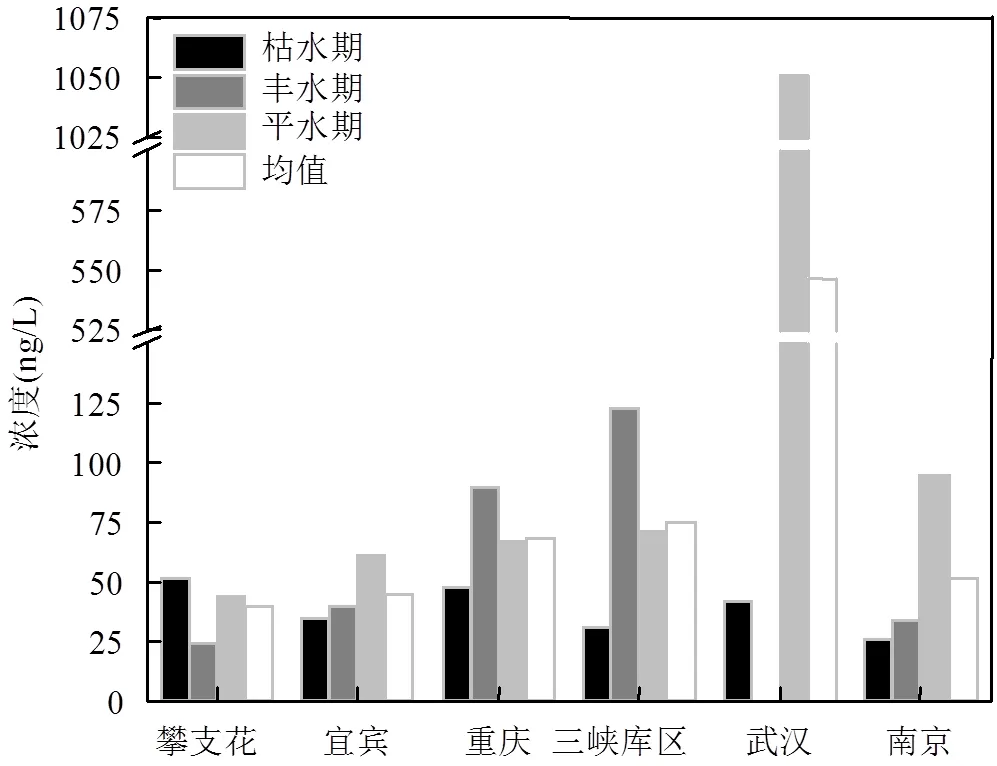
图3 长江典型江段PAHs在不同时期的变化特征
人类活动是地表水和沉积物中PAHs的主要来源.平水期武汉段与同时期其他城市的PAHs浓度有显著性差异(<0.05),该现象可能因为疫情得到控制后的武汉为满足经济的快速发展,排放大量工业废水以及频繁航运所排放的废弃物造成武汉江段PAHs污染严重.受疫情影响,2020年初武汉港一度货运需求下降,但是2020年全年武汉港集装箱年吞吐量达到193.25万,同2019年比增长了14.4%[47],并从武汉新港管理委员会得到武汉港2020年4~10月的集装箱吞吐量数据,发现2020年9月和10月集装箱吞吐量均高于同年4~8月的数据;频繁航运排放的废弃物可能是导致PAHs污染量剧增的原因.
从时间分布上看,枯水期16种PAHs的总浓度范围为4.05~87.65ng/L,均值为38.02ng/L;丰水期浓度范围2.22~184.51ng/L,均值为73.30ng/L;平水期浓度范围为25.3~1450.91ng/L,均值为187.78ng/L.枯水期攀枝花江段的Σ16PAHs浓度最高,为51.02ng/L;丰水期三峡库区的Σ16PAHs浓度最高,为122.86ng/L;而平水期武汉Σ16PAHs浓度最高,为1050.64ng/L.总的PAHs变化趋势为平水期>丰水期>枯水期.若忽略平水期武汉江段浓度,丰水期Σ16PAHs浓度均值略高于平水期Σ16PAHs浓度均值(70.12ng/L).本研究长江干流枯水期PAHs浓度低于其他时期的分布特征与太子河[48]、太湖[44]、长江重庆段[19]的分布特征相似.该现象的原因可能是丰水期和平水期降雨会增加地表水中PAHs湿沉降和地表径流的输入[44],另外,降雨引起沉积物扰动可能会导致沉积物中PAHs再次进入水环境[19].
丰水期的重庆和三峡库区江段PAHs含量明显高于其他时期(<0.05),该结果与Zhu等[19]研究的长江重庆江段PAHs时间变化趋势一致.近年来有研究表明重庆市区ΣPAHs的大气(气态+颗粒态)平均浓度为(79.9±40.5)ng/m³[49],以及大气沉降物平均浓度为(457±375)ng/L[50],均处于较高的浓度水平,丰水期强降雨可能增加重庆段和三峡库区段中PAHs湿沉降和地表径流的输入,三峡库区PAHs含量高可能还因为枯水期沉积物中PAHs大量累积,雨季三峡库区开闸泄洪以及强降雨[19]导致底泥中的PAHs再次进入水体中[51],造成丰水期该江段PAHs含量的增加.
随着长江沿岸城市的快速发展,大量的污染物即工业污废水和废弃物、市政污水以及航运产生的废料不断排入到长江干线中,城市江段内S16PAHs的分布可能会受到PAHs排放影响,因此本研究就单个城市的上下游PAHs浓度进行了研究,发现城市区域对江段中PAHs的含量有明显影响,例如攀枝花江段(上游S16PAHs浓度均值:38.37ng/L、中游39.63ng/L、下游:40.68ng/L(下同))、重庆江段(54.48,73.94, 84.14ng/L)以及南京江段(55.06,68.32,76.50ng/L)总PAHs含量从城市上游到下游呈现出上升的趋势,另外宜宾江段和武汉江段在中心城区处PAHs浓度高于城市上中下游(宜宾江段: 31.94,52.71,40.43ng/L和武汉江段:538.02, 823.45, 486.48ng/L).对于单个采样点而言,本研究发现C7采样点的S16PAHs浓度较高(114.19ng/L),该值高于重庆S16PAHs浓度均值(67.84ng/L),并且发现该采样点上游分布着化工厂、钢铁厂、码头以及污水处理厂,这些场所影响着该江段的水质.WH1(702.79ng/L)以及WH3(768.39ng/L) 采样点S16PAHs浓度值高于武汉S16PAHs浓度均值(546.27ng/L),这是因为WH1附近分布着众多工业园区,WH6采样点附近为武汉港口,这些场所排放的废水和废料造成该江段PAHs污染严重.N1(82.50ng/L)、N5(154.19ng/L)以及N9采样点(82.78ng/L)浓度值高于南京江段S16PAHs浓度均值(51.11ng/L),N1及N9为南京市工业园区、码头的下游区域,N5为南京市中心城区下游段,工业生产、航运以及城市生活污水的排放造成长江江段水质恶化.
2.2 来源分析
同分异构体比值法通常被用于识别和评估PAHs来源[52-53].本研究采用Ant/(Ant+Phe)和Fla/(Fla+Pyr)2个同分异构比值[52]对长江干流地表水中PAHs的来源进行分析,分析结果见图4.当Flt/(Flt+Pyr)比值小于0.4时表示PAHs主要源于石油源(石油、石油物质的泄漏),大于0.4但小于0.5时表示PAHs主要来源于石油燃烧、大于0.5时PAHs主要来源于煤炭、生物质燃烧;Ant/(Ant+Phe)比值小于0.1和大于0.1分别表示PAHs来源于石油源和煤炭、生物质燃烧[52,54].枯水期和平水期长江典型江段地表水的PAHs主要来源是煤炭、生物质燃烧和石油源.丰水期地表水中PAHs主要来源于煤炭、生物质燃烧.攀枝花江段PAHs来源在3个时期的比值基本未发生变化,均来源于煤炭、生物质燃烧和石油源.不同时期南京江段和武汉江段PAHs的来源存在显著性差异,枯水期南京江段以及武汉江段PAHs来源与其他江段PAHs来源一致,均来源于煤炭、生物质的燃烧以及石油泄漏,丰水期南京江段PAHs主要源于石油泄漏以及石油燃烧,而平水期南京江段和武汉江段PAHs主要由煤炭、生物质的燃烧.
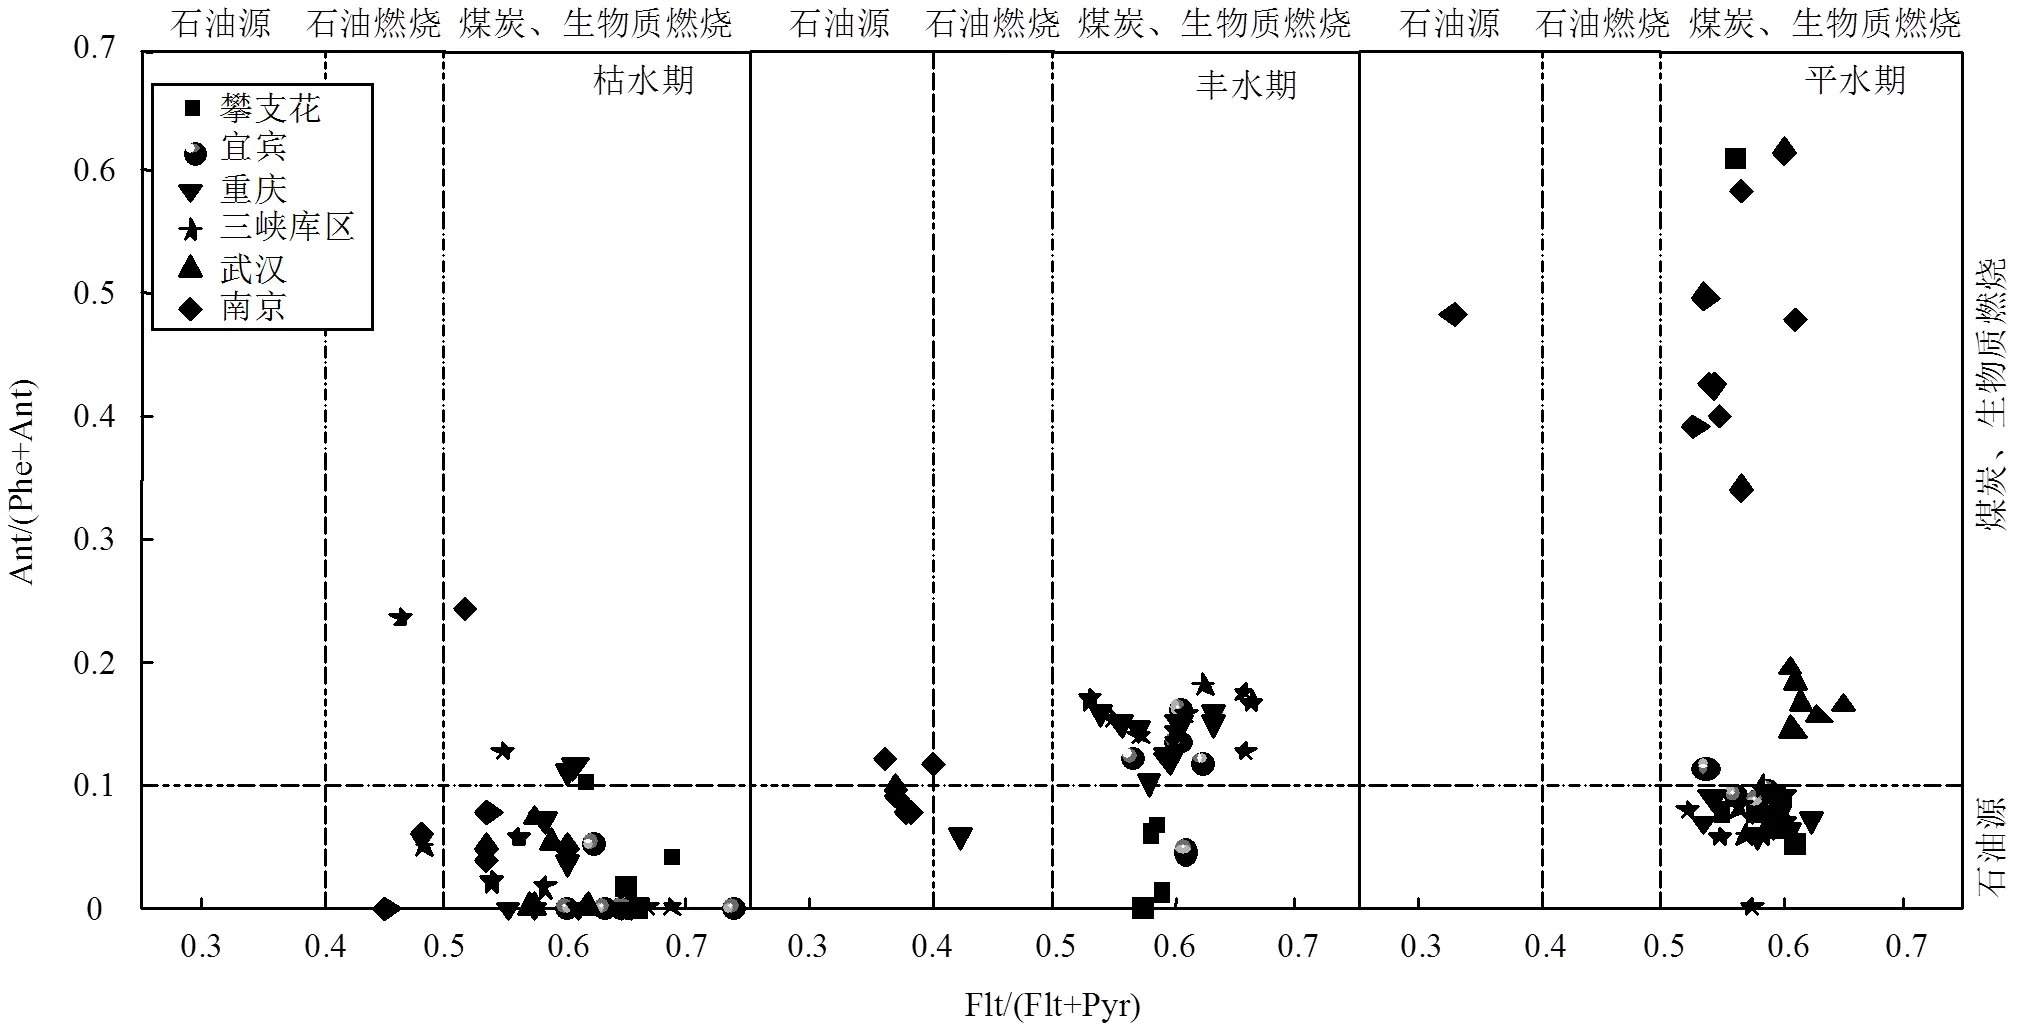
图4 长江典型江段PAHs在不同时期的来源特征
总的来说,长江PAHs主要源于煤炭、生物质燃烧和石油源,Tang等[46]对三峡库区PAHs进行了来源分析,发现煤炭、生物质燃烧与石油源为PAHs的主要来源,与本研究结果一致.长江干流地表水中PAHs污染来源与近5a内(2017~2021年)国内其他水体地表水中PAHs污染成因相比,长江干流PAHs污染成因仅与鄱阳湖[36]中PAHs的成因相同,均以石油源和煤炭、生物质燃烧为主;其他河流大多以石油、煤炭以及生物质混合燃烧为主[32,37-38,41]或者仅以煤炭、生物质燃烧为主[33,35,40].不难发现国内大多数河流中PAHs的来源均以煤炭、生物质燃烧为主,仅有小清河[43]和太湖[44]以石油污染和石油燃烧为主.
2.3 生态风险评估
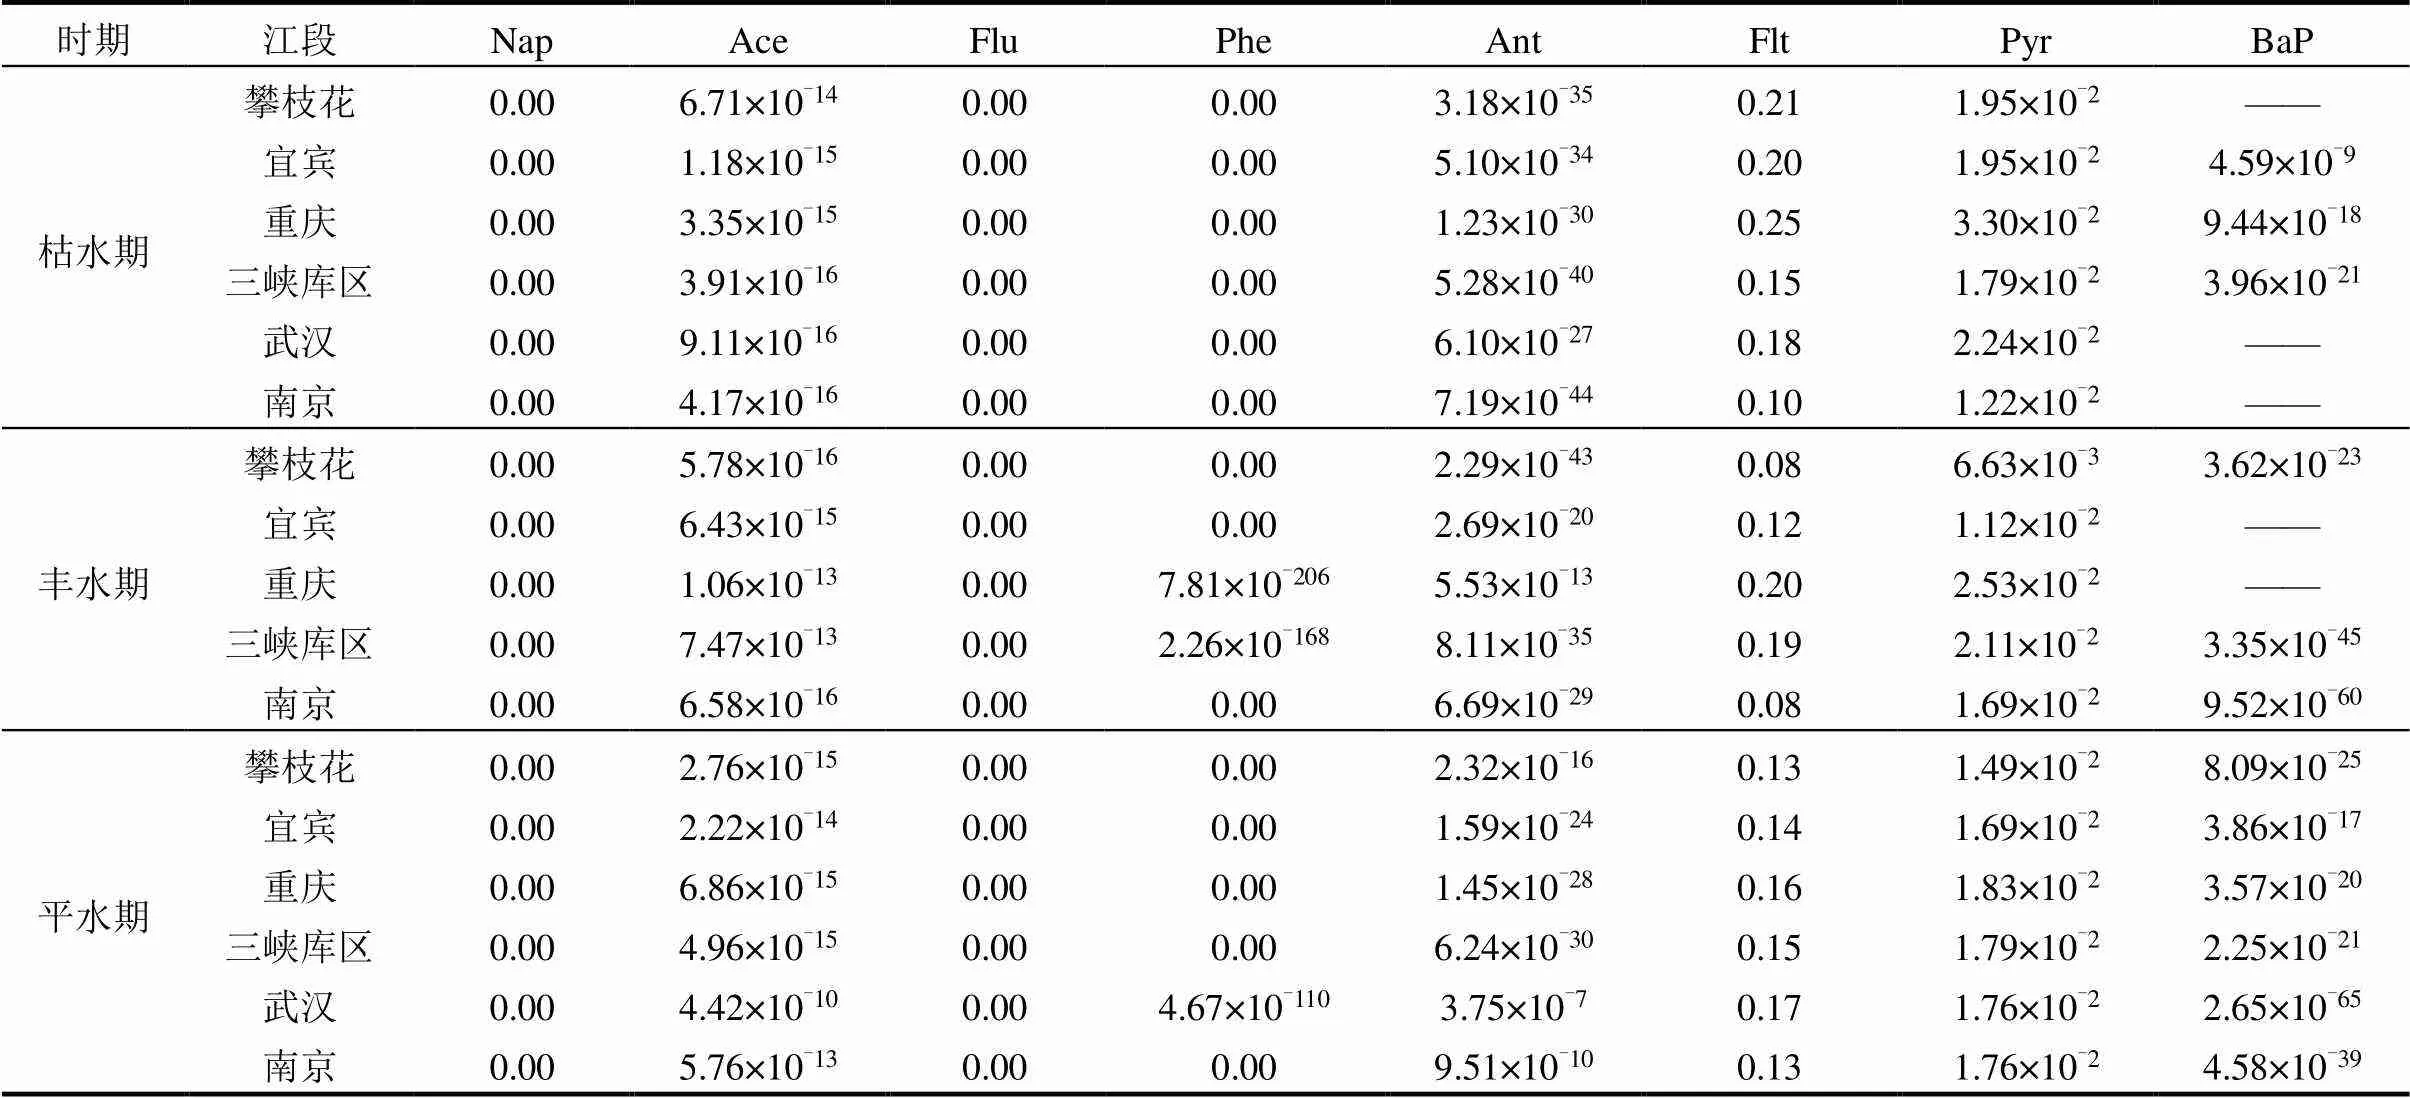
表4 长江干流地表水中8种PAHs的PAF值(%)
注: 0.00为PAF值较小接近无风险;——为在化合物未检出的情况下没有进行生态风险评估.
由于水生生物毒性数据的缺乏,本研究仅分析了8种PAHs的生态风险.从表4可以看出,所有江段地表水中Flt和Pyr的PAF值均比其他PAHs的PAF值高,丰水期三峡库区地表水中Flt和Pyr的PAF值高于枯水期和平水期,除此之外其他江段枯水期Flt和Pyr的风险均高于丰水期和平水期.长江典型江段PAHs的PAF值均低于5%,不存在明显的生态风险.为了解大保护政策的实施对长江地表水中PAHs生态风险的干预效果,本研究收集了大保护政策实施前长江流域水体中8种PAHs浓度均值的数据,并通过本研究拟合的SSD曲线评估了以往报道的PAHs的生态风险.结果如表5所示,大保护政策实施前攀枝花江段地表水的Pyr(PAF值为6.97%),武汉江段的Flt(7.62%)和南京江段的Ant(11.80%)、Flt(7.52%)以及Pyr(5.80%)均对地表水中水生生物构成较高的生态风险,并且在武汉江段地表水中Pyr(4.23%)以及Bap(3.63%)存在潜在的生态风险,而本研究中攀枝花、武汉以及南京的江段的风险均低于1%,不存在明显的生态风险.该结果表明长江大保护政策的实施,有效的降低了长江干流中PAHs的生态风险.

表5 以往长江地表水中PAHs浓度均值(µg/L)的报道及相应的PAF值(%)
注: 0.00为PAF值较小接近无风险;n.d.为化合物未检出;——为化合物未报道或未检出情况下没有进行生态风险评估.
3 结论
3.1 长江干流地表水中PAHs检测结果显示, Σ16PAHs浓度范围为2.22~1450.91ng/L,均值为107.04ng/L,长江PAHs的污染水平与5a年国内其他水体相比,总体处于中等偏低水平.
3.2 长江典型江段地表水中PAHs来源解析显示,水体受到石油源(石油泄漏)及生物质、煤燃烧共同污染,南京江段PAHs来源较为复杂.
3.3 生态风险评价结果显示,长江典型江段地表水中PAHs对水生生物没有造成明显的生态风险,其生态风险值低于2017年之前长江流域中PAHs的生态风险值,该结果与长江大保护政策的实施密不可分.
[1] 徐宏辉,徐婧莎,何 俊,等.浙北地区PM2.5中多环芳烃特征 [J]. 中国环境科学, 2018,38(9):49-55.
Xu H H, Xu J S, He J, et al. Characteristics analyses of PAHs in PM2.5in the northern Zhejiang province [J]. China Environmental Science, 2018,38(9):49-55.
[2] 王 超,刀 谞,张霖琳,等.我国大气背景点颗粒物PAHs分布特征及毒性评估 [J]. 中国环境科学, 2015,35(12):3543-3549.
Wang C, Dao X, Zhang L L, et al. Characteristics and toxicity assessment of airborne particulate polycyclic aromatic hydrocarbons of four background sites in China [J]. China Environmental Science, 2015,35(12):3543-3549.
[3] 张 娟,吴建芝,刘 燕.北京市绿地土壤多环芳烃分布及健康风险评价 [J]. 中国环境科学, 2017,37(3):1146-1153.
Zhang J, Wu J Z, Liu Y. Polycyclic aromatic hydrocarbons in urban green space of Beijing: distribution and potential risk [J]. China Environmental Science, 2017,37(3):1146-1153.
[4] Zhao Z, Gong X, Zhang L, et al. Riverine transport and water- sediment exchange of polycyclic aromatic hydrocarbons (PAHs) along the middle-lower Yangtze River, China [J]. Journal of Hazardous Materials, 2021,403:123973.
[5] Du Y, Xu X, Liu Q, et al. Contribution of atmospheric deposition to halogenated polycyclic aromatic hydrocarbons in surface sediments: A validation study [J]. The Science of the total environment, 2022,815: 152889.
[6] Kannan K, Johnson-Restrepo B, Yohn S S, et al. Spatial and temporal distribution of polycyclic aromatic hydrocarbons in sediments from Michigan inland lakes [J]. Environmental Science & Technology, 2005,39(13):4700-6.
[7] Zhang J M, Liu G J, Wang R J, et al. Polycyclic aromatic hydrocarbons in the water-SPM-sediment system from the middle reaches of Huai River, China: Distribution, partitioning, origin tracing and ecological risk assessment [J]. Environmental Pollution, 2017,230: 61-71.
[8] Yang Y J, Chen Z L, Zhang J L, et al. The challenge of micropollutants in surface water of the Yangtze River [J]. Science of the Total Environment, 2021,780:146537.
[9] Wong C M, Williams C E, Collier U, et al. World's top 10 rivers at risk [Z].Switzerland:World Wildlife Fund, 2007.
[10] Wang X, Shi W, Wu J, et al. Reproductive toxicity of organic extracts from petrochemical plant effluents discharged to the Yangtze River, China [J]. Journal of Environmental Sciences, 2010,22(2):297-303.
[11] Cai C, Li J, Wu D, et al. Spatial distribution, emission source and health risk of parent PAHs and derivatives in surface soils from the Yangtze River Delta, eastern China [J]. Chemosphere, 2017,178: 301-8.
[12] 银 昕.共抓大保护不搞大开发五年迎巨变 [J]. 法人, 2021,(2): 20-25.
Yin X. A total of major protection, no major development, five years to welcome great changes [J]. legal person, 2021,(2):20-25.
[13] 李 旸.水利部组织开展长江干流岸线保护和利用专项检查行动 [Z]. 中国:中国水利, 2018.
Li Y. The Ministry of Water Resources organized a special inspection campaign for the protection and utilization of the shoreline of the main stream of the Yangtze River [Z]. China: China Water Conservancy, 2018.
[14] 唐海滨,代嫣然,范垚城,等.长江中游岸线水域典型污染物种类与来源解析 [J]. 长江科学院院报, 2021,38(6):151-159.
Tang H B, Dai Y R, Fan Y C, et al. Typical pollutants in waters along the riverbank of the Yangtze River middle mainstream: species identification and source analysis [J]. Journal of Yangtze River Scientific Research Institute, 2021,38(6):151-159.
[15] 冯承莲,夏星辉,周 追,等.长江武汉段水体中多环芳烃的分布及来源分析 [J]. 环境科学学报, 2007,27(11):1900-1908.
Feng C L, Xia X H, Zhou Z, et al. Distribution and sources of polycyclic aromatic hydrocarbons in the Wuhan section of the Yangtze River [J]. Acta Scientiae Circumstantiae, 2007,27(11):1900-1908.
[16] 王 超,杨忠芳,夏学齐,等.中国不同地区典型河流中多环芳烃分布特征研究 [J]. 现代地质, 2012,26(2):400-106.
Wang C, Yang Z F, Xia X Q, et al. Distribution and sources of pAHs in typical chinese rivers [J]. Geoscience, 2012,26(2):400-406.
[17] He H, Hu G-j, Sun C, et al. Trace analysis of persistent toxic substances in the main stream of Jiangsu section of the Yangtze River, China [J]. Environmental Science and Pollution Research, 2011,18(4): 638-648.
[18] Wang C H, Zhou S L, Wu S H, et al. Surface water polycyclic aromatic hydrocarbons (PAH) in urban areas of Nanjing, China [J]. Water Science and Technology, 2017,76(8):2150-2157.
[19] Zhu Y, Liang B, Xia W, et al. Assessing potential risks of aquatic polycyclic aromatic compounds via multiple approaches: A case study in Jialing and Yangtze Rivers in downtown Chongqing, China [J]. Environmental Pollution, 2022,294:118620.
[20] Dong L, Lin L, Yang W J, et al. Distribution, composition, levels, source, and risk assessment of PAHs in surface water and sediment from the mainstream Three Gorges Reservoir [J]. Desalination and Water Treatment, 2019,168:175-183.
[21] 张坤锋,付 青,涂 响,等.武汉典型饮用水水源中典型POPs污染特征与健康风险评估 [J]. 环境科学, 2021,42(12):5836-5847.
Zhang K F, Fu Q, Tu X, et al. Pollution characteristics and risk assessment of typical POPs in typical drinking water sources in Wuhan [J]. Environmental Science, 2021,42(12):5836-5847.
[22] Yan Z H, Yang H H, Dong H K, et al. Occurrence and ecological risk assessment of organic micropollutants in the lower reaches of the Yangtze River, China: A case study of water diversion [J]. Environmental Pollution, 2018,239:223-232.
[23] 曾超怡,徐 辉,许 岩,等.长江重点江段水体中多环芳烃及其衍生物的分布及健康风险 [J]. 环境科学学报, 2021,41(12):4932-4941.
Zeng C Y, Xu H, Xu Y, et al. Distribution and health risk of polycyclic aromatic hydrocarbons (PAHs) and their derivatives in surface water of the Yangtze River [J]. Acta Scientiae Circumstantiae, 2021,41(12): 4932-4941.
[24] 宋瀚文,原盛广,王海亮,等.我国主要流域饮用水中PAHs浓度分布及风险评价 [J]. 中国给水排水, 2015,31(21):64-68.
Song H W, Yuan S G, Wang H L, et al. Distribution and risk assessment of polycyclic aromatic hydrocarbons in drinking water in major watersheds of china [J]. China Water & Wastewater, 2015, 31(21):64-68.
[25] Zhong W J, Wang D H, Xu X W, et al. Screening level ecological risk assessment for phenols in surface water of the Taihu Lake [J]. Chemosphere, 2010,80(9):998-1005.
[26] Xu F L, Li Y L, Wang Y, et al. Key issues for the development and application of the species sensitivity distribution (SSD) model for ecological risk assessment [J]. Ecological Indicators, 2015,54:227- 237.
[27] Chen J, Fan B, Li J, et al. Development of human health ambient water quality criteria of 12polycyclic aromatic hydrocarbons (PAH) and risk assessment in China [J]. Chemosphere, 2020,252:126590.
[28] 孔祥臻,何 伟,秦 宁,等.重金属对淡水生物生态风险的物种敏感性分布评估 [J]. 中国环境科学, 2011,31(9):1555-1562.
Kong X Z, He W, Qin N, et al. Assessing acute ecological risks of heavy metals to freshwater organisms by species sensitivity distributions [J]. China Environmental Science, 2011,31(9):1555- 1562.
[29] Rico A, de Oliveira R, Nunes G S D, et al. Ecological risk assessment of pesticides in urban streams of the Brazilian Amazon [J]. Chemosphere, 2022,291:132821.
[30] Guo W, He M C, Yang Z F, et al. Distribution of polycyclic aromatic hydrocarbons in water, suspended particulate matter and sediment from Daliao River watershed, China [J]. Chemosphere, 2007,68(1): 93-104.
[31] Qin N, He W, Kong X Z, et al. Distribution, partitioning and sources of polycyclic aromatic hydrocarbons in the water-SPM-sediment system of Lake Chaohu, China [J]. Science of the Total Environment, 2014,496:414-423.
[32] Liu Y, Bu Q W, Cao H M, et al. Polycyclic Aromatic Hydrocarbons in Surface Water from Wuhai and Lingwu Sections of the Yellow River: Concentrations, Sources, and Ecological Risk [J]. Journal of Chemistry, 2020,2020:8458257.
[33] 张 俊,王海兵,孟宪智,等.海河流域地表水水源地多环芳烃污染特征及来源分析 [J]. 环境监测管理与技术, 2020,32(6):61-64.
Zhang J, Wang H B, Meng X Z, et al. Pollution characteristic and source identification of PAHs in typical surface water sources in Haihe basin [J]. The Administration and Technique of Environmental Monitoring, 2020,32(6):61-64.
[34] Qiao M, Fu L, Li Z, et al. Distribution and ecological risk of substituted and parent polycyclic aromatic hydrocarbons in surface waters of the Bai, Chao, and Chaobai rivers in northern China [J]. Environmental Pollution, 2020,257:113600.
[35] Chen W, Peng B, Huang H F, et al. Distribution and potential sources of OCPs and PAHs in waters from the Danshui River Basin in Yichang, China [J]. International Journal of Environmental Research and Public Health, 2022,19(1):263.
[36] Zhang Y C, Qu C K, Qi S H, et al. Spatial-temporal variations and transport process of polycyclic aromatic hydrocarbons in Poyang Lake: Implication for dry-wet cycle impacts [J]. Journal of Geochemical Exploration, 2021,226:106738.
[37] CAO Y X, XIN M, WANG B D, et al. Spatiotemporal distribution, source, and ecological risk of polycyclic aromatic hydrocarbons (PAHs) in the urbanized semi-enclosed Jiaozhou Bay, China [J]. Science of the Total Environment, 2020,717:137224.
[38] 孙 旭.渤海水体和沉积物中多环芳烃的时空分布及来源研究 [D]. 烟台:中国科学院烟台海岸带研究所, 2021.
Sun X. Spatial distribution, seasonal variation and sources of polycyclic aromatic hydrocarbons in the seawater and sediments of the Bohai Sea [D].Beijing: Yantai Institute of Coastal Zone Research, Chinese Academy of Sciences, 2021.
[39] Chen C F, Ju Y R, Su Y C, et al. Distribution, sources, and behavior of PAHs in estuarine water systems exemplified by Salt River, Taiwan [J]. Marine Pollution Bulletin, 2020,154:111029.
[40] Mohammed R, Zhang Z F, Jiang C, et al. Fate and occurrence of polycyclic aromatic hydrocarbons and their derivatives in water and sediment from Songhua River, Northeast China [J]. Water, 2021,13(9): 1196.
[41] Liang X X, Junaid M, Wang Z F, et al. Spatiotemporal distribution, source apportionment and ecological risk assessment of PBDEs and PAHs in the Guanlan River from rapidly urbanizing areas of Shenzhen, China [J]. Environmental Pollution, 2019,250:695-707.
[42] Lv X M, Chen G L, Wu Y C, et al. Ecological and AhR-mediated risk assessment of polycyclic aromatic hydrocarbons and polybrominated diphenyl ethers on multiple aquatic species in river water: A combined chemical analysis and in silico approach [J]. Science of the Total Environment, 2022,820:153287.
[43] Ji G C, Zou L, Guan W C, et al. Partition, transportation and ecological risks of polycyclic aromatic hydrocarbons (PAHs) under heavy anthropogenic estuary: A case study in the Xiaoqing River Estuary, North China [J]. Regional Studies in Marine Science, 2021,43: 101664.
[44] Kong J, Dai Y, Han M, et al. Nitrated and parent PAHs in the surface water of Lake Taihu, China: Occurrence, distribution, source, and human health risk assessment [J]. Journal of Environmental Sciences, 2021,102:159-169.
[45] Nguyen T N T, Park M K, Son J M, et al. Spatial distribution and temporal variation of polycyclic aromatic hydrocarbons in runoff and surface water [J]. Science of the Total Environment, 2021,793:148339.
[46] Tang Y M, Junaid M, Niu A P, et al. Diverse toxicological risks of PAHs in surface water with an impounding level of 175m in the Three Gorges Reservoir Area, China [J]. Science of the Total Environment, 2017,580:1085-1096.
[47] 黎 云.武汉港集装箱年吞吐量创历史新高 [N]. 长江日报, 2021-01-06.
Li Y. Wuhan Port's annual container throughput hits a record high [N]. Changjiang Daily, 2021-01-06.
[48] Song X Y, Hu X J, He M M, et al. Distribution and sources of polycyclic aromatic hydrocarbons in the surface water of Taizi River, Northeast of China [J]. Environmental Monitoring and Assessment, 2013,185(10):8375-8382.
[49] Hu H, Tian M, Zhang L, et al. Sources and gas-particle partitioning of atmospheric parent, oxygenated, and nitrated polycyclic aromatic hydrocarbons in a humid city in southwest China [J]. Atmospheric Environment, 2019,206:1-10.
[50] Xia W, Liang B, Chen L, et al. Atmospheric wet and dry depositions of polycyclic aromatic compounds in a megacity of Southwest China [J]. Environmental Research, 2022,204:112151.
[51] Luo X J, Mai B X, Yang Q S, et al. Distribution and partition of polycyclic aromatic hydrocarbon in surface water of the Pearl River Estuary, South China [J]. Environmental Monitoring and Assessment, 2008,145(1-3):427-436.
[52] Liu Q, Xu X, Lin L, et al. Occurrence, distribution and ecological risk assessment of polycyclic aromatic hydrocarbons and their derivatives in the effluents of wastewater treatment plants [J]. Science of the Total Environment, 2021,789:147911.
[53] Bateni F, Mehdinia A, Lundin L, et al. Distribution, source and ecological risk assessment of polycyclic aromatic hydrocarbons in the sediments of northern part of the Persian Gulf [J]. Chemosphere, 2022,295:133859.
[54] 李 爽,刘殷佐,刘入瑜,等.浑河沈抚段多环芳烃的污染特征及风险评价 [J]. 中国环境科学, 2019,39(4):1551-1559.
Li S, Liu Y Z, Liu R Y, et al. The pollution characteristics and risk assessment of polycyclic aromatic hydrocarbons of Shen-Fu section of the Hun River Basin [J]. China Environmental Science, 2019,39(4): 1551-1559.
[55] Huang J, Zhang Z L, Yu G. Occurrence of dissolved PAHs in the Jinsha River (Panzhihua) - Upper reaches of the Yangtze River, Southwest China [J]. Journal of Environmental Monitoring, 2003,5(4): 604-609.
[56] Wu B, Zhao D Y, Zhang Y, et al. Multivariate statistical study of organic pollutants in Nanjing reach of Yangtze River [J]. Journal of Hazardous Materials, 2009,169(1-3):1093-1098.
Distribution characteristics, source and ecological risks assessment of PAHs in water bodies of typical sections of the Yangtze River.
YANG Meng-ru1,2, XU Xiong2*, WANG Dong-hong2, LIU Quan-zhen2, LV Jing2, LIN Li-hua2, WANG Dian-chang3, CHEN Yong-bo3, LIANG Wen-yan1**
(1.College of Environmental Science and Engineering, Beijing Forestry University, Beijing 100083, China;2.Key Laboratory of Drinking Water Science and Technology, Research Center for Eco-Environmental Sciences, Chinese Academy of Sciences, Beijing 100085, China;3.China Three Gorges Corporation, Wuhan 430014, China)., 2022,42(11):5308~5317
Sixteen priority polycyclic aromatic hydrocarbons(PAHs) were investigated in water samples (wet, normal and dry periods) in the main stream of the Yangtze River using solid-phase extraction (SPE) -gas chromatography-mass spectrometry (GC-MS) analysis technique. The pollution levels and distribution characteristics of PAHs were studied, the sources and ecological risks of PAHs were evaluated based on quantitative analysis. The results showed that the concentration of Σ16PAHs was from 2.22 to 1450.91ng/L, the average concentrations of ΣPAHs was 107.04ng/L in the Yangtze River, among them, the concentration of Σ16PAHs in the Wuhan river section was the highest during the normal period, with an average value of 1050.64ng/L. Compared with other domestic water bodies in the past five years, the PAHs pollution in the main stream of the Yangtze River was at a moderately low level. In terms of spatial distribution, the Σ16PAHs in surface water of typical sections of the Yangtze River showed a trend of first rising and then falling from the Upstream Panzhihua section to the downstream Nanjing section, The variation trend of Σ16PAHs in temporal distribution: normal period (187.78ng/L)>wet period (73.30ng/L)> dry period (38.02ng/L). The analysis by isomeric ratio method showed that coal, biomass burning and petroleum sources were the main sources of PAHs in the main stream of the Yangtze River in dry and normal periods, In the wet season, PAHs mainly originated from coal and biomass combustion, among them, the sources of PAHs in the Nanjing River section were more complex. The ecological risk assessment of PAHs was carried out using the Species Sensitivity Distributions (SSD) assessment method. The results showed that the PAHs in the surface water of typical sections of the Yangtze River had not yet caused significant negative impacts on aquatic organisms. The comparison of the results with historical data showed that the current ecological risk of PAHs in the main stream of the Yangtze River is lower than the ecological risk before the implementation of the Yangtze River protection policy.
the main stream of the Yangtze River;polycyclic aromatic hydrocarbons;ecological risks assessment
X522
A
1000-6923(2022)11-5308-10
杨梦茹(1997-),女,山西运城人,北京林业大学硕士研究生,主要从事水体中风险污染物筛查研究.
2022-04-24
中国长江三峡集团有限公司科研项目(201903139);广东省基础与应用基础研究基金资助项目(2020B1515120080);国家重点研发计划项目(2021YFC3200802-02)
* 责任作者, 助理研究员, xuxiong@rcees.ac.cn;** 教授, lwy@bjfu.edu.cn
猜你喜欢
资源信息与工程(2021年5期)2022-01-15
河南科技(2021年14期)2021-11-28
中国水利(2020年23期)2020-12-24
中国卫生产业(2020年25期)2020-11-30
飞天(2020年9期)2020-09-06
科学导报(2020年27期)2020-05-13
治淮(2016年6期)2016-09-02