
Oncogenic BRAFV600E induces microglial proliferation through extracellular signal-regulated kinase and neuronal death through c-Jun N-terminal kinase
2023-02-24 05:25QingYePranaySrivastavaNasserAlKuwariXiqunChen
中国神经再生研究(英文版) 2023年7期
Qing Ye ,Pranay Srivastava ,Nasser Al-Kuwari ,Xiqun Chen,
Abstract Activating V600E in v-Raf murine sarcoma viral oncogene homolog B (BRAF) is a common driver mutation in cancers of multiple tissue origins,including melanoma and glioma.BRAFV600E has also been implicated in neurodegeneration.The present study aims to characterize BRAFV600E during cell death and proliferation of three major cell types of the central nervous system: neurons,astrocytes,and microglia.Multiple primary cultures (primary cortical mixed culture) and cell lines of glial cells (BV2) and neurons (SH-SY5Y) were employed.BRAFV600E and BRAFWT expression was mediated by lentivirus or retrovirus.Blockage of downstream effectors (extracellular signal-regulated kinase 1/2 and JNK1/2) were achieved by siRNA.In astrocytes and microglia,BRAFV600E induces cell proliferation,and the proliferative effect in microglia is mediated by activated extracellular signal-regulated kinase,but not c-Jun N-terminal kinase.Conditioned medium from BRAFV600E-expressing microglia induced neuronal death.In neuronal cells,BRAFV600E directly induces neuronal death,through c-Jun N-terminal kinase but not extracellular signal-regulated kinase.We further show that BRAF-related genes are enriched in pathways in patients with Parkinson’s disease.Our study identifies distinct consequences mediated by distinct downstream effectors in dividing glial cells and in neurons following the same BRAF mutational activation and a causal link between BRAF-activated microglia and neuronal cell death that does not require physical proximity.It provides insight into a possibly important role of BRAF in neurodegeneration as a result of either dysregulated BRAF in neurons or its impact on glial cells.
Key Words:astrocytes;cell death;cell proliferation;inflammation;microglia;mutation;neurons;v-Raf murine sarcoma viral oncogene homolog B (BRAF)
Introduction
TheBRAF(v-Raf murine sarcoma viral oncogene homolog B) gene encodes a serine-threonine kinase.BRAFis ubiquitously expressed,with high levels in neuronal tissues.As part of the Ras-Raf-MEK-ERK pathway,BRAFis activated by RAS upstream,and it in turn phosphorylates and activates mitogenactivated protein kinase (MEK) downstream.MEK then phosphorylates and activates extracellular signal-regulated kinase (ERK).The Ras-Raf-MEKERK signaling cascade transduces extracellular signals to the cytoplasm and nucleus and is involved in the regulation of cell survival,growth,proliferation,and differentiation in developing and adult tissues,such as the central nervous system (CNS).In non-neuronal cells,including glial cells,BRAFstimulates cell proliferation (Galabova-Kovacs et al.,2008).BRAFsignaling is both necessary and sufficient to promote astrocyte proliferation during development (Tien et al.,2012).BRAFis also essential in oligodendrocyte maturation and myelination during postnatal CNS development (Galabova-Kovacs et al.,2008).Mutations ofBRAF,predominantly valine-to-glutamic acid mutation at residue 600 (V600E) lead to constitutive kinase activation and unregulated cell growth and proliferation.BRAFV600Eis one of the most prevalent oncogenic mutations in human cancers,accounting for more than half of melanomas and many other cancers including a variety of pediatric and adult gliomas (Schreck et al.,2019).Accordingly,BRAFinhibitors have been developed as a therapy for cancer (Zaman et al.,2019).
The essential role ofBRAFin neuronal development and survival has also been supported by studies (Frebel and Wiese,2006;Zhong,2016).BRAFis essenti al for the survival of embryonic neurons in culture (Wellbrock et al.,2004a).HomozygousBRAFnull mice are embryonic lethal due to growth retardation and neuronal defects (Wojnowski et al.,1997).Mice expressing non-functionalBRAFin neural stem cell-derived brain tissue displayed disturbed neuronal circuits in the cerebellum and hippocampus,along with impaired neuronal generation (Chen et al.,2006).Forebrain-specific knockout ofBRAFcaused impaired hippocampal learning and memory (Chen et al.,2006).Further,BRAFcontrols synaptic transmission and learning behavior (Lim et al.,2017).MutantBRAFV600Ein neural progenitors results in a hyperexcitable phenotype in neocortical pyramidal neurons (Goz et al.,2020),and contributes to intrinsic epileptogenicity without the formation of any neuronal tumors,whereas high proliferation of glial lineage cells contributes to the tumorigenicity of the mutation (Koh et al.,2018).Constitutive activation of BRAF by low-level expression ofBRAFV600Ein the mouse germline is associated with an increased number of astrocytes with unaltered neuron numbers in the hippocampal area (Tien et al.,2012).
More recent evidence implicates thatBRAFactivity may be involved in neuronal cell death,directly or indirectly.BRAFV600Esomatic mutation in the erythro-myeloid progenitors,which gives rise to tissue-resident myeloid cells,caused clonal expansion of microglia and subsequently caused synaptic loss and neuronal death in adulthood (Mass et al.,2017).The degenerative changes can be prevented byBRAFinhibition (Uenaka et al.,2018).
In this study,we aimed to report distinct consequences and downstream effectors followingBRAFV600Eexpression in primary cultures and cell lines of three major cell types of the CNS: neurons,astrocytes,and microglia,as well as the indirect effects ofBRAFV600Eon neurons through astrocytes and microglial cells.
Methods
Lenti viral particles were produced by transducing HEK293T cells with MD2.G envelope plasmid (Addgene,Cambridge,MA,USA),psPAX2-LV package plasmid (Addgene),and Lipofectamine 2000 Transduction Reagent (Thermo Fisher Scientific,Waltham,MA,USA).
Retroviral particles were produced by transducing HEK293T cells with the pBabe-Puro-BRAF-V600E plasmid (Addgene),the packaging plasmid gag/pol-Retroviral (Addgene),and the envelope plasmid MD2.G using Lipofectamine 2000.
Microglial cell line BV2 cells
BV2 cells (ATCC,Manassas,VA,USA,Cat# CRL-2467,RRID: CVCL_5744) were cultured with high-glucose Dulbecco’s Modified Eagle Medium (DMEM;Thermo Fisher Scientific) containing 10% fetal bovine serum (FBS;Thermo Fisher Scientific) and high glucose DMEM/F12 (Thermo Fisher Scientific)containing 10% FBS at 37°C in 5% CO2under constant temperature and humidity.After transduction withBRAFV600E,BRAFWT,and vector lentivirus,respectively,for 24 hours,cells were cultured for 24 hours in DMEM/F12 without fetal bovine serum (FBS),and then medium and cells were collected for subsequent experiments.Constructs used were: pMD2.G (Addgene,Cat# 12259,RRID: Addgene_12259),psPAX2 (Addgene,Cat# 12260,RRID:Addgene_12260),pHAGE-BRAFV600Eplasmid (Addgene,Cat# 116204,RRID:Addgene_116204),pHAGE-BRAFWTplasmid (Addgene,Cat# 116719,RRID:Addgene_116719),pBabe-Puro-BRAFV600Eplasmid (Addgene,Cat# 15269,RRID: Addgene_15269),gag/pol-Retroviral plasmid (Addgene,Cat# 14887,RRID: Addgene_14887),Control siRNA (Cell Signaling Technology,Boston,MA,USA,Cat# 6568S),SAPK/JNK siRNA (Cell Signaling Technology,Cat# 6232S),ERK1 siRNA (Cell Signaling Technology,Cat# 6436S),ERK2 siRNA (Cell Signaling Technology,Cat# 6578S).
Human neuroblastoma cell line SH-SY5Y cells
SH-SY5Y cells (ATCC,Cat# CRL-2266,RRID: CVCL_0019) were seeded at 80%density,and the medium was changed to DMEM/F12 supplemented with 1% FBS and 10 mM retinoic acid (MilliporeSigma,Burlington,MA,USA)for differentiation for 3 days (Encinas et al.,2000).The medium was then replaced with conditioned medium from BV2 cells that were transduced with different vectors (lenti viral vector,BRAFWT,andBRAFV600E) for 24 hours.Cells were then collected at different time points for subsequent experiments.
Primary cortical mixed culture
Primary cortical mixed culture was prepared from C57BL/6J mice on embryonic day 17.To obtain cortical culture,pregnant mice (Jackson Laboratory,Boston,MA,USA) were anestheti zed with either pentobarbitone(MilliporeSigma;60 mg/kg intraperitoneal),embryos were dissected,and cortex was collected in PBS on ice.Tissue was incubated in 0.25% trypsin-EDTA (Thermo Fisher Scientific) at 37°C for 15 minutes.Trypsinized tissue was transferred into a high-glucose DMEM/F12 medium supplemented with 10% FBS.After centrifugation at 1000 ×gfor 5 minutes,the pellet was resuspended (Hilgenberg and Smith,2007;Sciarretta and Minichiello,2010).Cells were plated onto poly-L-lysine (MilliporeSigma)-coated 24-well plates at 106cells per well and cultured in NB-A (Thermo Fisher Scientific).Cortical mixed cells were cultured for 5 days,transduced with lenti virus (LV) vectors or retrovirus (RV) vectors for 24 hours,and then cultured in NB-A medium for 96 hours.The general protocol used for cortical mixed culture was deposited in protocols (doi: dx.doi.org/10.17504/protocols.io.b4h6qt9e;https://www.protocols.io/view/primary-cortical-mixed-culture-b4h6qt9e.html).
Primary cortical neuronal culture
Primary cortical neurons were prepared from C57BL/6J mice on embryonic day 17.The dissected cortical tissue was digested,triturated,and centrifuged for cortical mixed culture.Cells were plated onto poly (L-lysine)-coated 24-well plates (ScienCell,San Diego,CA,USA) at 106cells per well and cultured in NB-A with 2% B27 (Invitrogen,Carlsbad,CA,USA).After 24 hours in culture,5 µg/mL cytarabine (MilliporeSigma) was added to inhibit the growth of glial cells in the medium and then changed to the original medium 48 hours later.Neurons were cultured for 5 days,and then transduced withBRAFV600E,BRAFWT,or vector lentivirus plus 8 µg/mL polybrene (MilliporeSigma) for 24 hours.After transduction,cells were cultured in NB-A for 120 hours and then collected for subsequent experiments.The general protocol used for primary cortical neuronal culture was deposited in protocols (doi: dx.doi.org/10.17504/protocols.io.b4t7qwrn).
Primary microglial culture
Mixed glial cells were obtained from C57BL/6 mice on embryonic day 17.Cells were cultured in high-glucose DMEM/F12 supplemented with 10% FBS in humidified air containing 5% CO2at 37°C.The culture medium was replaced with fresh medium 24 hours after the initial preparation and every 3 days thereafter.After 1 week,microglial cells were obtained by mechanical shaking of the mixed glial cell cultures for 1 hour.Cells were routinely monitored for purity by ionized calcium-binding adaptor molecule 1 (Iba1) staining and the population of Iba1+cells was >95% (Roy,2018).Microglial cells were seeded at 80% density,then transduced withBRAFV600E,BRAFWT,or vector lenti virus plus 8 µg/mL polybrene for 24 hours.After transduction,the cells were cultured for 120 hours in high-glucose DMEM/F12 with or without FBS,and the medium as well as the cells were collected for subsequent experiments.The general protocol used for primary microglial culture was deposited in protocols (doi: dx.doi.org/10.17504/protocols.io.b4ubqwsn;https://www.protocols.io/view/primary-microglial-culture-b4ubqwsn.html).
Primary astrocyte culture
Primary astrocytes were obtained from C57BL/6 mice on embryonic day 17.The dissected cortical tissue was digested,triturated,and centrifuged for neuronal cultures.The cell pellet was resuspended in high-glucose DMEM/F12 supplemented with 10% FBS.Cells were seeded in poly-L-ornithine-coated Petri plates (ScienCell).Nonadherent cells were removed after 20 minutes (Ahlemeyer and Baumgart-Vogt,2005).Astrocytes were transduced withBRAFV600E,BRAFWT,or vector lenti virus (MilliporeSigma) plus 8 µg/mL polybrene for 24 hours.After transduction,the cells were cultured for 120 hours in high-glucose DMEM/F12 with or without FBS,and the medium as well as the cells were collected for subsequent experiments.The general protocol used for primary astrocyte culture was deposited in protocols (doi: dx.doi.org/10.17504/protocols.io.b4yfqxtn;https://www.protocols.io/view/primary-astrocyte-culture-b4yfqxtn.html).All experiments were performed in accordance with a protocol approved by Institutional Animal Care and Use Committee at Massachusetts General Hospital (approval No.2018N000039) on May 11,2018.
siRNA transfection
Primary neurons and microglial cells were seeded in 6-well plates and transfected with ERK1 siRNA (Cell Signaling Technology),ERK2 siRNA (Cell Signaling Technology),SAPK/JNK siRNA (Cell Signaling Technology) at 80%cell confluence on day 4 in culture.ERK1 siRNA,ERK2 siRNA,JNK siRNA,and Lipofectamine RNAiMAX Transfection Reagent (Thermo Fisher Scientific) were diluted in OPTI-MEM medium (Thermo Fisher Scientific),mixed gently,and incubated for 5 minutes to allow complex formation.The cells were transfected by adding the RNAi-Lipofectamine complex (Invitrogen) dropwise to medium to achieve a siRNA concentration of 100 nM.The cells were collected 48 hours after the transfection for subsequent experiments (Kawakami et al.,2016).
Cell cycle determination
Cells were seeded in 6-well plates at 70% confluence,followed by virus transduction and siRNA treatment for 3 days.The cells were collected,fixed in 70% ethanol overnight,and stained with Tali Cell Cycle Kit (Thermo Fisher Scientific,Cat# A10798).We used the Attune NxT Flow Cytometer (Thermo Fisher Scientific) to determine the percentage of cells in each cell cycle phase.Flowjo soft ware (BD,San Francisco,CA,USA) was used to analyze the data.
Nitric oxide,lactate dehydrogenase and cell proliferation assays
Griess Reagent Kit (Thermo Fisher Scientific,Cat# G7921) was used to assess nitric oxide (NO) according to the manufacturer’s instructions.Cells were seeded in 96-well plates (Corning Inc.,Corning,NY,USA).We mixed the following reagents in each well: 20 µL Griess Reagent,150 µL nitritecontaining sample,and 130 µL deionized water.A photometric reference was prepared by mixing 20 µL Griess Reagent and 280 µL deionized water.The absorbance of the nitrite-containing samples relative to the reference was measured in Synergy 2 Multi -Mode Microplate Reader (Omega Bio-Tek,Norcross,GA,USA) at 548 nm.
For the lactate dehydrogenase (LDH) assay,Pierce LDH Cytotoxicity Assay Kit (Thermo Fisher Scientific,Cat# 88953) was used.Cell culture medium(50 µL) was transferred to a new 96-well plate,50 µL reaction mixture was added to each well and incubated at room temperature for 30 minutes,then 50 µL stop solution was added.Absorbance at 490 and 680 nm was measured using Synergy 2 Multi -Mode Microplate Reader (Omega Bio-Tek).For Cell Proliferation Assay (MTS),MTS Cell Proliferation Colorimetric Assay Kit (BioVision,Tucson,AZ,USA,Cat# K300-2500) was used.Cells were seeded in 96-well plates and treated as indicated above.After the treatment,the cell culture medium of each well was removed and 110 µL reagent containing 10 µL MTS and 100 µL medium was added to each well and incubated in humidified air containing 5% CO2at 37°C for 1 hour.Absorbance at 490 nm was measured using a microplate reader.
Immunostaining and quanti tative analysis
Cells were seeded in 24-well plates.After treatment,the medium was removed and the plates were washed with PBS three times,the slides were fixed with 4% paraformaldehyde for 15 minutes and washed with PBS three times,and permeabilized with 0.5% Triton X-100 at room temperature for 20 minutes.Plates were washed with PBS.The slides were incubated with 5% goat serum at room temperature for 30 minutes.Then the slides were incubated with primary antibodies at 4°C overnight.Primary antibodies used were: anti-mitogen-activated protein (MAP2) antibody (rabbit,1:500,Thermo Fisher Scientific,Cat# PA5-17646,RRID: AB_11006358),anti-Iba1 anti body (rabbit,1:500,Abcam,Cambridge,MA,USA,Cat# ab178847,RRID:AB_2832244),Ki67 antibody (rat,1:100,Thermo Fisher Scientific,Cat# 14-5698-82,RRID: AB_10854564),and anti-glial fibrillary acidic protein (GFAP)(mouse,1:1000,MilliporeSigma,Cat# C9205,RRID: AB_476889).Plates were washed and incubated with secondary anti bodies: goat anti -rabbit IgG-Alexa Fluor 488 (1:500,Thermo Fisher Scientific,Cat# A-11008,RRID: AB_143165) or donkey anti -mouse IgG-Alexa Fluor 546 (1:500,Thermo Fisher Scientific,Cat#A10036,RRID: AB_2534012) for 45 minutes in the dark at room temperature,washed with PBS and stained with DAPI (Vector Laboratories,Burlingame,CA,USA,Cat# H120010,RRID: AB_2336790).For analysis of fluorescence intensity,images were captured under an Olympus BX51 microscope (Olympus,Tokyo,Japan) with Olympus CAST stereology software and a DP 70 digital camera system using the same camera gain,exposure time,and pixel setting for all samples.Integrated optical density (IOD) of staining in the images was analyzed by Image J (version 1.8.0,NIH,Bethesda,MA,USA).
Quanti tative reverse transcription-polymerase chain reaction analysis
Quantitative reverse transcription-polymerase chain reaction analysis was applied to detect downstream genes related to inflammation,antioxidants,and apoptosis.RNA was isolated using the TRIzol LS Reagent (Thermo Fisher Scientific,Cat# 15596018).SuperScript III First-Strand Synthesis System (Thermo Fisher Scientific,Cat# 18080051) was used for cDNA synthesis.All primers were obtained from Massachusetts General Hospital DNA Core and are listed inTable 1.StepOnePlus Real-Time PCR System (Thermo Fisher Scientific) was used.Relative gene expression levels were analyzed using the 2–∆∆Ctmethod(Livak and Schmittgen,2001).GAPDH was used as an internal control.
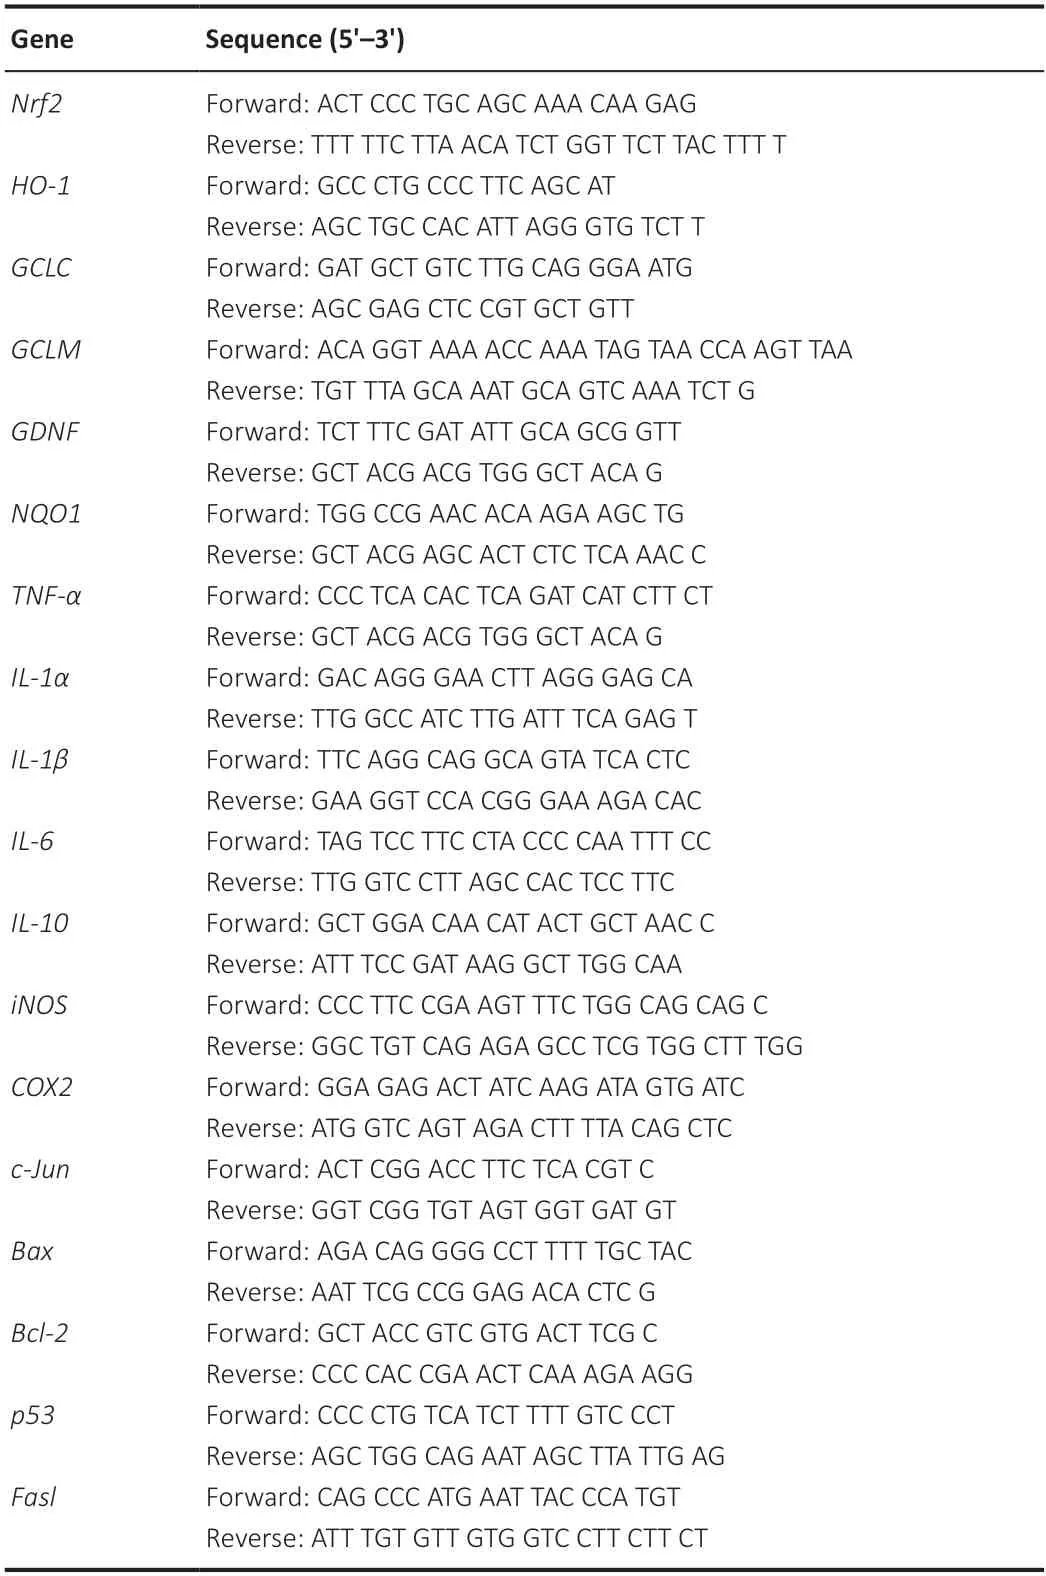
Table 1|The sequences of primers used in quantitative reverse transcriptionpolymerase chain reaction analysis
Western blotting
Western blotting was applied to detect BRAF,ERK,JNK,nuclear factor kappa-B(NF-κB),and other proteins associated with the pathways.The incubation temperature and time with the primary and secondary anti bodies were the same as above.Primary antibodies included BRAF (rabbit,1:100,Thermo Fisher Scientific,Cat# 711219,RRID: AB_2633134),MEK1/2 anti body (rabbit,1:1000,Cell Signaling Technology,Cat# 9122,RRID: AB_823567),phospho-MEK1/2 antibody (rabbit,1:1000,Cell Signaling Technology,Cat# 9154,RRID: AB_2138017),ERK1/2 (rabbit,1:1000,Cell Signaling Technology,Cat#4695,RRID: AB_10767767),phospho-ERK1/2 (rabbit,1:1000,Cell Signaling Technology,Cat# 9101,RRID: AB_1043673),JNK (rabbit,1:1000,Cell Signaling Technology,Cat #9252,RRID: AB_2250373),phospho-JNK (mouse,1:1000,Cell Signaling Technology,Cat# 9255,RRID: AB_2307321),NF-κB p65 (rabbit,1:1000,Cell Signaling Technology,Cat# 8242S,RRID: AB_10859369),phospho-NF-κB p65 (rabbit,1:1000,Cell Signaling Technology,Cat# 3033,RRID:AB_331284).GAPDH (rabbit,1:5000,Proteintech,China,Cat# 10494-1-AP,RRID: AB_2263076) was used as internal control.RIPA lysis buffer containing PMSF Protease Inhibitor (Thermo Fisher Scientific,Cat# 36978) and Pierce Phosphatase Inhibitor (Thermo Fisher Scientific,Cat# A32957) was used to extract cell total protein.Protein concentration was determined by Pierce BCA Protein Assay Kit (Thermo Fisher Scientific,Cat# 23227).Equal amounts of protein (30 mg) were loaded onto SDS-PAGE.Following separation,proteins were transferred from the gels to methanol-activated polyvinylidene fluoride(PVDF;MilliporeSigma) transfer membranes,blocked with 5% bovine serum albumin for 1 hour at 37°C.The membranes were incubated with primary anti bodies overnight at 4°C.Subsequently,the membranes were incubated with an appropriate horseradish-peroxidase-labeled secondary anti body for 1 hour at room temperature.Proteins were visualized using an ECL system(Thermo Fisher Scientific).The expression levels of phosphorylated proteins were quantified by normalizing them to their respective total proteins.Data was analyzed using Image J (version 1.8.0).
Enzyme-linked immunosorbent assay
The release of interleukin 1β (IL-1β),interleukin 6 (IL-6),and tumor necrosis factor α (TNF-α) in mouse primary microglial cell culture medium was measured with commercial enzyme-linked immunosorbent assay (ELISA)kits-mouse IL-1β (R&D Systems,NASDAQ,MN,USA,Cat# SMLB00C),mouse IL-6 (R&D Systems,Cat# M6000B),and mouse TNF-α (R&D Systems,Cat#SMTA00B).Cells were seeded in 6-well plates and cultured with DMEM/F12 supplemented with 10% FBS.After virus transduction,the cells were cultured for 24 hours in DMEM/F12 without FBS,and the medium was collected,centrifuged at 1000 ×gfor 10 minutes,and the supernatant was subjected to ELISA.Absorbance at 450 nm was measured using Synergy 2 Multi -Mode Microplate Reader (Omega Bio-Tek).IL-1β,IL-6,and TNF-α concentrations were calculated based on the standards and normalized with total protein concentration of the same sample.
Stati stical analysis
All experiments were repeated at least three times with at least three replicates under each condition.Investigators who performed assays were blind to treatment groups.All values are presented as the mean ± SEM.Group comparisons were performed using one-way analysis of variance and Tukey’spost hoctest.P<0.05 was considered statistically significant.Postmortem SN (substanti a nigra) gene expression profile from patients with Parkinson’s disease and function enrichment analysis of BRAF-related GDS2821 gene expression data from 16 patients with Parkinson’s disease were obtained from the National Center for Biotechnology Information’s (NCBI) Gene Expression Omnibus (GEO: https://www.ncbi.nlm.nih.gov/geo;https://www.ncbi.nlm.nih.gov/sites/GDSbrowser?acc=GDS2821).Gene expression values were log2 transformed and normalized by quanti le normalization with R soft ware(version 3.3.3,Ross Ihaka,Auckland,New Zealand) and the R package“limma” (Ritchie et al.,2015;Jansen et al.,2018).The Spearman coefficients of expression of genes andBRAFwere calculated,whilst the expression genes withP<0.05 were defined as BRAF-related genes.The Database for Annotation,Visualization,and Integrated Discovery (DAVID,http://david.ncifcrf.gov),an online functional annotation tool,was applied for gene ontology (GO) enrichment analyses including biological process (BP),cellular component (CC),molecular function (MF),and Kyoto Encyclopedia of Genes and Genomes (KEGG) pathway analysis (Huang da et al.,2009).GO terms or KEGG pathways withP<0.01 were considered stati stically significant.
Results
BRAFV600E expression leads to neuronal cell death and glial cell proliferation in primary mouse cortical mixed culture
Primary cortical mixed culture consisting of neurons and glial cells (astrocytes and microglia) was transduced with LV expressing humanBRAFV600E,humanBRAFWT,or control vector.BRAFoverexpression was detected by western blotting,which showed significantly increasedBRAFin transduced cells than vector or non-transduced control cells (P<0.001;Figure 1A).Immunostaining for MAP2,a marker of neurons,and Iba1,a marker for microglia,120 hours after the transduction showed a significant decrease in the number of neurons and a significant increase in the number of microglia in the mixed culture transduced withBRAFV600Ethan vector orBRAFWT(P<0.001;Figure 1B).Similarly,immunostaining for MAP2 and GFAP,a marker for astrocytes,showed a significant decrease in the number of neurons and a significant increase in the number of astrocytes in the culture transduced withBRAFV600Ethan vector orBRAFWT(P<0.001;Figure 1E).BRAFWT did not change the number of either MAP2+or Iba1+or GFAP+cells (Figure 1BandE).These results suggest thatBRAFV600Eexpression in the cortical mixed culture may lead to different outcomes for neurons and glial cells.
The mixed cultures were transduced withBRAFV600Eor control vector by RV.Unlike LV,which is capable of infecting both neurons and glial cells,RV infects only dividing cells,not postmitotic neurons.Immunoblotting showed significantly higher BRAF expression in RV transduced cells than vector or nontransduced control cells (Figure 1C).After 120 hours,MAP2 and Iba1 staining showed a significant increase in the number of microglia (P<0.01) and a significant decrease in the number of neurons in RVBRAFV600E-transduced culture (P<0.001) than RV vector-transduced culture (Figure 1D).BRAFV600Etransduction resulted in a significant increase in the number of astrocytes (P<0.01) and a significant decrease in the number of neurons (P<0.001) than RV vector-transduced cells,which were demonstrated by MAP2 and GFAP staining (Figure 1F).These findings suggest that the mutantBRAFmay cause neuronal loss through the proliferation of microglia and/or astrocytes.
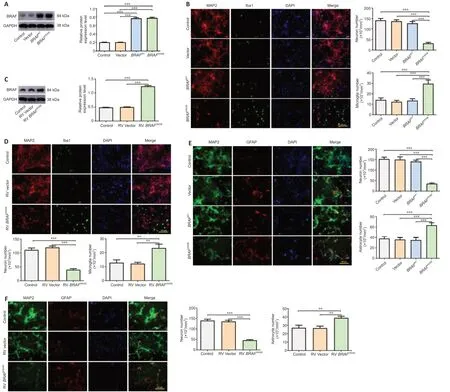
Figure 1|BRAFV600E expression leads to neuronal cell death and glial cell proliferation in primary mouse cortical mixed culture.
BRAFV600E expression in astrocytes promotes proliferation
To investigate the effect ofBRAFV600Eon individual cell types,we next transduced primary astrocytes prepared from C57BL/6 mouse embryos with lenti viralBRAFV600E,BRAFWT,and control vector,respectively.Western blotting showed that 120 hours after the transduction,expression levels of MAP/phosphorylated MEK1/2 (p-MEK1/2),phosphorylated ERK1/2 (p-ERK1/2)inBRAFV600E-transduced astrocytes were significantly increased compared with the vector-transduced or non-transduced control groups,suggesting activation of the ERK pathway byBRAFV600E(P<0.001;Figure 2A).Flow cytometry showed that there was a significantly lower percentage of cells in G0/G1phase (P<0.01) and a significantly higher percentage of cells in the S phase inBRAFV600E-transduced astrocytes as compared with vector or nontransduced control groups (P<0.001;Figure 2B).Despite an increase in BRAF expression by nearly 3-fold,BRAFWTdid not change cell cycle distribution in cultured primary astrocytes,which can be explained by the approximately 500-fold greater kinase acti vity ofBRAFV600EthanBRAFWT(Wan et al.,2004).MTS assay revealed that astrocyte viability was increased significantly 96 and 120 hours afterBRAFV600Etransduction compared with vector or nontransduced control group (P<0.001;Figure 2C).Immunostaining for GFAP and Ki67,an indicator of proliferation,showed that a total number of GFAP+cells and percentage of Ki67+cells in theBRAFV600E-transduced group were significantly higher than vector or non-transduced control group 96 hours after transduction,while transduction withBRAFWTshowed no significant difference compared with vector or the control group (Figure 2D).IL-6,IL-10,and cyclooxygenase 2 (COX2) were significantly increased at mRNA level whereas TNF-α and IL-1β levels were decreased afterBRAFV600Etransduction(P<0.001;Figure 2E).In addition,nuclear factor erythroid 2 (NF-E2)-related factor 2 (Nrf2) and its downstream genes heme oxygenase 1 (HO1),quinone oxidoreductase 1 (NQO1),glutamate-cysteine ligase catalytic subunit (GCLC),and glutamate cysteine ligase modifier subunit (GCLM) were increased significantly inBRAFV600E-transduced astrocytes.In addition,there was a dramatic increase in glial-derived neurotrophic factor (GDNF) mRNA level inBRAFV600E-transduced cells (P<0.001;Figure 2F).
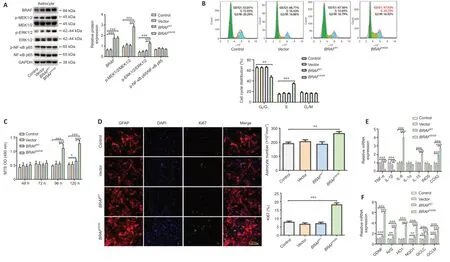
Figure 2|BRAFV600E expression in astrocytes promotes proliferation.
BRAFV600E expression in microglia induces cell proliferation and activation through ERK
To determine the effects ofBRAFV600Eon microglial cells,we transducedBRAFinto BV2 cells for 96 hours.Western blotting showed that expression ofBRAF,p-MEK1/2,p-ERK1/2,and phosphorylated NF-κB p65 (p-NF-κB p65)in theBRAFV600Egroup was significantly increased compared with vector and non-transduced control groups (P<0.001;Additional Figure1A).Flow cytometry showed significantly lower percentages of cells in G0/and G2/M phases (P<0.01) and a significantly higher percentage of cells in the S phase in theBRAFV600E-transduced group compared with vector or non-transduced control groups (P<0.001;Additional Figure 1B).MTS also revealed that transduction withBRAFV600Einduced BV2 cell proliferation (Additional Figure 1D).Immunostaining for Iba1 showed that cell number in theBRAFV600E-transduced group was significantly increased compared with vector and nontransduced control groups (P<0.001).Morphologically,BV2 cells showed a typical branching shape at the resting state in the non-transduced control group.Transduction with vector andBRAFWTcaused no obvious morphological changes compared with the control group.BV2 cells transduced withBRAFV600Edisplayed reduced cell area,loss of ramifications,and development of an amoeboid shape (Additional Figure 1C).qPCR analysis showed increases in TNF-α,IL-1β,IL-6,and COX2 inBRAFV600E-treated BV2 cells.mRNA levels of Nrf2 and its downstream genes HO1,NQO1,GCLC,and GCLM were decreased significantly after transduction withBRAFV600Ecompared with vector and nontransduced control groups (P<0.001;Additional Figure 1F).Enzyme-linked immunosorbent assay (ELISA) showed that the levels of inflammatory factors(IL-1β,IL-6,and TNF-α) secreted into the culture medium byBRAFV600E-treated BV2 cells were higher than those in the control groups (P<0.001;Additional Figure 1G).There was no significant difference in NO level among the groups(Additional Figure 1E).These results support the proliferation and activation of BV2 microglia byBRAFV600E.
We next employed mouse primary microglia to further characterize the effects ofBRAFV600Eon microglial cells.Cells were transduced with BRAF vectors for 120 hours.BRAFV600Etransduction significantly increased p-MEK1/2 and p-ERK1/2 compared with vector and non-transduced control groups (P<0.001).In addition,p-NF-κB p65 and p-JNK were increased (P<0.001;Figure 3A).To determine the roles of activated ERK and JNK inBRAFV600Eeffects,we transduced microglial cells with siRNA targeting JNK (si-JNK),siRNA targeting ERK (si-ERK),and control-siRNA.Knockdown efficiency of si-JNK and si-ERK was demonstrated by western blotting (Figure 3BandC).After treatment with si-ERK,BRAFV600E-transduced microglia showed significantly downregulated ERK as compared with control-siRNA-treated cells expressingBRAFV600E(P<0.001).NF-κB phosphorylation was similarly downregulated.si-JNK did not change p-NF-κB inBRAFV600E-transduced microglia (Figure3D).Iba1 staining showed that the cell number and percentage of Ki67+cells in theBRAFV600E-treated group were significantly increased compared with vector and nontransduced control groups (P<0.001).TheBRAFWT-treated group did not show a significant difference from vector and non-transduced control groups(Figure 3E).si-ERK treatment blockedBRAFV600E-induced proliferation of microglia.Si-JNK did not change the number of Iba1+cells and the percentage of Ki67+cells inBRAFV600E-transduced cells (Figure 3E).Non-transduced control microglia displayed the typical branching shape at the resting state.Transduction with vector,BRAFWT,andBRAFV600Eplus si-ERK caused no obvious morphological changes compared with the control group.BRAFV600EandBRAFV600Eplus si-JNK transduction induced enlargement of the microglial cell body,loss of ramifications,and development of an amoeboid shape (Figure 3EandF).
Flow cytometry showed that,compared with the vector group,the percentage of S-phase microglia in theBRAFV600E-treated group was increased significantly (P<0.001;Figure 3G),and this effect ofBRAFV600Ewas diminished when cells were treated with si-ERK but not si-JNK (Figure 3H).MTS assay revealed significantly higher cell viability after transduction withBRAFV600Efor 96 hours compared with vector (P<0.05) and non-transduced control groups(P<0.01),the change becomes more significant at 120 hours (P<0.001),and si-ERK reversed this effect (Figure 3I).Inflammatory markers TNF-α,IL-1α,IL-1β,IL-6,human inducible NO synthase,and COX2 were significantly increased at the mRNA level after transduction withBRAFV600Efor 120 hours (P<0.001).BRAFWT-transduced microglia displayed similar trends but to a lesser extent(P<0.001),supporting BRAF activity dependence on the changes.si-ERK significantly inhibitedBRAFV600E-induced inflammatory gene expression (P<0.001),while si-JNK did not reverse the effect (Figure 3K).ELISA and nitrite release showed that inflammatory factors (IL-1β,IL-6,and TNF-α) and NO secreted by microglia after treatment withBRAFV600Ewere significantly higher than vector and non-transduced control groups (P<0.001).si-ERK,but not si-JNK,reversed the secretion of inflammatory factors (IL-1β,IL-6,and TNF-α)and NO-induced byBRAFV600E(P<0.001;Figure 3JandL).
Conditioned medium from BRAFV600E-expressing microglial cells but not astrocytes induces neuronal cell death
We treated differenti ated SH-SY5Y cells with conditioned medium from BV2 cells transduced withBRAFV600E,BRAFWT,vector,or from non-transduced control cells for 24 hours.MAP2 staining showed a significant loss of neuronal cells in differenti ated SH-SY5Y cells cultured with BV2-BRAFV600Econditioned medium as compared to cells cultured with BV2-vector and BV2-BRAFWTconditioned medium.Consistently,these cells showed increased LDH release compared with cells cultured with BV2-vector and BV2-BRAFWTconditioned medium.Differenti ated SH-SY5Y cells cultured with BV2-control,BV2-vector,and BV2-BRAFWTconditioned medium exhibited no obvious changes in cell numbers and LDH release as compared to the control group (Additional Figure 2).We next treated primary cortical neurons with conditioned medium from astrocytes transduced withBRAFV600E,BRAFWT,vector,or from non-transduced control cells for up to 72 hours.Astrocytes transduced withBRAFV600Ewere proliferating with upregulated GDNF,certain cytokines,and antioxidants as shown inFigure 2F.However,no significant difference in the number of MAP2+was demonstrated in all astrocyte-conditioned medium-treated groups compared with the control group (Figure 4AandB).LDH release showed no significant change among groups at 24,28,and 72 hours (Figure 4C).
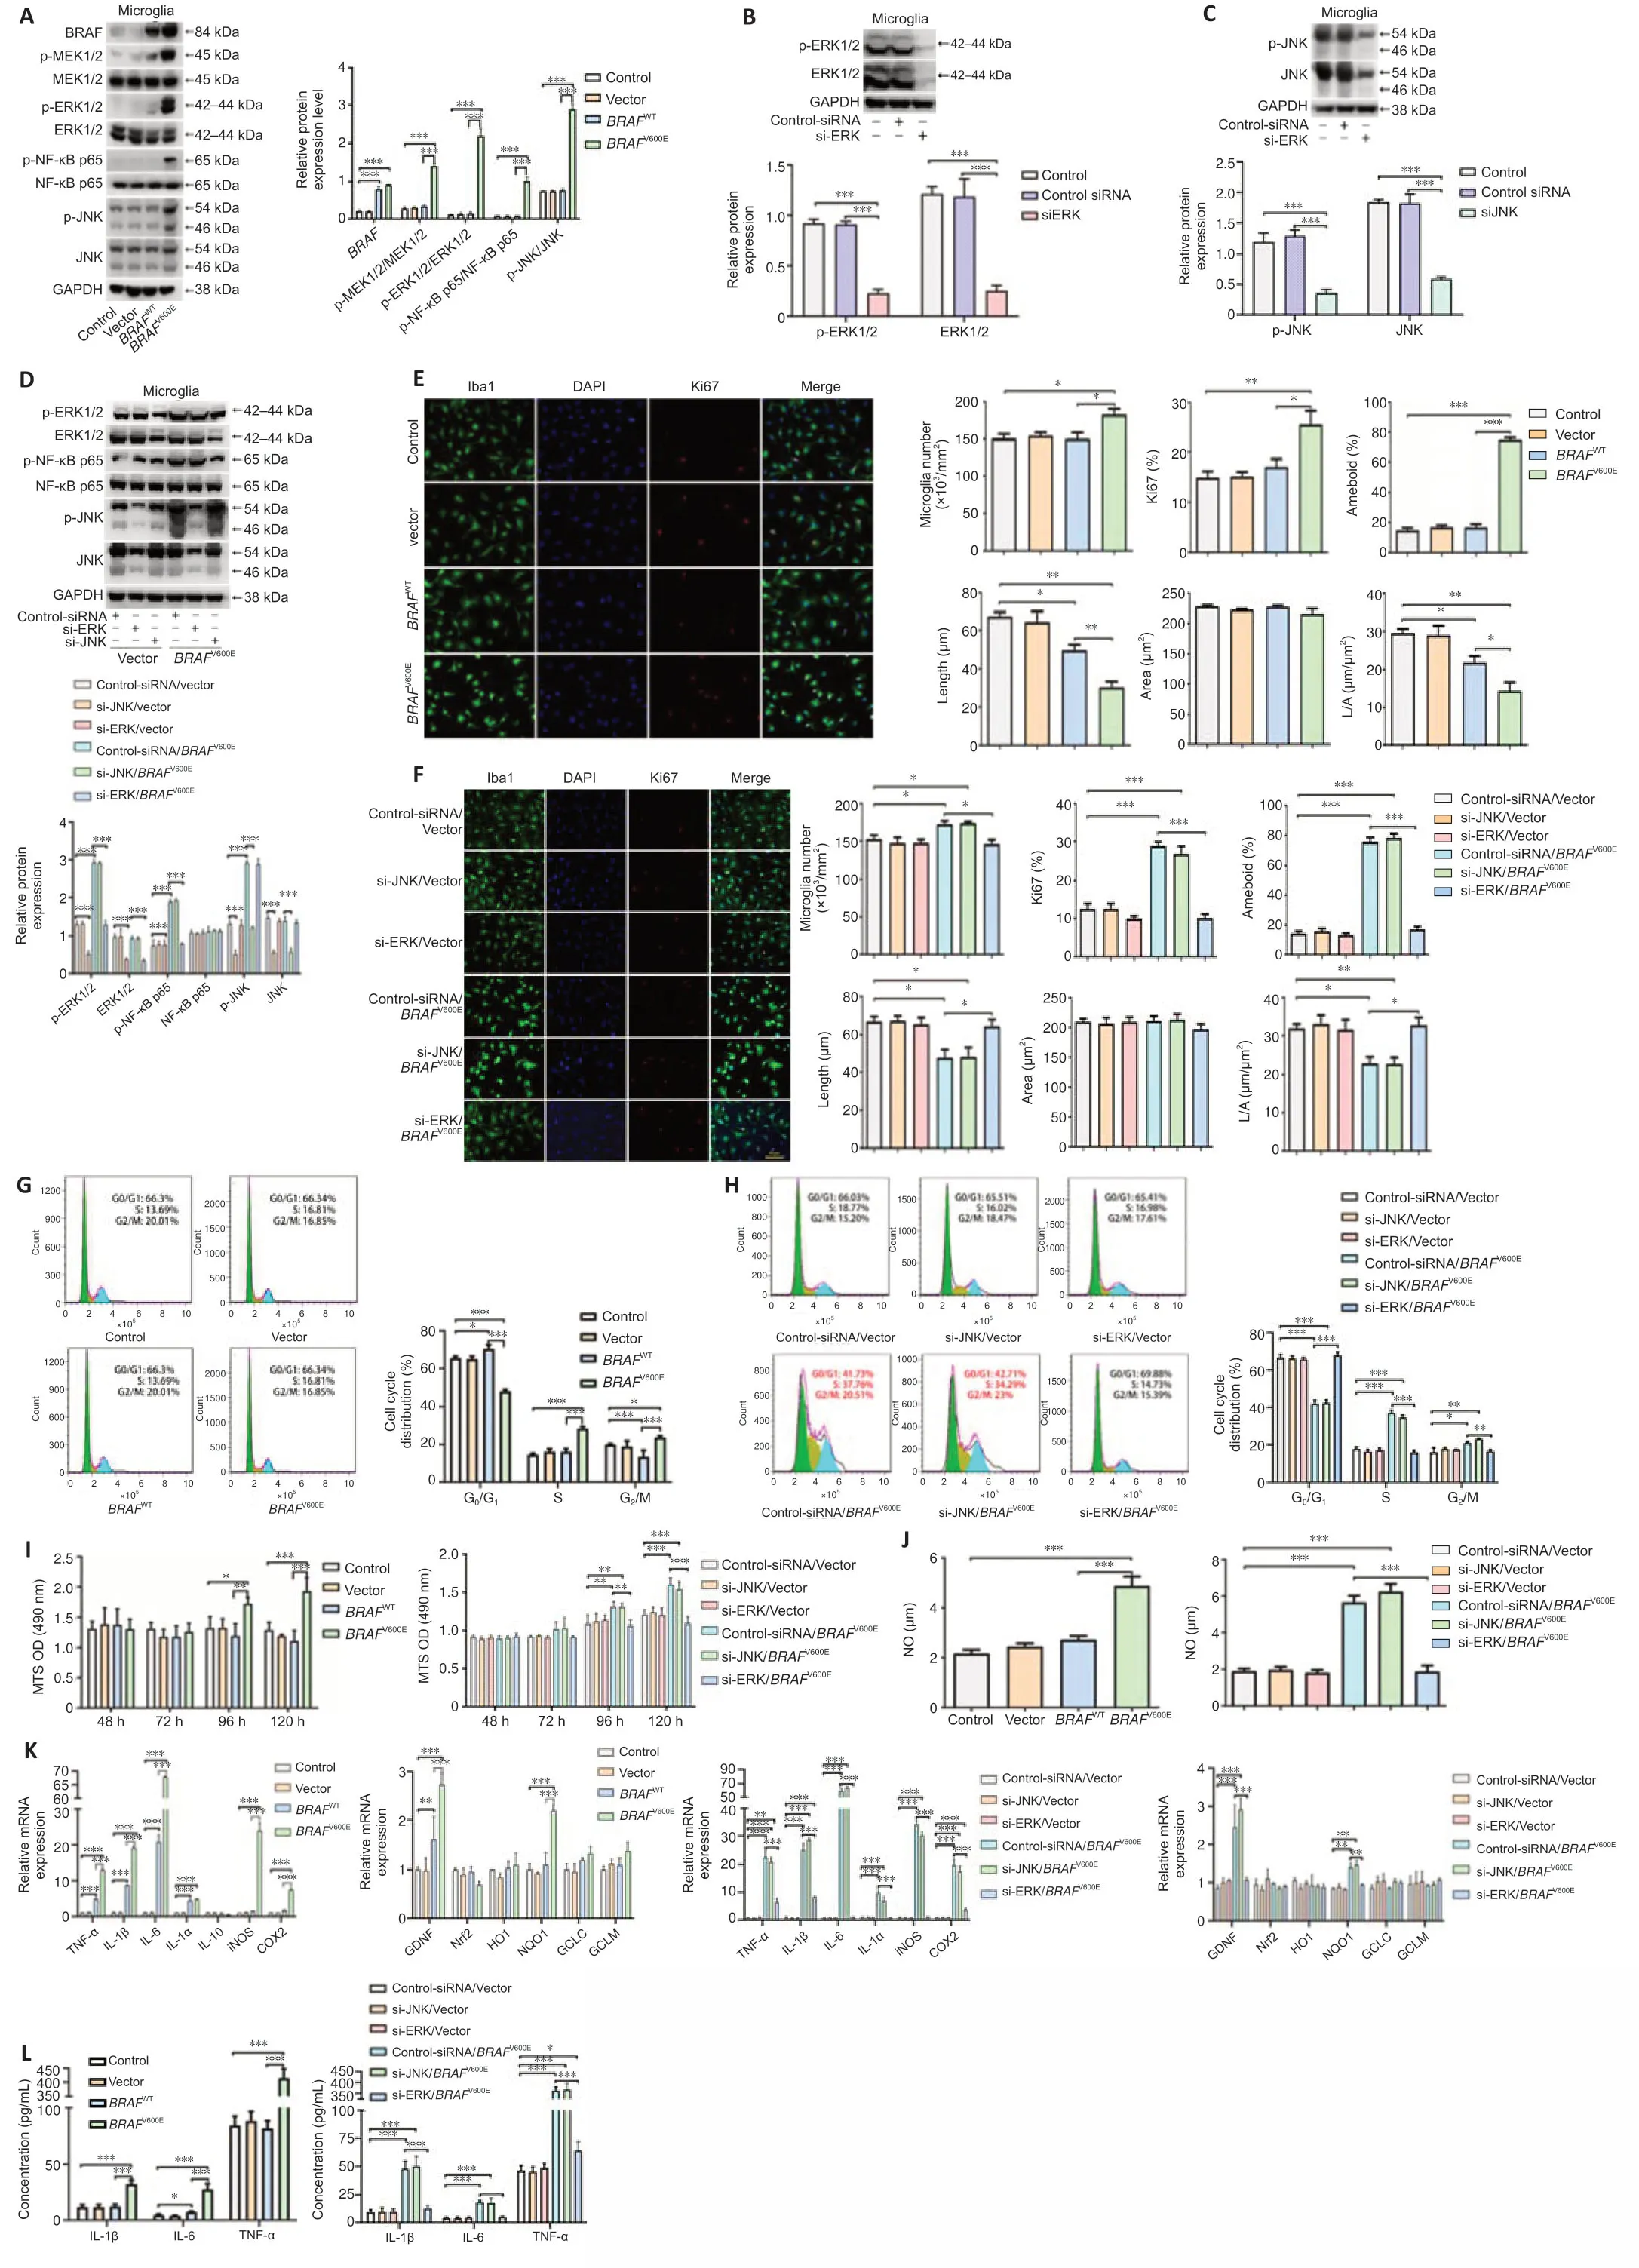
Figure 3|BRAFV600E expression in microglia induces cell proliferation and activation through ERK.
Primary cortical neurons were in parallel treated with conditioned medium from primary microglia transduced withBRAFV600E,BRAFWT,vector,or from non-transduced control cells for 72 hours.A significant decrease in the number of MAP2+cells was demonstrated in cells treated with microglia-BRAFV600Econditioned medium (P<0.001;Figure 4F).BRAFV600Econditioned medium also induced LDH release in primary neurons (Figure 4GandH).Treatment with microglia-control,microglia-vector,and microglia-BRAFWT conditioned medium did not result in changes compared to the control group (Figure 4DandF).Similar neurotoxicity was demonstrated in the microglia-BRAFV600E+si-JNK conditioned medium group,but not in the microglia-BRAFV600E+si-ERK conditioned medium group (Figure 4D,E,andH),suggesting that the indirect,toxic effects ofBRAFV600Eon neurons resulted from ERK-mediated changes in microglia.
BRAFV600E expression in neurons directly promotes cell death through the JNK pathway
To characterize direct neuronal effects ofBRAFV600E,primary cortical neurons were transduced withBRAFV600EBRAFWT,and vector for 24 hours.The cells were then cultured for 96 hours in neural culture basal medium.Western blotting confirmed BRAF overexpression and significant higher levels of p-MEK1/2,p-ERK1/2,p-JNK,caspase-3 and c-Jun in theBRAFV600E-treated group as compared with vector and non-transduced control groups (P<0.001;Figure 5A).Marked increases in c-Jun,p53,Fas-ligand (FasL),TNF-α,and B cell leukemia/lymphoma-2 (Bcl-2) associated X protein (Bax) at the mRNA level were observed after transduction withBRAFV600Efor 120 hours.Bcl-2 was significantly decreased followingBRAFV600Etransduction (P<0.05;Figure 5B).BRAFV600Einduced significant neurotoxicity as demonstrated by loss of MAP2+cells and release of LDH inBRAFV600E-transduced neurons compared with vector-and non-transduced neurons (P<0.001;Figure 5C–E).
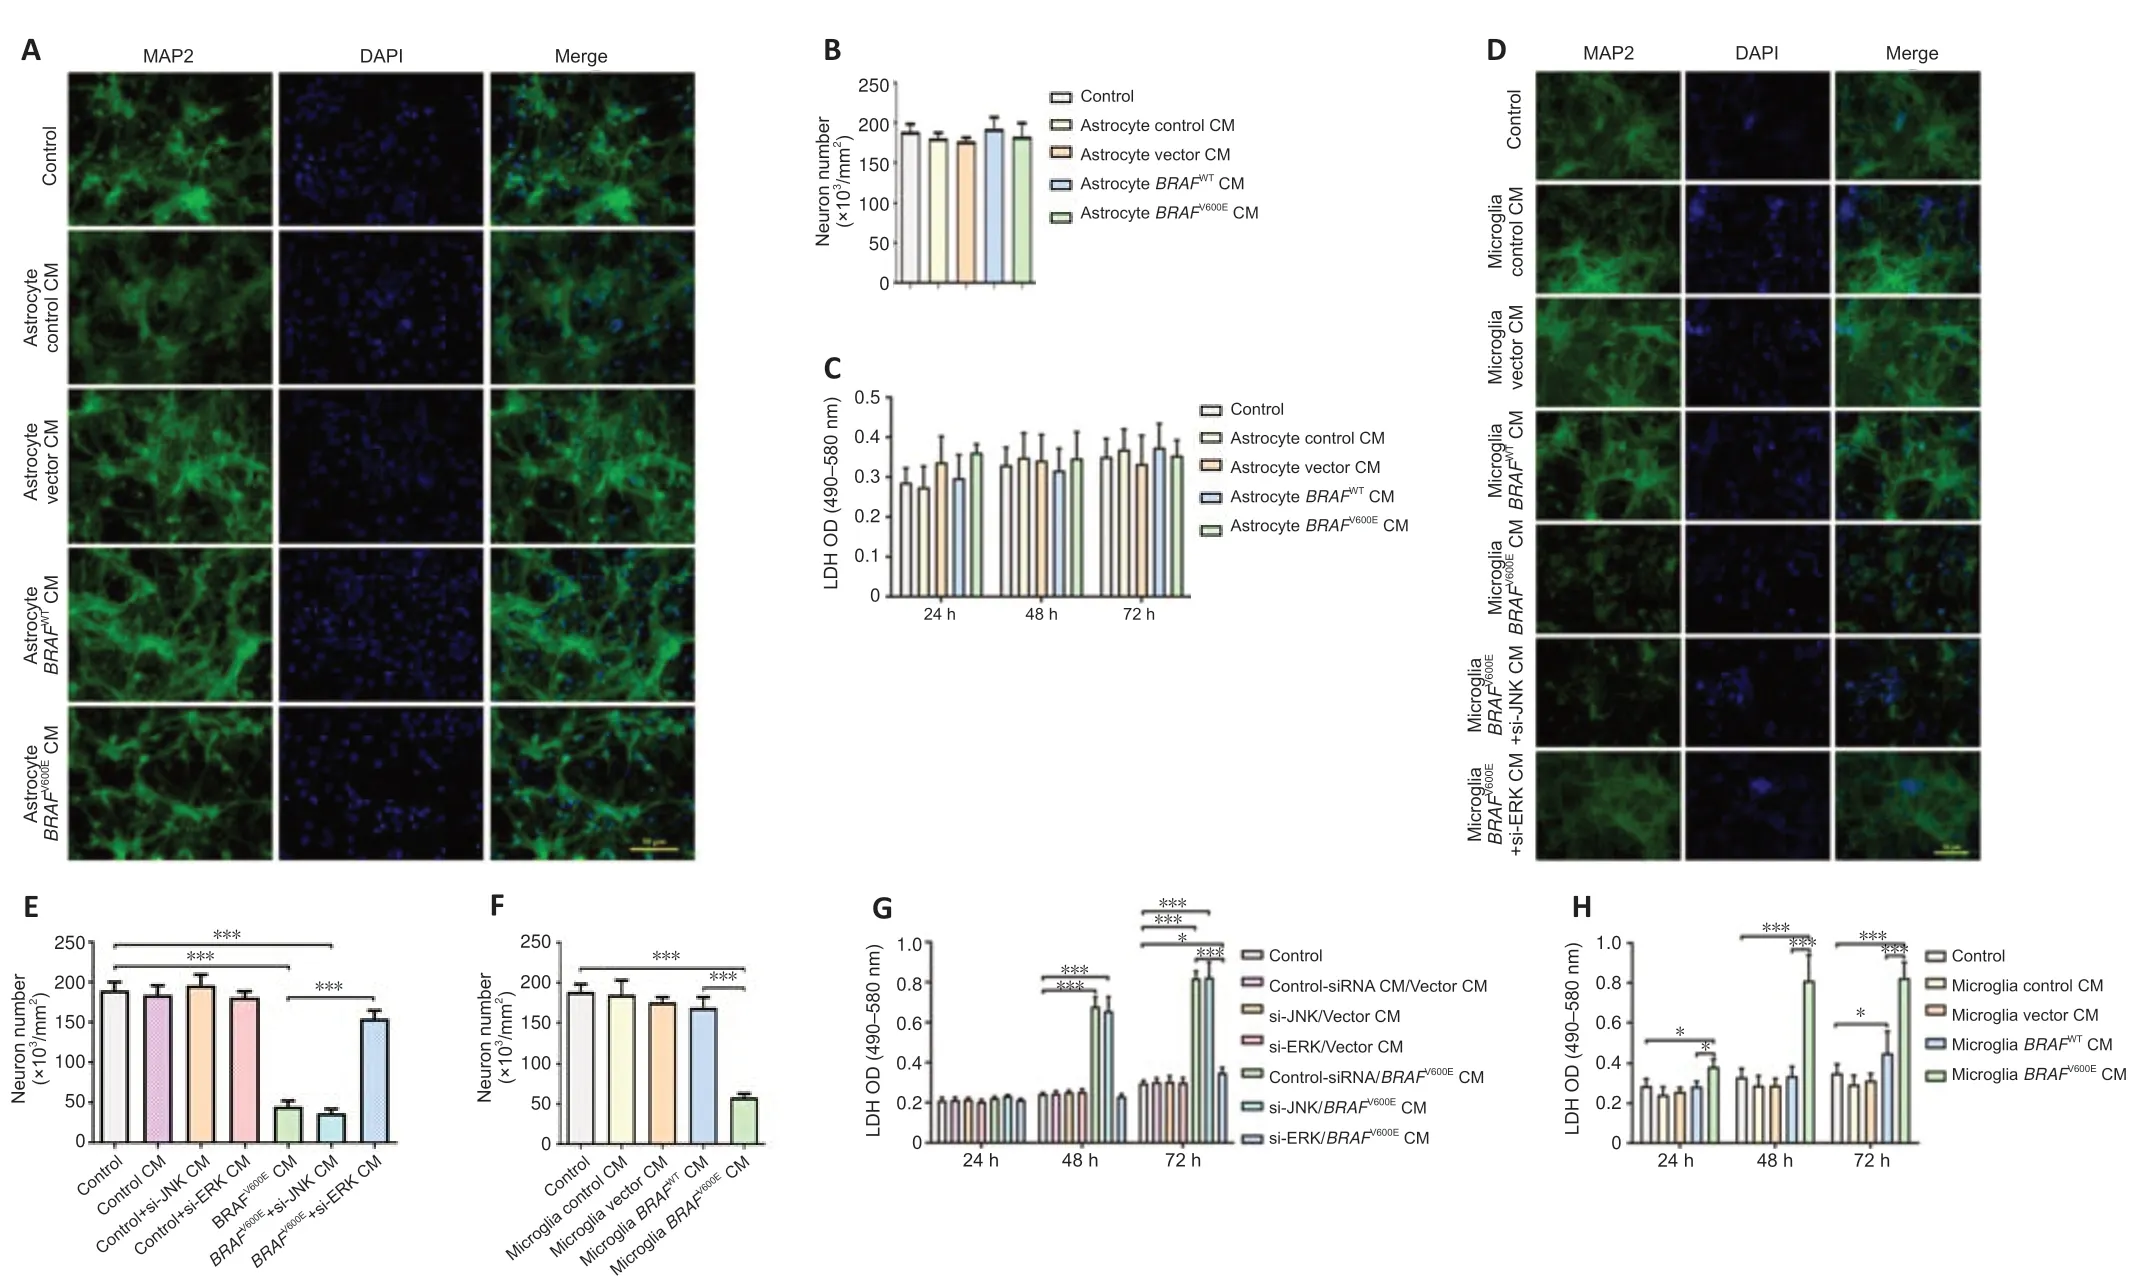
Figure 4|Conditioned medium from BRAFV600E-expressing microglial cells but not astrocytes induces neuronal cell death.
si-JNK and si-ERK were used to block signals downstream to BRAF.Knockdown efficiency of si-JNK and si-ERK was verified by western blotting(Additional Figure 3).Significantly reduced p-JNK,caspase-3,and c-Jun were demonstrated in neurons treated with si-JNK+BRAFV600Eas compared with cells treated withBRAFV600E(P<0.001;Figure 5F).At mRNA level,si-JNK reversedBRAFV600E-induced changes in c-Jun,Bax,Bcl-2,p53,Fasl and TNF-α in cultured cortical neurons (Figure 5G).Treatment with si-ERK blocked p-ERK and total ERK expression induced byBRAFV600E(Figure 5K).There was no significant difference in protein expression of p-JNK,caspase-3 and c-Jun or mRNA expression of c-Jun,Bax,Bcl-2,p53,Fasl and TNF-α betweenBRAFV600EandBRAFV600E+si-ERK groups (Figure 5HandL).These results suggest that activation of the JNK pathway byBRAFV600Eis independent ofBRAFV600E-induced ERK activation.MAP2 staining as well as LDH assay showed significantly reduced number of MAP2+cells and higher LDH release in cells transduced withBRAFV600E(P<0.001;Figure 5C–E) and the changes were parti ally reversed after co-treatment with si-JNK (P <0.01;Figure 5H–J).si-JNK also inhibited JNK in vector-transduced neurons but without significant influences on c-Jun,Bax,Bcl-2,p53,Fasl and TNF-α and neuronal survival(Figure 5FandG),which suggests that a threshold JNK activity may be required in activating downstream genes and inducing neuronal cell death in this culture system (Hollville et al.,2019).Co-treatment with si-ERK did not change MAP2+cell number and LDH release inBRAFV600E-transduced cells(Figure 5NandO).Despite reported role of ERK in neuronal survival (Hossain et al.,2013) and a trend for reduced number of MAP2+cells and increased LDH release at 120 hours,there was no statistically significant difference between si-ERK and control-siRNA treated vector-transduced neurons at thetime points investigated (Figure 5M).
Enrichment of BRAF-related genes in pathways associated with Parkinson’s disease
To explore associations of BRAF signaling with neurodegeneration,we performed GO and KEGG pathway enrichment analyses of the GDS2821 dataset,which consisted of gene expression profiles in the SN from postmortem brains of patients with Parkinson’s disease (n=16).The BRAFrelated genes were significantly enriched in chemical synaptic transmission,protein polyubiquitination,proteasome-mediated ubiquitin-dependent protein catabolic process at the BP levels;mitochondrial inner membrane,nucleus,cytoplasm at the CC levels;and protein binding,ubiquitin-protein transferase acti vity,ligase acti vity at the MF levels (Figure 6AandAdditional Table 1).KEGG pathway analysis indicated that metabolic pathways,oxidative phosphorylation,and synaptic vesicle cycle,were mostly associated with the BRAF-related genes (Figure 6BandAdditional Table 2).
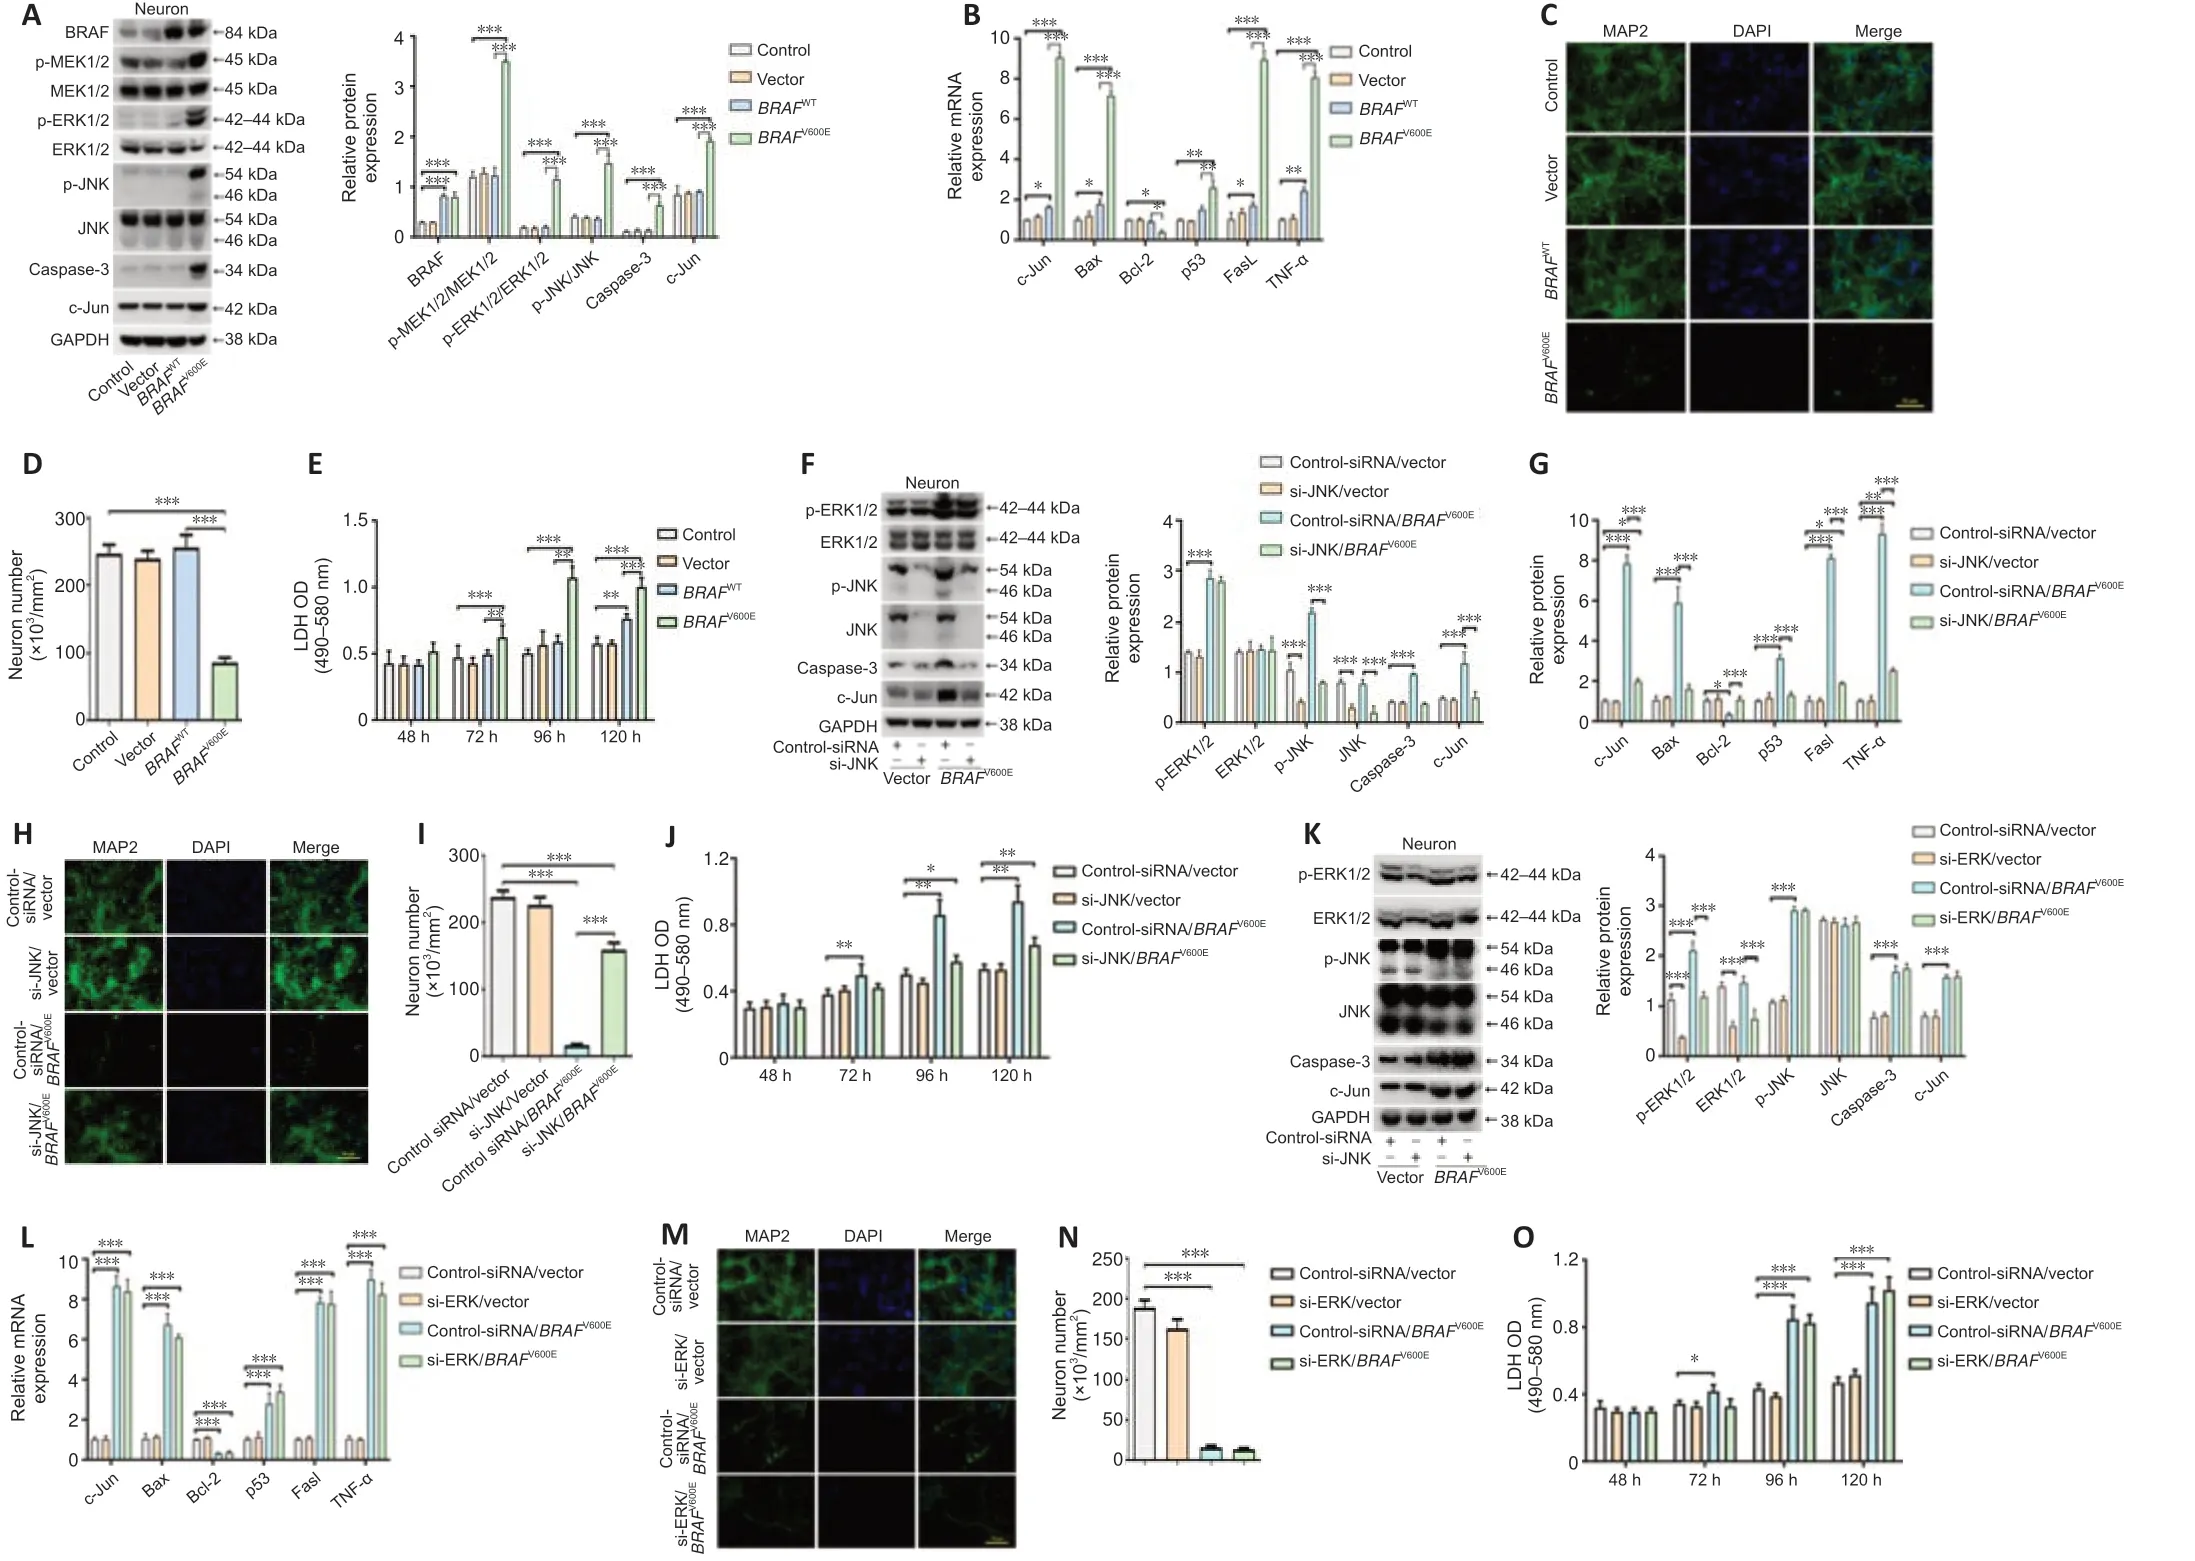
Figure 5|BRAFV600E expression in neurons promotes cell death through the JNK pathway.
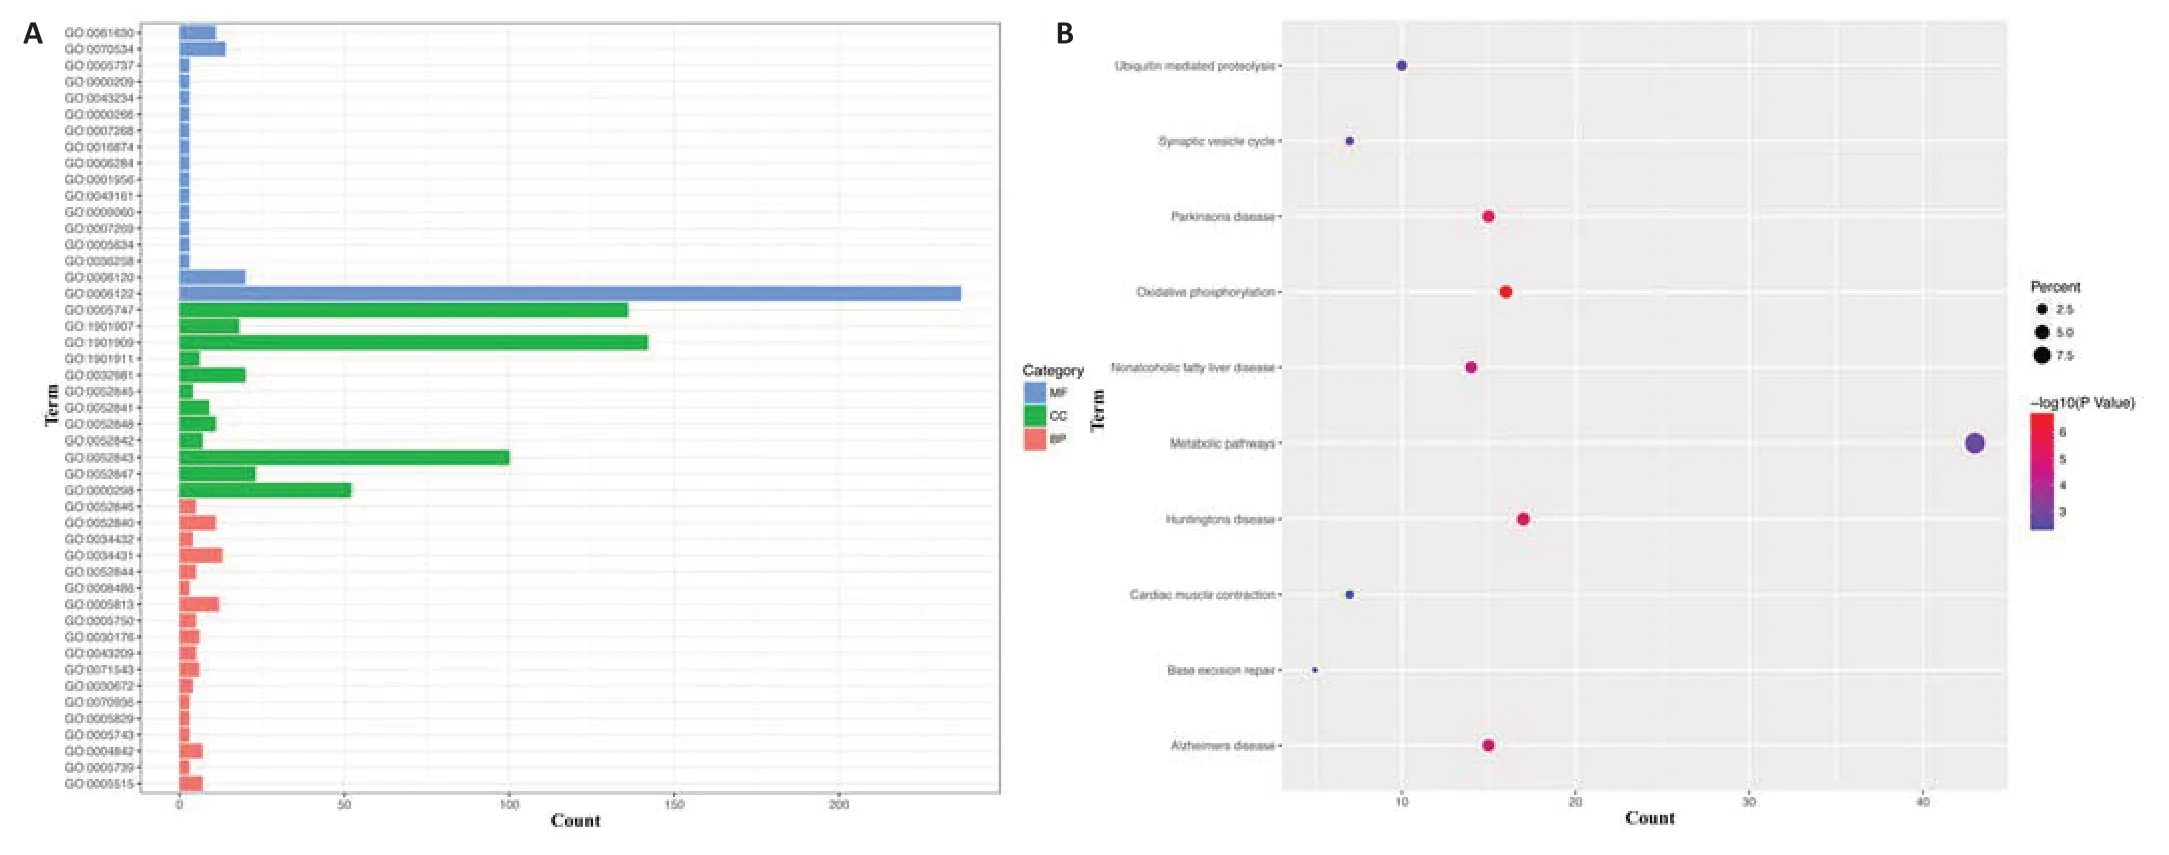
Figure 6|Enrichment of BRAF-related genes in the substanti a nigra from patients with Parkinson’s disease.
Discussion
Our study using multiplein vitrosystems provides evidence that oncogenicBRAFV600Einduces 1) proliferation and activation of microglial cells through activated ERK but not activated JNK;2) neuronal cell death directly through activated JNK but not activated ERK,and indirectly through ERK-activated microglia;3) proliferation of astrocytes.BRAFWTshowed no effects or minor effects in the same direction asBRAFV600E,suggesting either the specificity of the mutant BRAF actions or more likely,the dose effects of BRAF activation.
Normal BRAF signaling and the Ras-Raf-MEK-ERK pathway control survival,proliferation,senescence,and differentiation of cells as a result of their responses to environmental cues.BRAFV600Eand the constitutive activation of the pathway induce proliferation and cancer transformation either alone or in synergy with other oncogenic insults in a wide range of dividing cells (Robinson et al.,2010).In melanocytes,for example,BRAFV600Einduces MEK and ERK and promotes cell growth and tumorigenicity (Wellbrock et al.,2004b).In addition to malignant melanomas,BRAFV600Eis also common in primary brain tumors of glial origin including pleomorphic xanthoastrocytoma,ganglioglioma,epithelioid glioblastoma,and gliomas (Maraka and Janku,2018).Our findings thatBRAFV600Einduced proliferation of astrocytes in primary cortical mixed culture and primary astrocytes are consistent with previously reported increased cell proliferation in primary mouse astrocytes overexpressingBRAFV600Eby retrovirus transduction (Gronych et al.,2011).The overgrowing astrocytes appear to be active in producing cytokines and chemokines,neurotrophic GDNF,and activating anti -oxidant genes,at least at mRNA levels.Although physically proximalBRAFV600E-expressing astrocytes may influence neurons such as in the case of the mixed culture is unknown,neither trophic nor toxic effects were observed in neurons treated with conditioned medium from astrocytes expressingBRAFV600E.The lack of effects might be explained by the relatively small extent of ERK activation and differential changes in downstream effectors.
BRAFV600Esimilarly activated ERK in BV2 and primary microglial cells.The proliferation and activation of microglia followingBRAFV600Eexpression were demonstrated at both morphological and functional levels.Primary microglial cells expressingBRAFV600Eexhibited a classical activation state with induction of inducible NO synthase and NF-κB as well as various cytokines and chemokines such as TNF-α,IL-1 β,IL-6,superoxide,ROS,and NO.Our demonstration of the critical role of ERK in mediating microglial proliferation and activation confirms ERK as the downstream effector of theBRAFV600Eaction (Mass et al.,2017;Schreiner and Greter,2017).The proliferative and activating responses of microglial cells toBRAFV600Eexpression conveyed their impact on neuronal survival.Neurotoxicity of conditioned medium from microglial cells overexpressingBRAFV600Eis likely a result of proinflammatory cytokines and chemokines secreted by the activated microglial cells.Increased levels of TNF-α,IL-1β,and IL-6 were observed in the conditioned medium from microglial cells expressingBRAFV600E.TNF-α,IL-1β and IL-6 have been reported to play roles in triggering neuronal cell apoptosis in previous studies(Kraftet al.,2009;Zhou et al.,2016;Khan et al.,2019;Olianas et al.,2019).TNF-α induces apoptosis through TNF-α receptors via activation of several downstream signal transduction cascades involving NF-κB,JNKs,and p38 MAPK pathways (Kraftet al.,2009).
Studies from cancer,especially the melanoma field have demonstratedBRAFV600Eand altered immunity in tumor initiation and progression(Kuske et al.,2018).Particularly,macrophages may play a critical role in melanoma resistance to BRAF inhibitors (Wang et al.,2015).As the resident macrophage within CNS,microglia have long been associated with neurological pathologies.Mass et al.(2017) reported that a somaticBRAFV600Emutation in yolk-sac erythro-myeloid progenitors,which give rise to microglia during development,resulted in clonal expansion of tissue-resident macrophages,including microglia with activated ERK (Tien et al.,2012).The neurodegenerative disorder developed late in this mouse model,including synaptic loss and neuronal death,were driven by ERK-activated microglia and were preventable by BRAF inhibition.The model closely resembles lateonset neurodegenerative disease observed in patients with histiocytoses,which are clonal myeloid diseases characterized by inflammatory lesions(Ribeiro et al.,2008).Activating somatic mutations in the RAS-MEK-ERK pathway,predominantlyBRAFV600Eare strongly associated with histi ocytosis,andBRAFV600Estatus also predicts the risk of neurodegenerative complications in these conditions.ERK activation in activated microglia has also been implicated in common age-related neurodegenerative disorders such as Parkinson’s disease and Alzheimer’s disease (Sarkar et al.,2018;Chen et al.,2021).Our study further demonstratedin vitroa clear causal link betweenBRAFV600E-induced and ERK-mediated activated microglia and neuronal cell death that does not require physical proximity asin vivo.
TheBRAFV600Eexpression in neurons likewise directly caused cell death.This direct effect of the mutant BRAF on neurons,however,was not mediated by ERK but by JNK.The JNK/c-Jun pathway inBRAFV600Emelanomas is involved in adaptive responses to targeted therapy (Vin et al.,2013;Fallahi-Sichani et al.,2015).The pathway may be paradoxically upregulated following BRAF inhibitor treatment,which may promote cancer cells becoming quiescent and therefore resistant to drug-induced apoptosis.Both ERK and JNK are activated byBRAFV600Eexpression in both primary microglia and neurons in the present study.Although inhibition of endogenous ERK and JNK in vector-treated cells did not appear to affect cell survival and proliferation in either neurons or glial cells in our systems,which may be explained by the incomplete block of either using the siRNA approach,both ERK and JNK are necessary for neuronal development and maintenance,and their abnormal activation can lead to dysfunction and cell death.JNK activation in neurons is generally considered proapoptotic in various conditions (Coffey,2014;Hollville et al.,2019).A recent study reported that the JNK pathway was activated in neurotoxic amyloid pepti de Aβ42-treated neurons or neurons from a transgenic mouse model of Alzheimer’s disease,which resulted in aberrant cell cycle reentry and caused neuronal apoptosis (Dhanasekaran and Reddy,2017).ERK signaling,on the other hand,can be either protective or associated with the promotion of neuronal cell death depending on the contexts (Wellbrock et al.,2004a;Hutton et al.,2017).Growing evidence supports that activation of ERK can mediate cell death in several neuronal systems (Zhu et al.,2002;Sun and Nan,2017).BRAF itself has been shown to play an essenti al role in neuron differenti ation and axon growth (Zhong et al.,2007).BRAF activation was found to be neuroprotective through inhibition of activating transcription factor (ATF)-3 of the ATF/cAMP response element binding protein family (Chen et al.,2008).The proliferative effect in microglia-mediated by ERK and the toxic effect in neurons mediated by JNK followingBRAFV600Eexpression in our systems further highlight specific cellular contexts in dictating effectors and thus consequences of BRAF activation.
Much effort has been made in developing BRAF inhibitors for targeted cancer therapy.Consistent overall with our results that BRAF activation is neurotoxic,dabrafenib,a BRAF inhibitor,and melanoma drug,was found to inhibit c-Jun and to activate ERK,paradoxically,and to be neuroprotective in SH-SY5Y cellular and mouse models of Parkinson’s disease,though it is unknown whether the protection by dabrafenib was through direct inhibition of BRAF in neurons or indirect inhibition of activated microglia in thein vivomodels(Uenaka et al.,2018).The aforementioned mouse study showed that BRAF inhibitor PLX4720 was neuroprotective through the apparent inhibition of activated microglia (Uenaka et al.,2018).Microglial activation contributes to neurodegeneration in Parkinson’s disease.Interestingly,Parkinson’s disease and melanoma are positively linked epidemiologically (Ye et al.,2020).Our GO and KEGG analyses of Parkinson’s disease SN gene expression data indicated enrichment of the BRAF-related genes in KEGG pathways such as oxidative phosphorylation and synaptic vesicle cycle,which have been implicated in the pathophysiology of Parkinson’s disease (Nemani et al.,2010;Iglesias et al.,2018).
Strengths and limitations
Our study characterizedBRAFV600Eon cell death and proliferation in neurons,astrocytes,and microglia.The direct and indirect impact ofBRAFV600Eon neurons and downstream mediators were identified.Multiple primary cultures and cell lines were employed.However,several limitations should be noted.First,the clinical relevance of our analysis of the human data may be limited by the relatively small size of the database and the lack of data from control individuals without neurological conditions.Second,our study used cellular models only.To better understand the role of BRAF in the CNS and Parkinson’s disease-melanoma link,it will be necessary to employ bothin vitroandin vivomodels in future studies.Further,whether the expression levels of BRAF and related genes are altered in Parkinson’s disease patients is unknown.
Conclusions
Our study identifies distinct outcomes mediated by distinct downstream effectors in dividing glial cells and in neuronsin vitrofollowing the same oncogenic BRAF mutational activation.While BRAF activation in dividing cells has been extensively studied,we are just beginning to understand possibly an important role of BRAF in neurons and neurological disorders as a result of either dysregulated BRAF in neurons or its impact on dividing cells such as microglia.Future studies should aim to further decipher interactions between neurons and glia in response to BRAF alterations at molecular levels and to explore the BRAF pathway targeting as a therapeutic strategy for neurological diseases.
Author contributions:Study conception,organization,and execution,stati stical analysis,writing of the first draft and review and criti que of the manuscript: QY.Study execution,stati stical analysis,and writing of the first draft of the manuscript: PS.Stati stical analysis and writing of the first draft of the manuscript: NAK.Study conception,organization,and review andcriti que of the manuscript: XC.All authors approved the final version of this manuscript.
Conflicts of interest:The authors declare that they have no known competing financial interests or personal relationships that could have appeared toinfluence the work reported in this paper.
Author statement:This paper has been posted as a preprint on ResearchSquare with DOI: 10.21203/rs.3.rs-220057/v2,which is available from: https://www.researchsquare.com/article/rs-220057/v1.
Availability of data and materials:The datasets used and/or analyzed during the current study are available at open-access repository through https://doi.org/10.5281/zenodo.5931188.
Open access statement:This is an open access journal,andarticles are distributed under the terms of the Creative Commons AttributionNonCommercial-ShareAlike 4.0 License,which allows others to remix,tweak,and build upon the work non-commercially,as long as appropriate credit is given and the new creations are licensed under the identical terms.
Additional files:
Additional Figure 1:BRAFV600E expression in BV2 cells induces cell proliferation and activation through ERK.
Additional Figure 2:Conditioned medium from BRAFV600E-expressing BV2 cells induces neuronal cell death.
Additional Figure 3:Knockdown efficiency of siERK and si-JNK in primary cortical neurons.
Additional Table 1:GO enrichment analysis of BRAF-related genes.
Additional Table 2:KEGG pathway enrichment analysis of BRAF-related genes.

- 中国神经再生研究(英文版)的其它文章
- Bystanders or not? Microglia and lymphocytes in aging and stroke
- Alzheimer’s disease risk after COVID-19: a view from the perspective of the infecti ous hypothesis of neurodegeneration
- Serine and arginine rich splicing factor 1: a potenti al target for neuroprotection and other diseases
- Can glial cells save neurons in epilepsy?
- Lights for epilepsy: can photobiomodulation reduce seizures and offer neuroprotection?
- The landscape of cognitive impairment in superoxide dismutase 1-amyotrophic lateral sclerosis