
A nanoparticle formation model considering layered motion based on an electrical explosion experiment with Al wires
2023-03-09 05:45JiangboZHANG张江波HongxuGAO高红旭FeiXIAO肖飞WeiLIU刘威TaixinLIANG梁泰鑫andZhongliangMA马中亮
Plasma Science and Technology 2023年1期
关键词:江波
Jiangbo ZHANG(张江波),Hongxu GAO(高红旭),Fei XIAO(肖飞),Wei LIU(刘威),Taixin LIANG(梁泰鑫) and Zhongliang MA(马中亮)
1 School of Environmental and Safety Engineering,North University of China,Taiyuan 030051,People’s Republic of China
2 Xi’an Modern Chemistry Research Institute,Xi’an 710065,People’s Republic of China
Abstract To study the evolution of nanoparticles during Al wire electrical explosion,a nanoparticle formation model that considered layered motion was developed,and an experimental system was set up to carry out electrical explosion experiments using 0.1 mm and 0.2 mm Al wires.The characteristic parameters and evolution process during the formation of nanoparticles were calculated and analyzed.The results show that the maximum velocities of the innermost and outermost layers are about 1200 m·s−1 and 1600 m·s−1,and the velocity of the middle layer is about 1400 m·s−1,respectively.Most of the nanoparticles are formed in the temperature range of 2600 K–2500 K.The characteristic temperature for the formation of Al nanoparticles is ∼2520 K,which is also the characteristic temperature of other parameters.The size distribution range of the formed nanoparticles is 18 to 110 nm,and most of them are around 22 nm.The variation of saturated vapor pressure determines the temperature distribution range of particle nucleation.There is a minimum critical diameter of particles(∼25 nm);particles smaller than the critical diameter can grow into larger particles during surface growth.Particle motion has an effect on the surface growth and aggregation process of particles,and also on the distribution area of larger-diameter particles.The simulation results are in good agreement with the experiments.We provide a method to estimate the size and distribution of nanoparticles,which is of great significance to understand the formation process of particles during the evolution of wire electrical explosion.
Keywords:electrical explosion,nanoparticles,numerical model,layered motion,aluminum wire
1.Introduction
Nanoparticles have excellent physical,chemical,mechanical and thermodynamic properties due to their surface atomic characteristics[1–9].The preparation of nanoparticles by electrical explosion of metal wire in ambient gas has the advantage of high purity and avoids the formation of residual products.However,the formation process of nanoparticles during wire electrical explosion is very complex as it includes Joule heating,vaporization of metal wire,coagulation and the growth process of nanoparticles,which is not fully understood.Considerable attention has been devoted to study to explain the physical mechanism of wire electrical explosion and to simulate the formation process of nanoparticles[10–12].
Al nanoparticles have important applications in a variety of fields,e.g.explosives[13],propellants[14–16],electronics[17]and detection of biomolecules[18].Lerneret al[19]investigated the electrical explosion process of Al wires in Ar and N,and synthesized Al and Al/AlN composite nanoparticles.They proposed a nanoparticle formation mechanism that is caused by the condensation of primary particles produced in the early stages of wire electrical explosions.Baiet al[20]studied the electrical explosion characteristics of Al wire in ambient gas and considered that the explosion process in Ar has longer breakdown development time and greater deposition energy than that in He.It can be seen that Ar is more suitable as a protective gas in Al wire electrical explosion,and is more widely used.
Researchers have developed numerical models to study the formation of nanoparticles.Sindhuet al[21]used the node technique to solve the general dynamics equation(GDE)of a non-reactive system,simulated the formation of nanoparticles in the process of wire electric explosion and gave the size distribution of nanoparticles.However,in their model,it is assumed that the explosion products are evenly dispersed in the surrounding gas medium,rather than concentrated in the limited volume range affected by the explosion wire.Prakashet al[22]studied a method that used node technology to solve the GDE(involving classical nucleation,surface growth/evaporation and coagulation)in Al aerosol,and analyzed the formation process of nanoparticles.Friedlanderet al[23]established a nucleation condensation moment model for stable aerosol formation,ignoring the condensation when the monomer concentration is relatively low.Baiet al[24]established a model of electrical explosion of Al wire in Ar by considering the growth and size distribution of nanoparticles.Shiet al[25]established a numerical model of the nanoparticle formation process,which was based on the dynamic nucleation rate and moment method to describe the formation and growth of particles by nucleation and condensation.The model takes into account the effects of ion-induced nucleation and homogeneous nucleation,the condensation between nanoparticles in the liquid phase and the latent heat of liquidation.It should be noted that these methods do not include the whole growth process of nanoparticles originating from the explosion of a metal wire,especially the movement process of explosion products.
In this paper,a nanoparticle formation model that considered layered motion was developed,and an experimental system was set up to carry out electrical explosion experiments using 0.1 mm and 0.2 mm Al wires.The characteristic parameters and evolution process during the formation of nanoparticles were calculated and analyzed.
2.Experimental setup
A schematic diagram of the Al wire electrical explosion experimental setup is shown in figure 1.The ambient gas in the container is Ar.Al wires of 0.1 mm diameter and 8 cm length,and 0.2 mm diameter and 8 cm length,are used in the experiments to form nanoparticles.The pulsed power source is a capacitor bank of 25 μF supplied by a high-voltage DC charging power supply.The voltage across the wire is measured by a Tektronix highvoltage probe(Tektronix,P6015A,1000:1)and the current is measured by a self-made air-core Rogowski coil calibrated with a commercial Pearson coil no.101(0.01 V/A,4 MHz).
For the collection of formed metal nanoparticles during the experiments,several monocrystalline silicon wafers are fixed between the backflow columns,and the nanoparticles were deposited on the surface of these wafers.The morphology and size of the nanoparticles are measured by a scanning electron microscope(SEM,Keyence VE-9800S).
3.Model
A schematic diagram of the Al wire electrical explosion model considered in this paper is shown in figure 2.We assume that the Al wire is divided intonlayers,one next to the other,moving in the direction of expansion in an electrical explosion.With the expansion process,the windward area per unit mass of each layer of Al wire increases and the expansion velocity also changes,which will affect the formation process of nanoparticles.The model is composed of the following parts.
3.1.Motion model
In[25],the motion model of particle formation is considered under the conditions of uniform motion.Obviously,this is different from the formation process in the experiment.We assume that the material in each layer has the same properties and deal with the motion of the particles using the Lagrange method.The pressure difference(Δpn)between the surface of thenth layer and the axis is different,and the equation[24]is written as
whereμ0is the magnetic permeability of vacuum,is the average current density in the initial wire,Iis the current flowing through the wire,R0is the radius of the wire,andRnis the distance between thenth layer and the axis,as shown in figure 2.
As the wire expands,the average current density decreases because the current remains constant,and the equation is written as
In this paper,we assume that all the particles in each layer are spherical in shape and have the same diameter.Thus,the particle motion during the expansion of the wire is given by
The formed particles will collide with each other due to Brownian motion,which results in the coagulation process[26].By considering the velocity of each layer,the modified collision frequency function between two rigid elastic spheres can be written as
whereviandvjare the volume of the particles on nodesiandj,respectively.
3.2.Dynamics of Al nanoparticle formation
In the expansion process of electric explosion,due to the collision with the surrounding gas,the temperature of atomic vapor clusters decreases rapidly.The electric explosion temperature is calculated according to the model in[27],when the temperature is lower than the boiling point of Al,which triggers the growth process of homogeneous nucleation,coagulation and surface growth of particles[28,29].The number and size of nanoparticles change due to these growth processes,which conforms to the GDE model[26].Therefore,the change rate of the number concentration of nanoparticles at the nodekth(Nk)[22]is expressed as
where the subscripts nu,su and co represent the nucleation,surface growth and coagulation process,respectively.
The parameters in the model have been discussed in detail in our previous work[27].Here,we will present a brief overview of the model.
Under the influence of the homogeneous nucleation process,the change rate of the particle number concentration is written as
Under the influence of the coagulation process,the change rate of the particle number concentration is written as
Under the influence of the surface growth process,the change rate of the particle number concentration is written as
By combining equations(6),(8)and(10),the change rate of the particle number concentration expressed in equation(5)can be obtained.
The distribution of nanoparticles in each of thenlayers is calculated using the cycling method,and then their average value at each node is also calculated.During the simulation,the whole formation process of particles is performed simultaneously at every temperature that is decided by the time step.The simulation parameters are listed in table 1.
4.Results and discussion
4.1.Experimental results
The capacitor is charged to 10 kV in the experiments,corresponding to a stored energy of 1.25 kJ.The total energy deposition is ∼0.85 kJ,corresponding to 68% of the initial stored energy,as shown in figure 3(a).The energy density needed for complete vaporization of Al wire is∼32.9 J·mm−3.Therefore,the vaporization energies of Al wires with diameters of 0.1 mm and 0.2 mm are 20.6 J and 82.6 J,corresponding to 1.65% and 6.61% of the initial energy storage and 2.42% and 9.72% of the total energy deposition,respectively.The vaporization energy of the load is much smaller than the total energy deposition in the discharge process.
Figure 3(a)shows the currents and voltages of the 0.1 mm Al wire electrical explosion.The current curve is smooth and the peak current is ∼28 kA.The discharge duration is ∼2 μs,and the discharge curve of the 0.2 mm Al wire is similar to this,as shown in figure 3(b).The corresponding deposition energy is about 6 J at the beginning of the 0.1 mm wire electrical explosion,and about 23 J at the beginning of arc ignition,as shown in the partial magnification in figure 3(a).The corresponding deposition energy is about 15 J at the beginning of the 0.2 mm wire electrical explosion and about 65 J at arc ignition,as shown in the partial magnification in figure 3(b).In the process of discharge,the vaporization of the Al wire is rapid enough to form a dense gaseous layer around the wire,which suppresses the electron avalanche along the wire surface.Then,an arcdischarge or restrike takes place inside the exploding Al wire as it expands to a larger diameter and the density decreases[30].This discharge process is consistent with the typical current pause process in wire electrical explosion[31].The fluctuation of the discharge curve reflects the instability of the dense core development during electrical explosion[32–35],as shown in the partial magnification in figure 3.To simplify the calculation,a half-peak current of 14 kA is used in the simulation according to our established model.
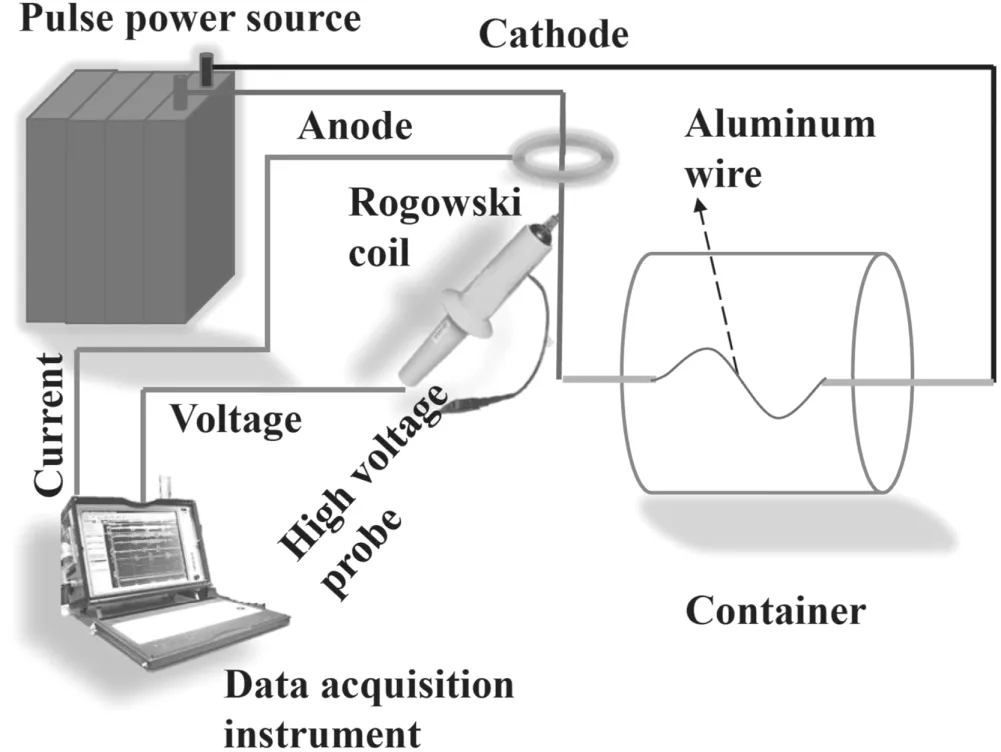
Figure 1.A schematic diagram of the Al wire electrical explosion experimental setup.
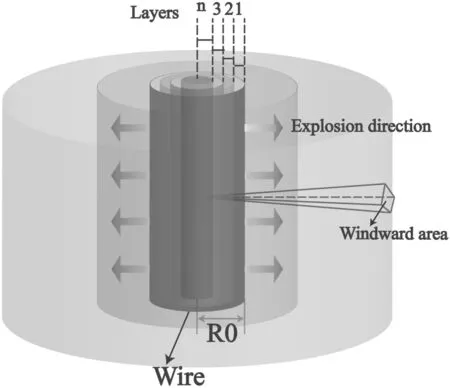
Figure 2.A schematic diagram of the Al wire electrical explosion model.
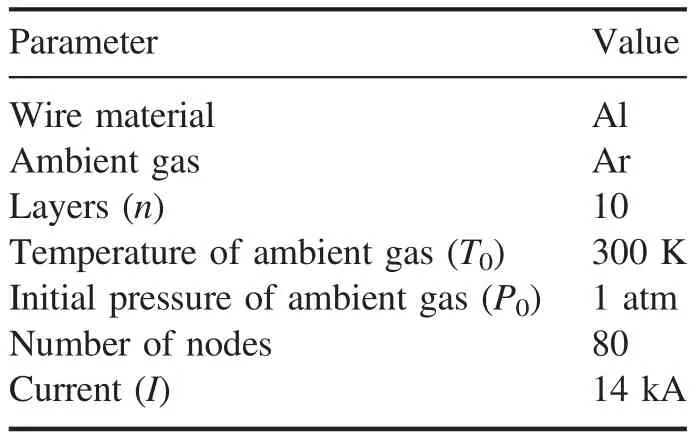
Table 1.Simulation parameters.
The nanoparticles that are formed have quite different size distributions.Figure 4 shows the SEM images and frequency count of nanoparticles formed from the 0.1 mm and 0.2 mm Al wires.In the electrical explosion particle products of the 0.1 mm Al wire,few nanoparticles produce an aggregation phenomenon,and most of the nanoparticles are generally spherical in shape,with relatively sparse distribution density generally,as shown in figure 4(a).Most of the nanoparticles are generally spherical in shape,and the size of the nanoparticles is obviously larger,with relatively large distribution density generally,as shown in figure 4(b)for the electrical explosion particle products of the 0.2 mm Al wire.
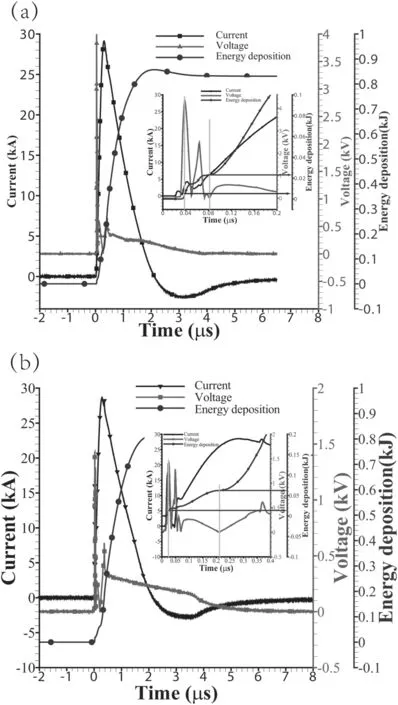
Figure 3.Measured currents and voltages of 0.1 mm(a)and 0.2 mm(b)Al wire electrical explosions.
The reliability of the distribution is ensured by counting the diameter of more than 150 particles for each sample,which is often used to count the diameters of nanoparticles[12,31].The particle diameter distribution of the 0.1 mm Al wire electrical explosion products is approximately lognormal distribution,with the diameter distribution ranging from 5 to 50 nm,and the central axis is located at ∼25 nm.The particle diameter distribution of the 0.2 mm Al wire electrical explosion products is approximately log-normal distribution,with the diameter distribution ranging from 20 to 110 nm,mainly concentrated between 35 nm and 50 nm,and the most probable diameter is ∼40 nm.In Al wire electrical explosion,with the increase in Al wire diameter,the distribution density,size and distribution range of nanoparticles increase.
In the following sections,the electrical explosion process of the 0.1 mm Al wire is calculated and analyzed.
4.2.Movement characteristics
The radial velocity distribution of particles in each layer is shown in figure 5(a).The maximum velocities of the innermost and outermost layers are about 1200 m·s−1and 1600 m·s−1,and the velocity of the middle layer is about 1400 m·s−1,respectively.In[25],experiments are carried out on the electrical explosion of Al wire with a diameter of 0.1 mm.The average maximum velocity of particles in the explosion is about 1500 m·s−1,and the motion process is assumed to be the average velocity of particles.This shows that the calculation model is in good agreement with the experimental results in[25].
As seen in figure 5,the maximum velocity of each layer increases continuously from the outer layer to the inner layer,and the velocity of each layer tends to be the same after a period of time.In the process of electrical explosion,because the velocity of each layer is higher than the sound velocity,the shock wave is generated in the expansion process,which is consistent with the shock wave phenomenon observed in the experiments of electrical explosion of metal wire[36–39].
Figure 5(b)shows the variation of particle velocity with time in each layer.The particle velocity first increases,reaches its maximum value at about 1 μs,then decreases,and tends to be stable as time increases.The travel of the movement increases with the increase in time,and the increase decreases gradually,as shown in figure 5(c).
Figure 5(d)shows the distribution of particle velocity in each layer at different temperatures.As the temperature decreases from the boiling point of Al to its melting point(933 K),the change in particle velocity in each layer is different.Although there is a large difference in the change range of the maximum velocity of particles,when the temperature reaches about 2600 K,the velocities of all particles are generally the same,and their change trend is generally the same with the continuous decline of temperature.At the beginning of electrical explosion,the velocity dispersion of particles is large,which has a great impact on the growth process of particles,but the duration of this process is short.During the rest of the time,the velocities of all the particles are generally the same,and the influence on the growth process of particles is similar.
4.3.Characteristic parameters with temperature
As shown in figure 6(a),the saturated vapor pressure drops sharply at the beginning and slightly after reaching ∼2400 K.The saturated vapor ratio and nucleation rate are in the shape of a parabola,and the central axis is at ∼2520 K and reaches the maximum,which are ∼2.55 and ∼1024m−3·s−1,respectively,as shown in figures 6(b)and(c).Therefore,the main nucleation temperature range of nanoparticles is 2600 K–2400 K,concentrated near 2520 K.
The average diameter of the formed nuclei presents a positive parabolic shape with the axial position of ∼2520 K and the corresponding minimum value of ∼18 nm,as shown in figure 6(d).The axial positions of figures 6(b)and(c)correspond to the temperature of ∼2520 K,presenting inverted and forward parabolic shapes,respectively.This indicates that when the nucleation rate is maximum,the average diameter of the particles formed is minimum,and the nucleation process is dominant at this time.
When the temperature is higher than ∼2520 K,the supersaturated vapor is in critical equilibrium,and the number of monomers generally does not change.When the temperature is lower than ∼2520 K,the critical state of supersaturated vapor is unstable and the homogeneous nucleation process begins.Also,the number of monomers is consumed greatly,which continues to the end,as shown in figure 6(e).
At temperatures below 2600 K,nanoparticles begin to form,and the curve rises steeply until 2500 K,after which the curve is almost straight until the end,as shown in figure 6(f).Most of the nanoparticles are formed in the temperature range of 2600–2500 K.Figure 6(g)shows the number of nanoparticles with different diameters.The formed nanoparticles’diameter distribution ranges from 18 to 110 nm,and most of them are distributed near 22 nm.
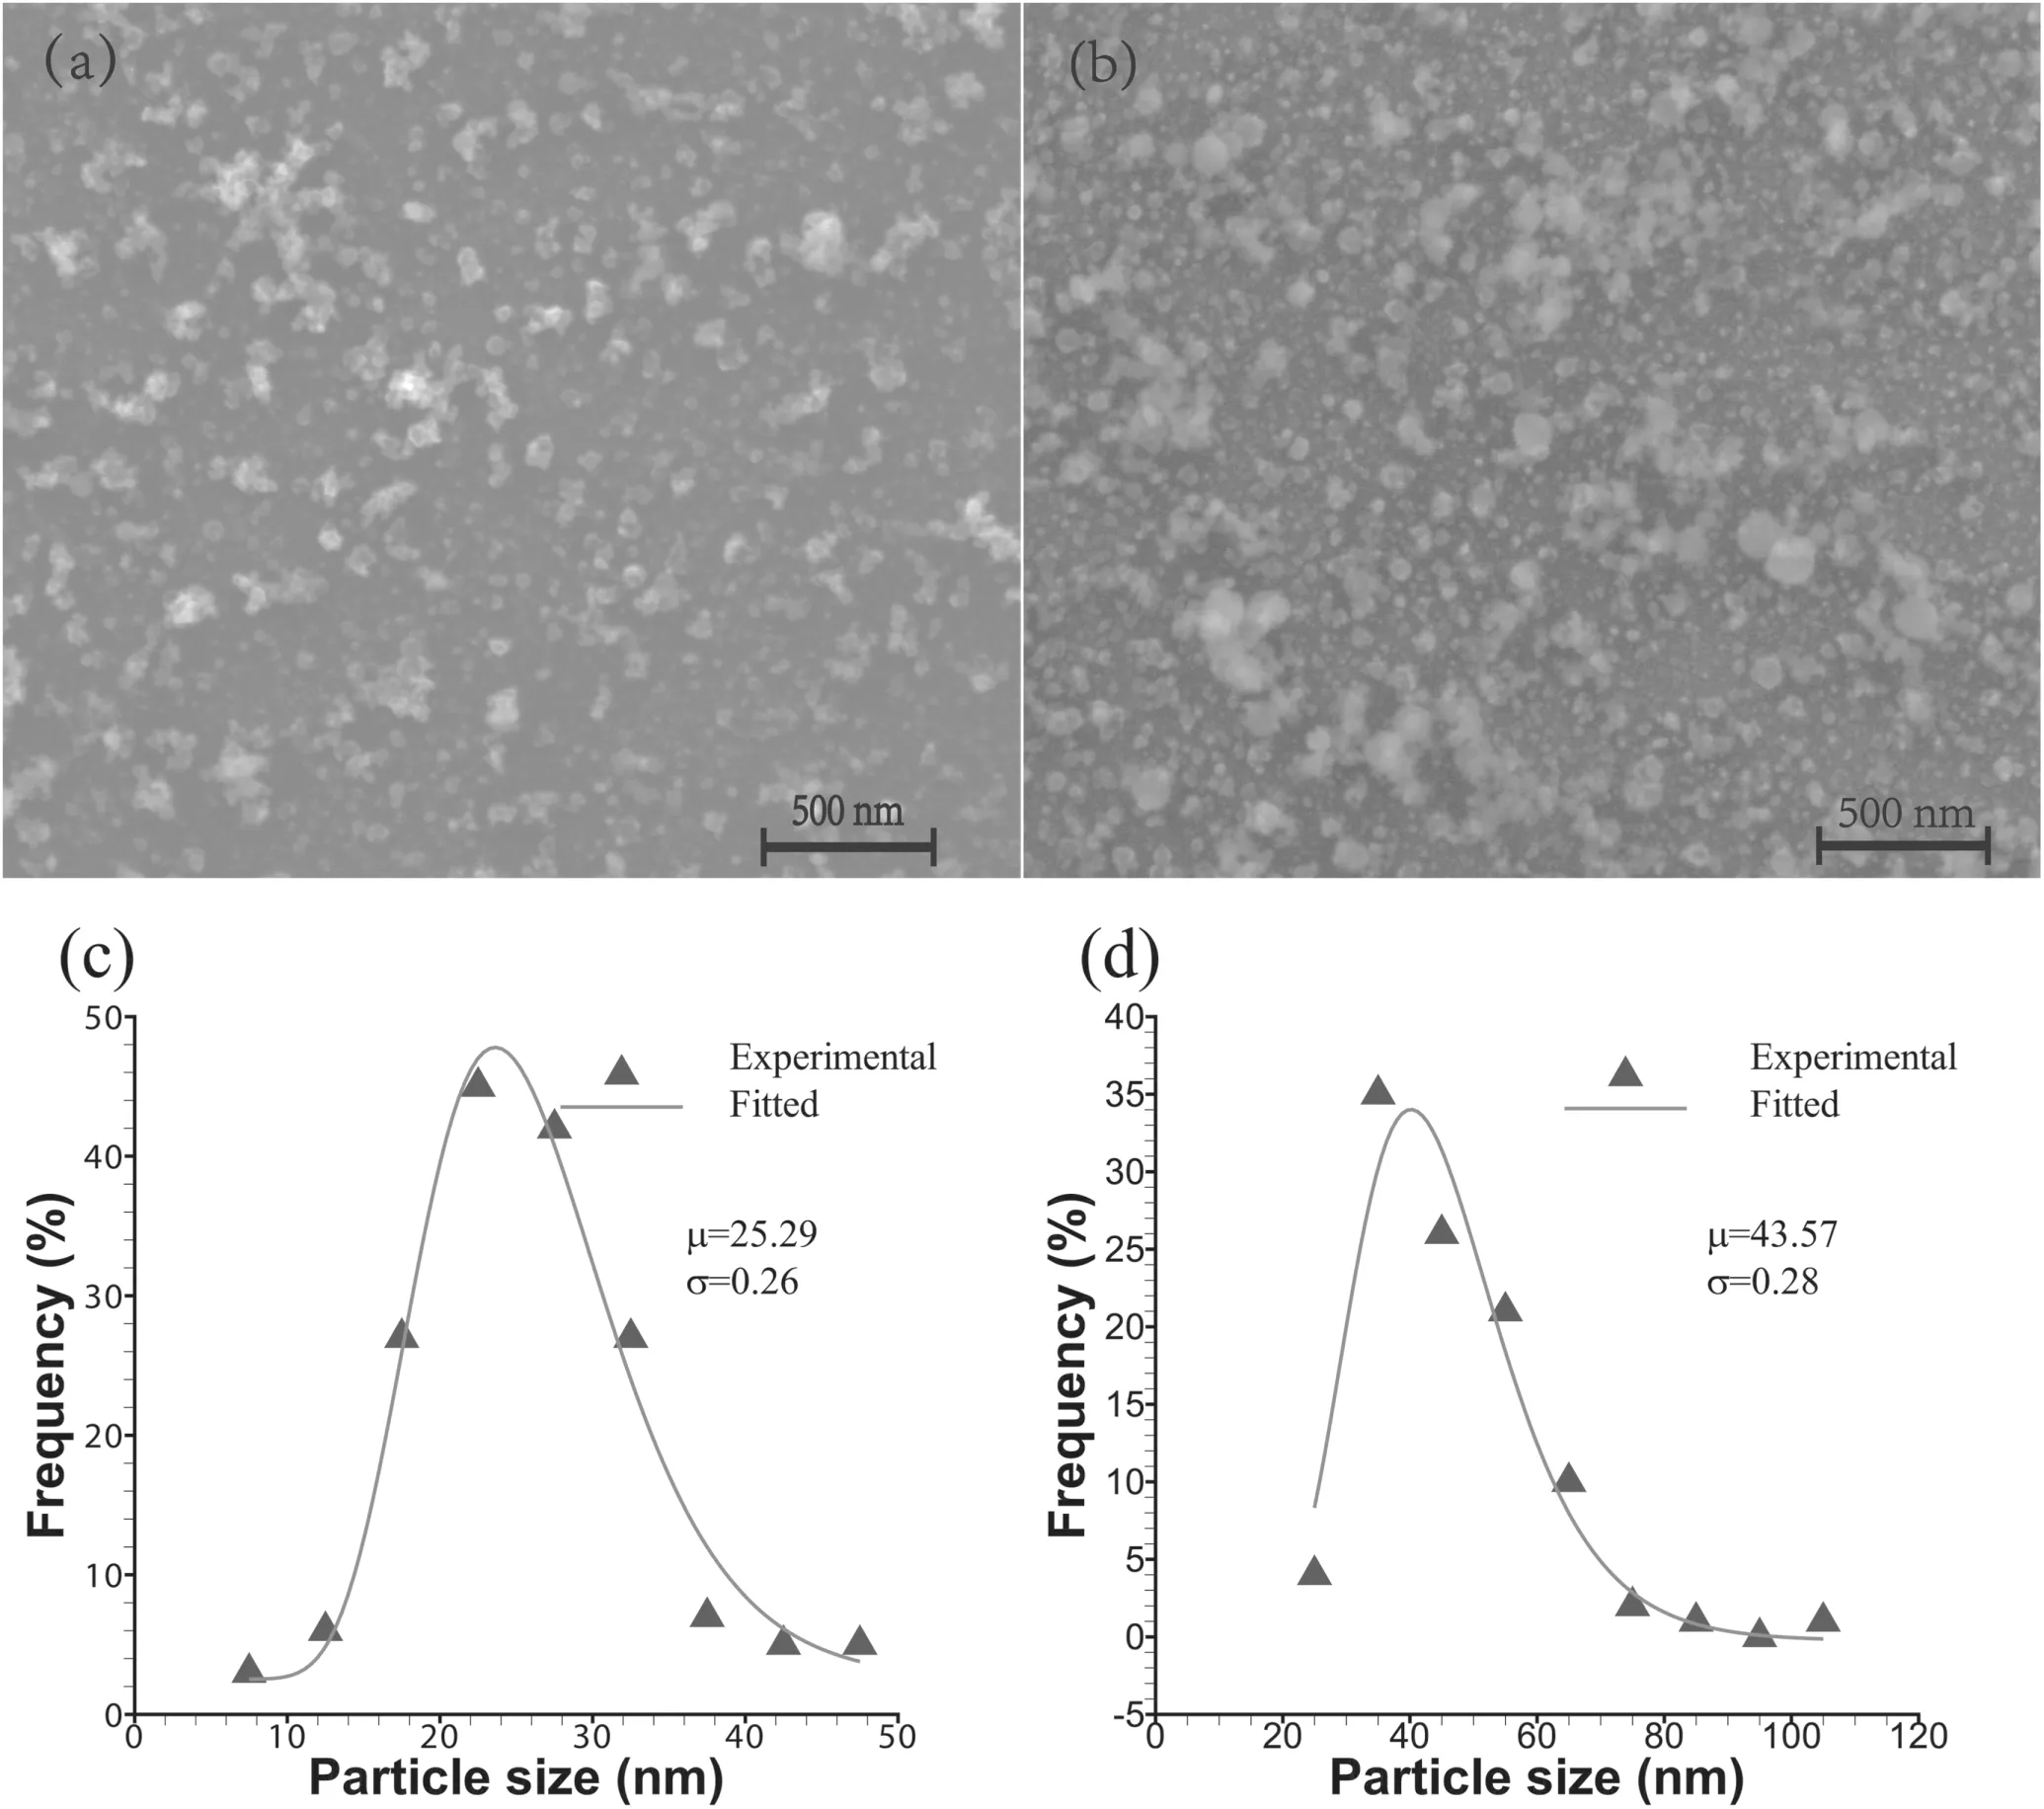
Figure 4.SEM images and the frequency count of nanoparticles produced by Al wire electrical explosion.(a)and(b)Nanoparticles produced from 0.1 mm and 0.2 mm Al wires,respectively.(c)and(d)The frequency count of nanoparticle diameters produced from 0.1 mm and 0.2 mm Al wires with log-normal distribution fitted,respectively.
It can be seen that the characteristic temperature for the formation of Al nanoparticles is ∼2520 K,which is also the characteristic temperature of other parameters.The characteristic temperature(∼2520 K)has a great influence on the formation of nanoparticles,because most nanoparticles form near this temperature.
4.4.Evolution processes of nanoparticles
Two-dimensional images of the formation process of nanoparticles are shown in figure 7.The two-dimensional diagram represents the distribution of the particle number at different temperatures and node diameters,and the number of particles is expressed in logarithmic form.If the number of particles decreases,a negative value is used,and if the number of particles increases,a positive value is used.
Figures 7(a)and(b)show the distribution of particle number density during the nucleation process and its local enlarged view.In the range of about 2600 K–2450 K,due to the large variation in saturated vapor pressure(as shown in figure 6(a)),the nucleation process is triggered and a large number of particles are formed while,in other temperature ranges,the number of nucleated particles can be ignored.During this process,the particle diameter that is formed is mainly concentrated between about 8 nm and 25 nm,while the number of particles formed on other nodes is almost negligible.The number of particles with a diameter of about 10 nm is the largest,and the temperature is between 2550 K and 2500 K.The whole distribution state presents a‘V’shape and an intermittent sawtooth shape,which may be due to the small number of nodes set in the solution process.According to equation(5),particles can only be distributed on different nodes.
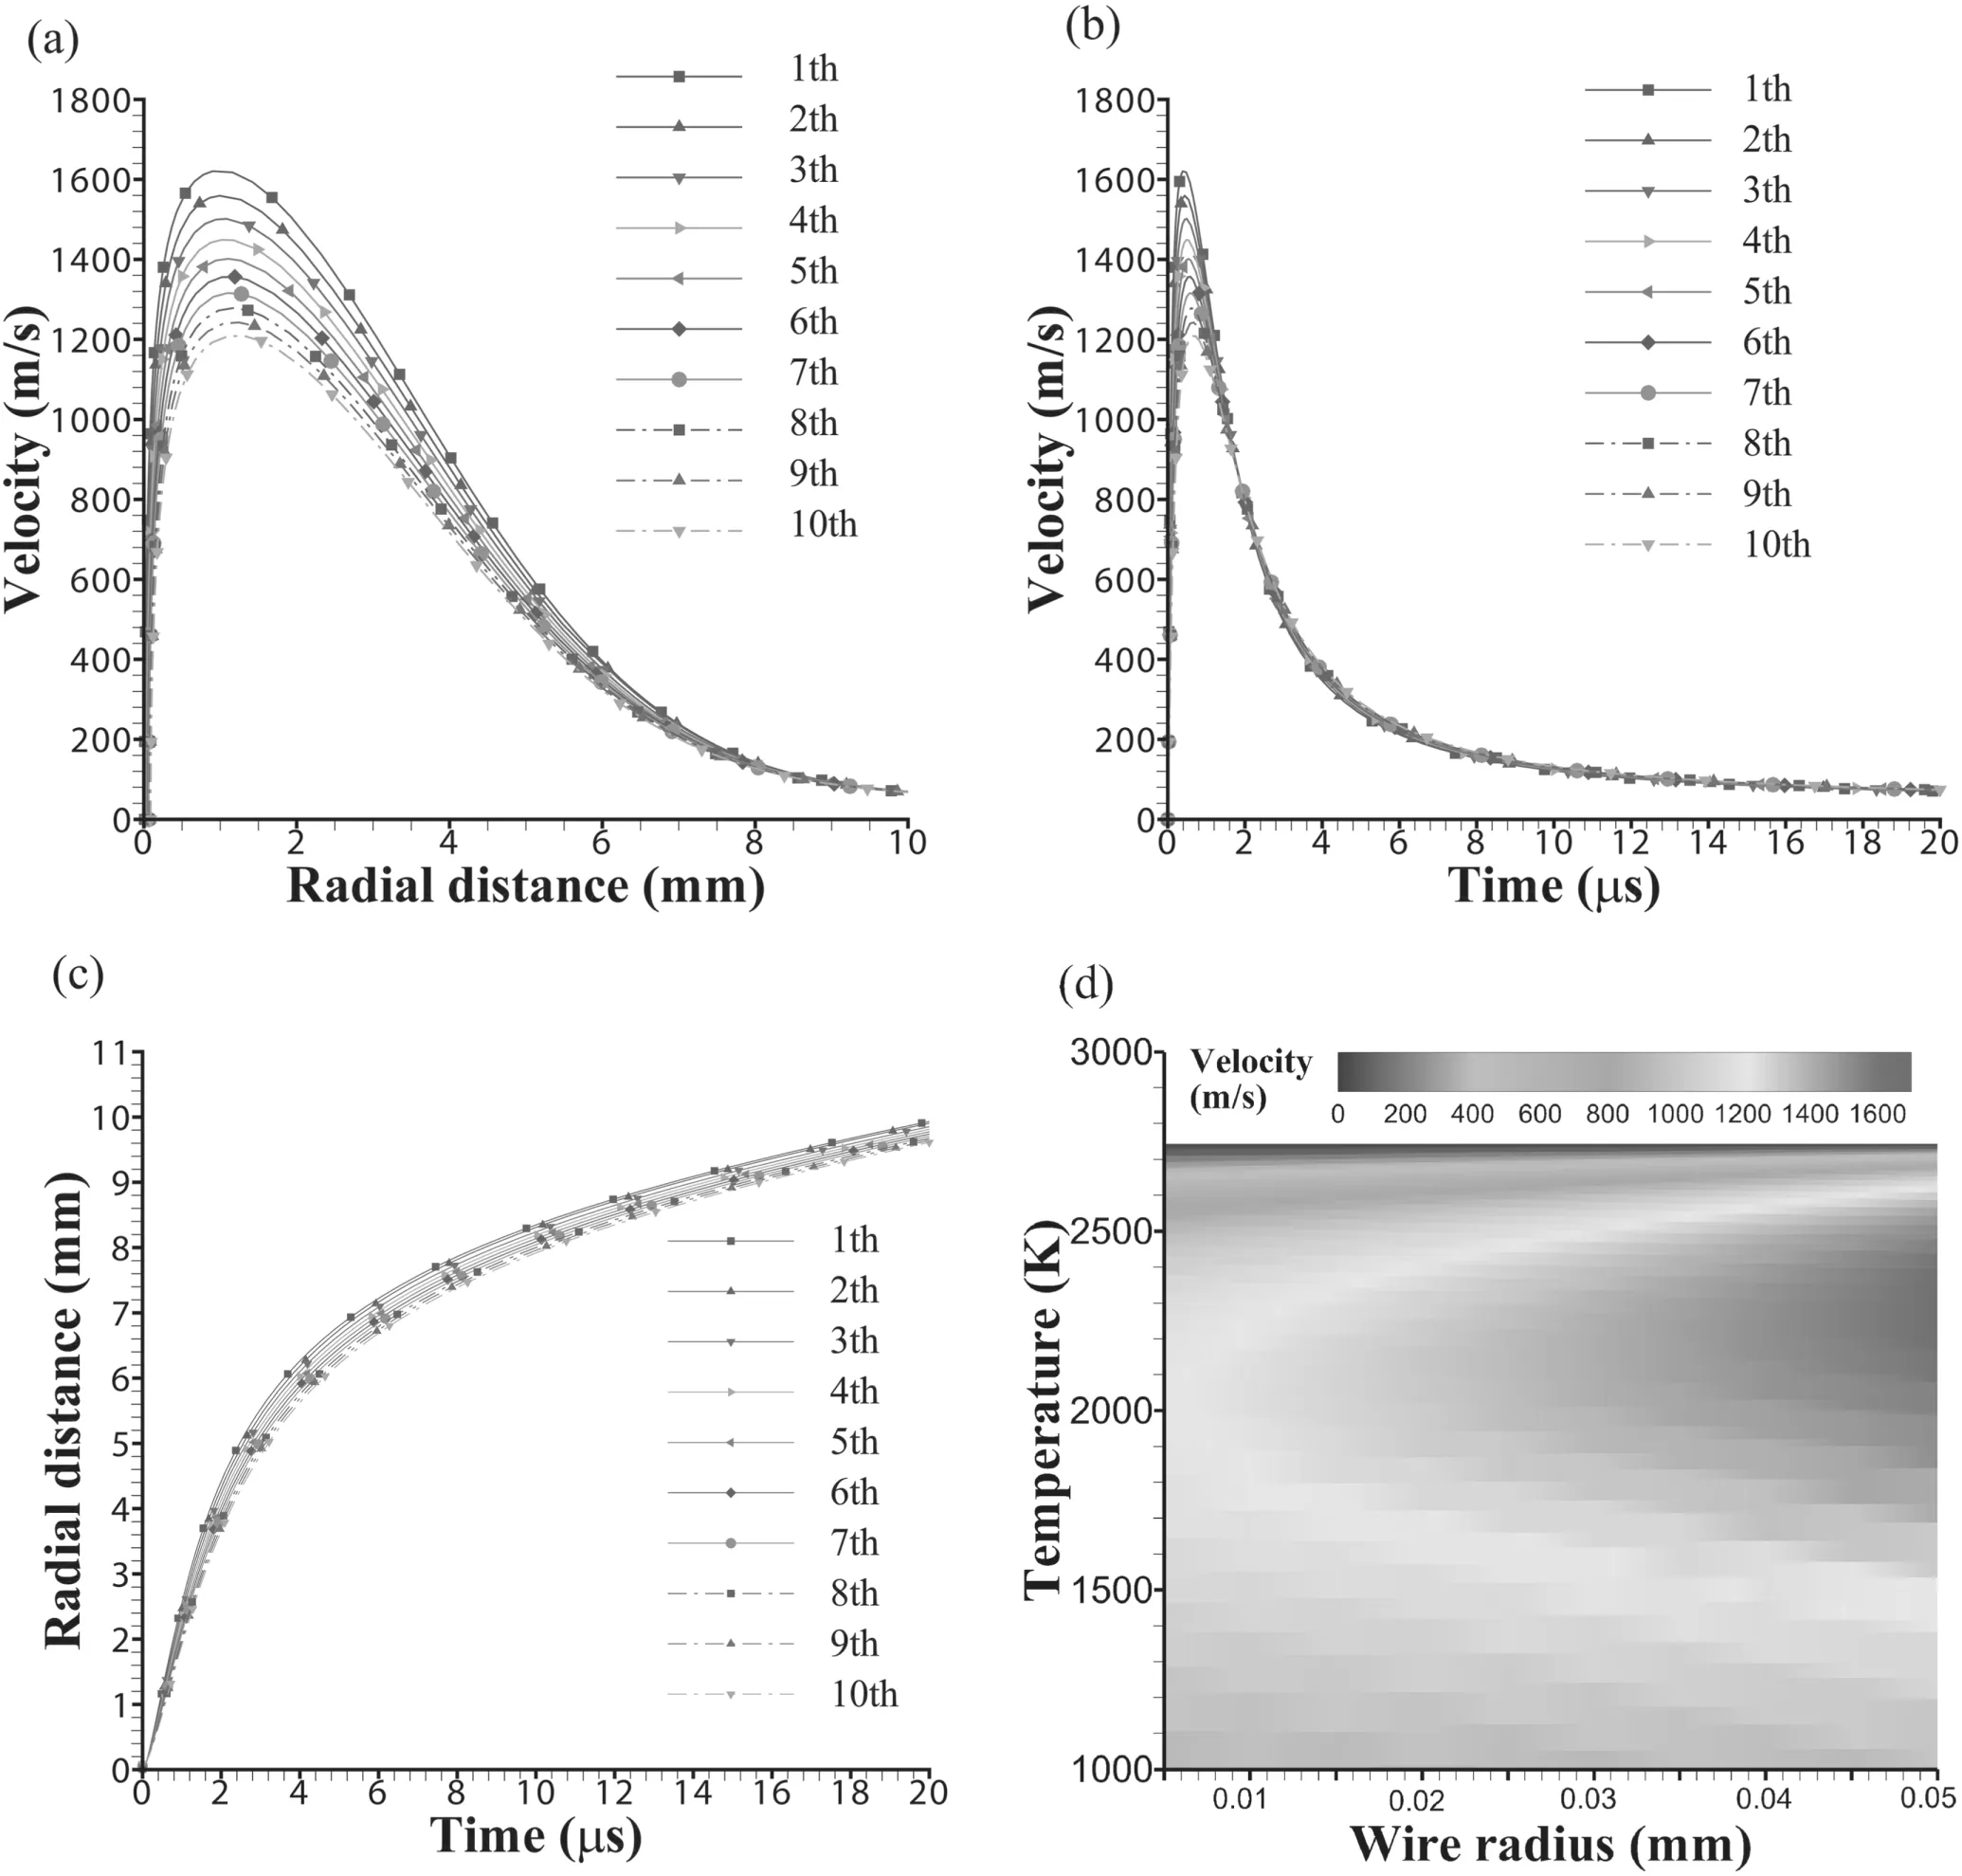
Figure 5.The movement process of particles during the 0.1 mm Al wire electrical explosion.(a)The particle velocity of each layer in the radial direction,(b)the particle velocity of each layer varies with time,(c)the particle travel of each layer varies with time,(d)the distribution of particle velocity in each layer at different temperatures.
Figure 7(c)shows the distribution of particle number density during the coagulation process.At the beginning of nucleation,particles rarely gather.Starting from about 2550 K,the aggregation process develops rapidly and continues to the end of the particle formation process as the temperature decreases.The regions with negative values are mainly concentrated between 8 nm and 30 nm in diameter,and their number is decreasing:that is,these particles continue to collide and aggregate into larger-diameter particles.The diameter of the formed particles is mainly concentrated between 30 nm and 100 nm,and more small-diameter particles are generated and less large-diameter particles are generated,presenting a gradual change.In the aggregation process,it is mainly the collision of smaller-diameter particles that generate larger-diameter particles,while the collision between larger-diameter particles has little effect on the change in particle number.There is an obvious critical value(∼30 nm in diameter),and the particle collision less than this critical value accounts for the main body of the aggregation process.
Figure 7(d)shows the distribution of particle number density during the surface growth process.From the beginning of nucleation and particle formation,the process of surface growth begins and continues to the end.The total number of particles with a diameter of about 8 nm to 25 nm is decreasing(negative value in the figure),which is mainly due to the continuous condensation of monomer particles on their surfaces,making the particle diameter continuously larger.According to equation(10),the number of particles will fall onto nodes with larger diameters.When the temperature is about 2400 K,the surface growth rate reaches the maximum,and a large number of large-diameter particles are generated(the diameter is about 25 nm to 80 nm,and the smaller the diameter is,the larger the number is).With the continuous decrease in temperature,the surface growth rate decreases and,in particular,the increase in the number of larger particles decreases.The effect of surface growth makes smalldiameter particles grow into larger particles,and there is an obvious critical value of the upper diameter limit(∼25 nm)for small-diameter particles.In addition,there is no phenomenon observed whereby large-diameter particles become small-diameter particles due to the evaporation of monomers on the surface.
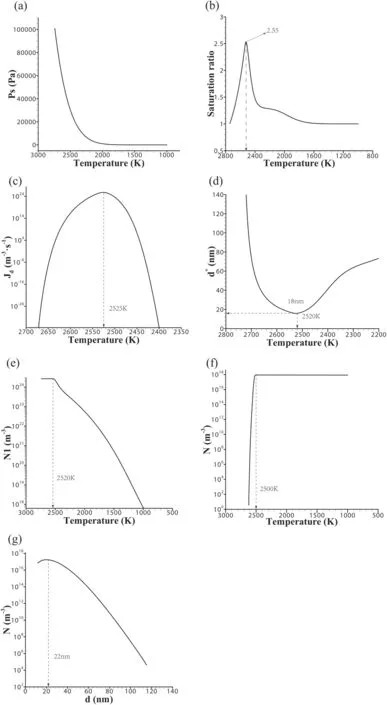
Figure 6.Characteristic parameters at different temperatures.(a)–(f)The saturated vapor pressure,saturation ratio,nucleation rate,average diameter of nucleation,number of monomers and number of nanoparticles formed with temperature.(g)The number of nanoparticles with different diameters.Here,Jd,Ps,d*,N1,N are the nucleation rate,saturation vapor pressure,average diameter of the formed nuclei,number of monomers and number of nanoparticles formed,respectively.
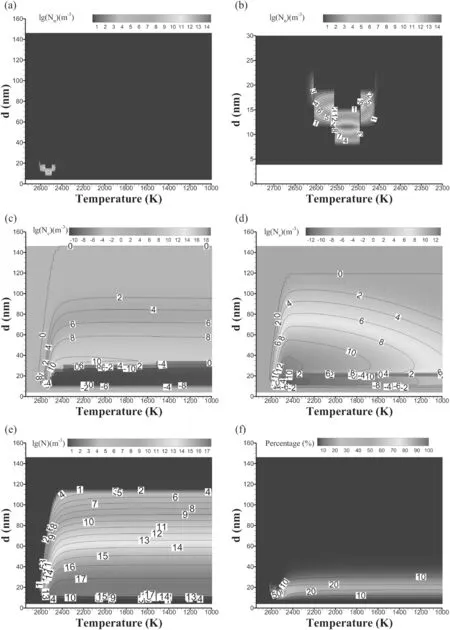
Figure 7.Two-dimensional images of the formation process of nanoparticles.Here,(a)–(f)are nucleation,partial enlarged detail of the nucleation process,coagulation,surface growth,the number of nanoparticles and the percentage of nanoparticles,respectively.The subscripts n,s and c represent the nucleation process,surface growth process and coagulation process,respectively.
Figure 7(e)shows the distribution of the total number of particles formed.From the beginning of nucleation,the total number of particles is increasing,and the distribution of particles is also changing with the decrease in temperature.From 2600 K to 2400 K,the particle distribution changes greatly,and the large-diameter particles change from less to more.After 2400 K,the particle distribution generally does not change.The number of particles is mainly concentrated near the diameter of 20 nm.With the continuous increase in particle diameter,the number is gradually decreasing.As seen in figure 7(b),the diameter of nucleated particles is mainly concentrated at about 10 nm.Therefore,the surface growth and aggregation processes determine the final diameter distribution of particles,although their influence can be approximately ignored once the temperature is lower than 2400 K.
Figure 7(f)shows the distribution of the percentage of particles formed.In the nucleation process,the percentage of particles with other diameters is almost zero,except the diameter of nucleated particles,and the number of particles formed reaches 70%,when it is near the characteristic temperature(∼2520 K).When the temperature is lower than 2400 K,the percentage of particles with different diameters stays approximately constant,and the diameter of particles is mainly distributed around 20 nm.
In general,the variation of saturated vapor pressure determines the temperature distribution range of particle nucleation.The nucleation process only takes place in a narrow temperature range(from 2600 K to 2450 K),and there is almost no nucleation process at other temperatures.In the surface growth process,there is a minimum critical diameter of particles(∼25 nm),and particles smaller than the critical diameter can grow into particles with larger diameters.In the aggregation process,there is a minimum critical diameter(∼30 nm),and the particles smaller than the critical diameter account for the main body of the collision process.The final particle number and size distribution are determined by the surface growth and aggregation processes,and remain almost unchanged once the temperature is lower than a certain value(∼2400 K).Therefore,the collision frequency can be changed by adjusting the velocity of particles in electrical explosion.Then,the aggregation process can be adjusted and,finally,the distribution of particles can be regulated.
Figure 8 shows the distribution of particle numbers in the three-dimensional coordinates of temperature,particle diameter and different layers of wire during the surface growth process.The area of particle reduction due to surface growth in the outer layer is narrow,and the area of particle reduction due to surface growth in the inner layer is wider than that in the outer layer.According to equation(4),the higher the particle velocity is,the higher the collision frequency is,which makes more particle surfaces grow.Therefore,the reduced area of particles on the node is relatively wide.
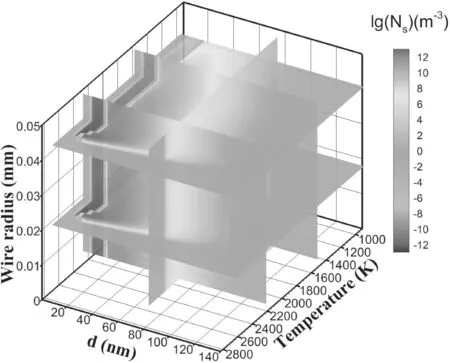
Figure 8.Isosurfaces of the particle number density during the surface growth process.
Figure 9 shows the distribution of particle numbers in the three-dimensional coordinates of temperature,particle diameter and different layers of wire during the coagulation process.Obviously,the area where particles are reduced due to aggregation in the outer layer is narrow(∼8 nm to∼20 nm),and the area where particles are reduced due to aggregation in the inner layer is wider than that in the outer layer(∼8 nm to ∼30 nm).The higher the collision frequency,the more likely the particles are to interact with each other,and the area of particle reduction is relatively wide.Aggregation refers to the pairwise collision between particles,while surface growth refers to the collision between monomers on the surface of larger particles.Therefore,the higher the particle velocity is,the more particles can collide,which makes the aggregation area larger and the surface growth area wider.
Figure 10 shows the distribution of the total particle number in the three-dimensional coordinates of temperature,particle diameter and different layers of wire.The region with the most concentrated particle number(∼8 nm to ∼60 nm)hardly varies with the velocity of the inner and outer layers,while the number of particles with diameters greater than 100 nm decreases with the decrease in particle velocity.
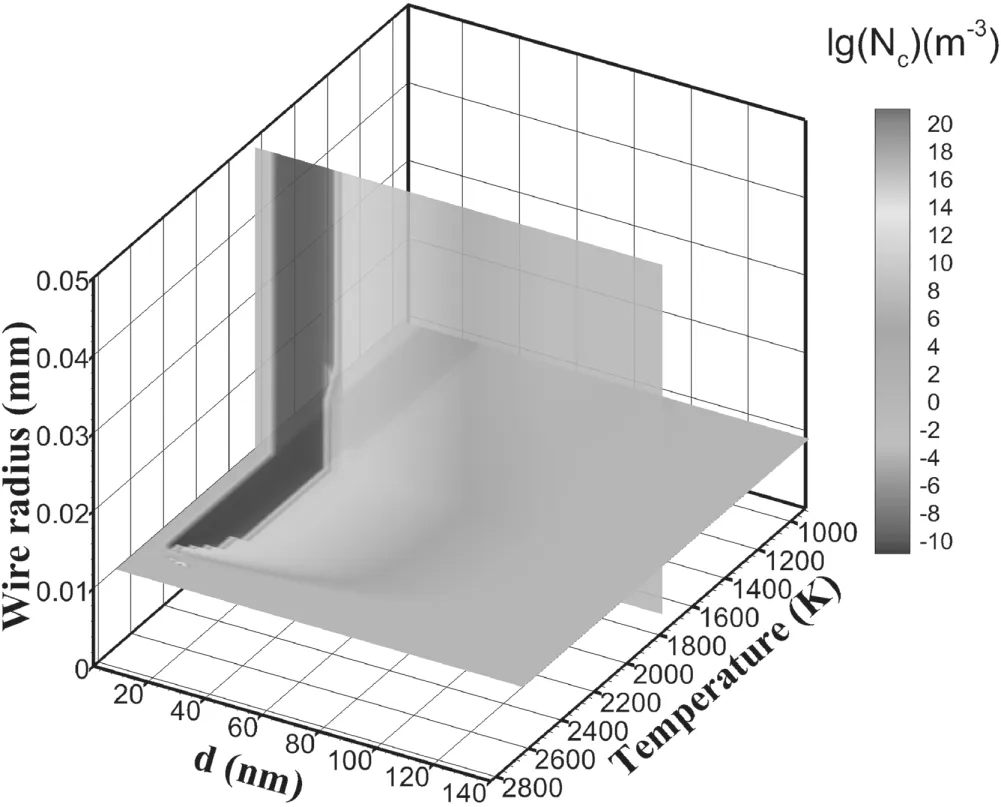
Figure 9.Isosurfaces of particle number density during the coagulation process.
In conclusion,particle velocity has an effect on the surface growth and aggregation process of particles,and has no effect on the concentrated distribution area of the total number of particles,but has an effect on the distribution area of largerdiameter particles.
4.5.Comparison between calculation and experiment
Figure 11 shows the percentage of nanoparticle diameters calculated from 0.1 mm and 0.2 mm Al wires.When we compare the experimental and calculated results of the 0.1 mm Al wire electrical explosion,the central axis of the diameter distribution of nanoparticles is located at ∼25 nm(as shown in figure 4(c)),and the calculated value is at ∼22 nm(as shown in figure 11).In the experiment of the 0.2 mm Al wire electrical explosion,the central axis of the diameter distribution of nanoparticles is located at ∼40 nm(as shown in figure 4(d)),and the calculated value is at ∼45 nm(as shown in figure 11).It can be seen that the data obtained from the model are in good agreement with the experimental results.Due to the fact that the present model uses the discrete method to layer the wire,the quantitative difference is acceptable.
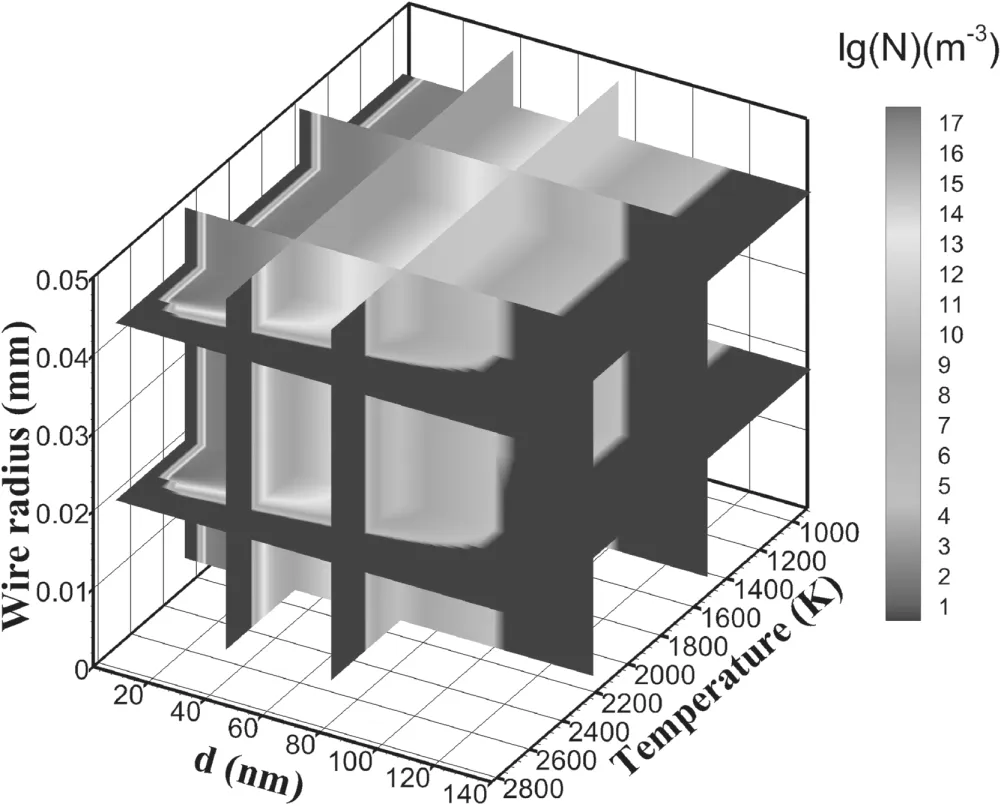
Figure 10.Isosurfaces of the total number of particles formed.
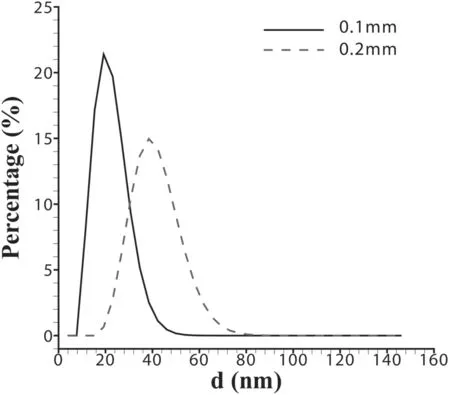
Figure 11.The percentage of nanoparticle diameters calculated from 0.1 mm and 0.2 mm Al wires.
This paper provides a method to calculate the size and distribution of nanoparticles formed by Al wire electrical explosion,which is of great significance to understand the evolution process of metal wire electrical explosion and the formation of nanoparticles.
5.Conclusions
In this paper,a nanoparticle formation model that considered layered motion was developed.An experimental system was established and electrical explosion experiments using 0.1 mm and 0.2 mm Al wires were carried out.The simulation results are in agreement with the experiments.Furthermore,the characteristic parameters and evolution process during the formation of nanoparticles are calculated and analyzed.
The maximum velocities of the innermost and outermost layers are about 1200 m·s−1and 1600 m·s−1,and the velocity of the middle layer is about 1400 m·s−1,respectively.As the temperature decreases from the boiling point of Al to its melting point(933 K),the change in particle velocity in each layer is different.
Most of the nanoparticles are formed in the temperature range of 2600 K–2500 K.The characteristic temperature for the formation of Al nanoparticles is ∼2520 K,which is also the characteristic temperature of other parameters.The formed nanoparticles’diameter distribution ranges from 18 to 110 nm,and most of them are distributed near 22 nm.
The variation of saturated vapor pressure determines the temperature distribution range of particle nucleation.In the surface growth process,there is a minimum critical diameter of particles(∼25 nm),and particles smaller than the critical diameter can grow into particles with larger diameters.In the aggregation process,there is a minimum critical diameter(∼30 nm),and particles smaller than the critical diameter account for the main body of the collision process.Particle velocity has an effect on the surface growth and aggregation process of particles,and has no effect on the concentrated distribution area of the total number of particles,but has an effect on the distribution area of larger-diameter particles.
The results provide a method for estimating the size and distribution of nanoparticles,which is of great significance to understanding the evolution process of wire electrical explosion and particle formation.
猜你喜欢
青春期健康(2022年21期)2022-11-30
Plasma Science and Technology(2022年6期)2022-07-13
民族高等教育研究(2022年1期)2022-04-19
科学导报(2022年18期)2022-04-10
安徽文学(2020年8期)2020-08-11
东坡赤壁诗词(2020年2期)2020-06-04
湖北第二师范学院学报(2017年3期)2017-05-10
莫愁(2016年34期)2017-01-12
莫愁·智慧女性(2016年12期)2016-12-21
海外英语(2013年8期)2013-11-22
 Plasma Science and Technology2023年1期
- Plasma Science and Technology的其它文章
- Development of miniaturized SAF-LIBS with high repetition rate acousto-optic gating for quantitative analysis
- Improving plasma sterilization by constructing a plasma photocatalytic system with a needle array corona discharge and Au plasmonic nanocatalyst
- Rotor performance enhancement by alternating current dielectric barrier discharge plasma actuation
- Focused electron beam transport through a long narrow metal tube at elevated pressures in the forevacuum range
- A study of the influence of different grid structures on plasma characteristics in the discharge chamber of an ion thruster
- High-resolution x-ray monochromatic imaging for laser plasma diagnostics based on toroidal crystal