
Experimental and numerical simulation study of the effect for the anode positions on the discharge characteristics of 300W class low power Hall thrusters
2023-03-09 05:45XinweiCHEN陈新伟JunGAO高俊SanxiangYANG杨三祥HaiGENG耿海NingGUO郭宁ZuoGU顾左JuntaiYANG杨俊泰andHongZHANG张宏
Plasma Science and Technology 2023年1期
关键词:杨俊
Xinwei CHEN(陈新伟),Jun GAO(高俊),Sanxiang YANG(杨三祥),Hai GENG(耿海),Ning GUO(郭宁),Zuo GU(顾左),Juntai YANG(杨俊泰)and Hong ZHANG(张宏)
Science and Technology on Vacuum Technology and Physics Laboratory,Lanzhou Institute of Physics,Lanzhou 730000,People’s Republic of China
Abstract Low-power Hall thruster(LHT)generally has poor discharge efficiency characteristics due to the large surface-to-volume ratio.Aiming to further refine and improve the performance of 300 W class LHT in terms of thrust and efficiency,and to obtain the most optimal operating point,the experimental study of the discharge characteristics for three different anode positions was conducted under the operation of various discharge voltages(100–400 V)and anode mass flow rates(0.65 mg·s−1 and 0.95 mg·s−1).The experimental results indicated that the thruster has the most excellent performance in terms of thrust and efficiency etc at a channel length of 27 mm for identical operating conditions.In addition,particle in cell simulations,employed to reveal the underlying physical mechanisms,show that the ionization and acceleration zone is pushed downwards towards the channel exit as the anode moves towards the exit.At the identical operating point,when the channel length is reduced from 32 to 27 mm,the ionization and acceleration zone moves towards the exit,and the parameters such as thrust and efficiency increase due to the high ionization rate,ion number density,and axial electric field.When the channel length is further moved to 24 mm,the parameters in terms of thrust(F)and efficiency(ηa)are reduced as a result of the decreasing ionization efficiency(ηm)and the larger plume divergence angle(α).In this paper,the results indicated that an optimum anode position(Δ L= 27 mm)exists for the optimum performance.
Keywords:low-power Hall thruster,discharge characteristics,PIC-MCC simulation,anode positions
1.Introduction
Hall effect thrusters(HT)have the advantages of high thrustto-work ratio,high specific impulse,simplicity of structure,and high efficiency[1–3],which have been widely applied to satellite orbit keeping,attitude control,and orbit transfer,drag compensation,and other missions.With the accelerating development of low Earth orbit(LEO)satellites and the growing requirement for high-resolution orbital keeping,the notable commercial astronautics corporations,such as One-Web[4],NASA,and SpaceX[5],are robustly developing LEO satellites with low-power Hall thruster(LHT)as the primary propulsion system for orbit keeping and end-of-life orbital separation missions.
However,the LHT[6–8]has a great surface-to-volume ratio,which caused worse efficiency,lifetime,and other parameters versus the medium or high power HT.The predominant lifespan restricting factor is the erosion of the discharge channel(DC)walls attributed to the bombardment caused by high energetic ions[2,9].The wall-less Hall thruster(WLHT)technology[10–12]and the magnetically shielded(MS)Hall thruster technology[9,13,14]can significantly lessen the effect of ions on the walls and prolong the life of the thrusters.The results[10–12]of the WLHT study demonstrate that different anode positions dramatically impact the potential distribution of the discharge channel,performance,and lifetime of the thruster.The discharge channel walls are an essential component of the LHT.The variation in channel length has a significant effect on the ionization,acceleration processes,and particle-wall interactions.It has been shown that choosing the optimum anode positions(or channel length)to suit the magnetic field(MF)can significantly confine electrons,enhance the utilization of the medium,boost ionization and acceleration characteristics,and strengthen the performance of the thruster.Therefore,there is a significant value in the research into the influence of LHT channel length.The increase in ionization collision rate leads to an increase in thruster performance.
Some researchers have investigated the influences of anode construction,anode material,and anode positions on the discharge properties of thrusters(for example,HT,cylindrical Hall thruster,anode layer Hall thruster,multi-staged plasma thruster,etc).Raitseset al[15,16]demonstrated that when the crosssection of the near-anode discharge channel becomes narrowed,the electron density spreading towards the anode could be anticipated to be increased by experimentally shifting the anode position.Kapulkinet alintroduced a low-power coaxial magnetically isolated anode Hall thruster(CAMILA)and concluded that the optimum CAMILA anode cavity length was dependent on the discharge voltage(DC)[17–19].Dinget al[3]studied the effect of the position of the hollow anode(HA)on the properties of the HT in a dual-peaked magnetic field and concluded that the performance of the thruster is optimal where the anode was located in the inner magnetic separatrix.Courtneyet al[20]investigated a divergent cusped-field thruster(DCFT)and considered that the position of the anode has a significant effect on thruster electron flow and stability.In addition,Yugeet al[21]carried out the experimental research on the varying channel lengths of 3 mm and 4 mm and compared thrust and specific impulse for anode-layer Hall thrusters.The results showed that shorter channel lengths contributed to poorer thrust,efficiency,and specific impulse.Gaoet al[22]studied the effect of anode positions on cylindrical Hall thrusters with different internal diameter hole distributions and concluded that the anode gradually moving away from the axis along with the radial direction results in increased ion currents and decreased electron currents.Zenget al[23]carried out a study on the effect of three different dielectric wall materials on the performance and discharge characteristics of the multi-staged plasma(HEMP)thruster,and found a distinct effect on the secondary electron emission coefficient of the wall material at low mass flow rates,and no significant discrepancy identified in the case of high mass flow rates.However,it has been found that the effect of anode position on HT mainly focused on medium-high power Hall thrusters[15],anode layer type Hall thrusters[24],or other types of electric thrusters.The effect of anode position on LHT(<500 W)has not been thoroughly investigated.
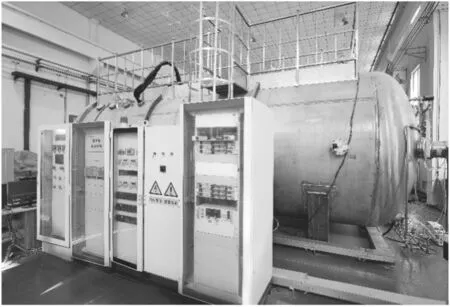
Figure 1.The photo of TS-6B.
In this work,the experimental and numerical simulation methods employed to investigate the discharge characteristics and the influence mechanisms of the anode positions on the 300 W class LHT are exclusively designed by the Lanzhou Institute of Physics.The remaining parts of the paper are organized as follows,the second section presents a description of the experimental equipment and the method of data processing,the third section shows the interpretation of the experimental and simulation results under different anode positions,and the fourth section draws conclusions.
2.Experimental setup
The experiment was performed on the TS-6B vacuum equipment at the Science and Technology on Vacuum Technology and Physics Laboratory of the Lanzhou Institute of Physics.The dimensions of the TS-6B are a diameter of 3000 mm and a length of 7000 mm.The pressure of the TS-6B is better than 9.0×10⁻⁴Pa at a xenon(Xe)mass flow rate(MFR)of approximately 1.0 mg·s−1.The LHT-40[25,26]features a 40 mm diameter discharge chamber with the power of 300 W and is capable of producing the thrust up to 12 mN and the specific impulse up to 1200 s.The photos of the TS-6B and LHT-40 are presented in figures 1 and 2(b),respectively.
A laser interferometer thrust measurement device is used for thrust measurement,which has been used for thrust measurement research work on several thrusters with a measurement error of±0.1 mN[27,28],as shown in figure 2(c).
The anode specific impulse(Ia,sp)is calculated with equation(1):
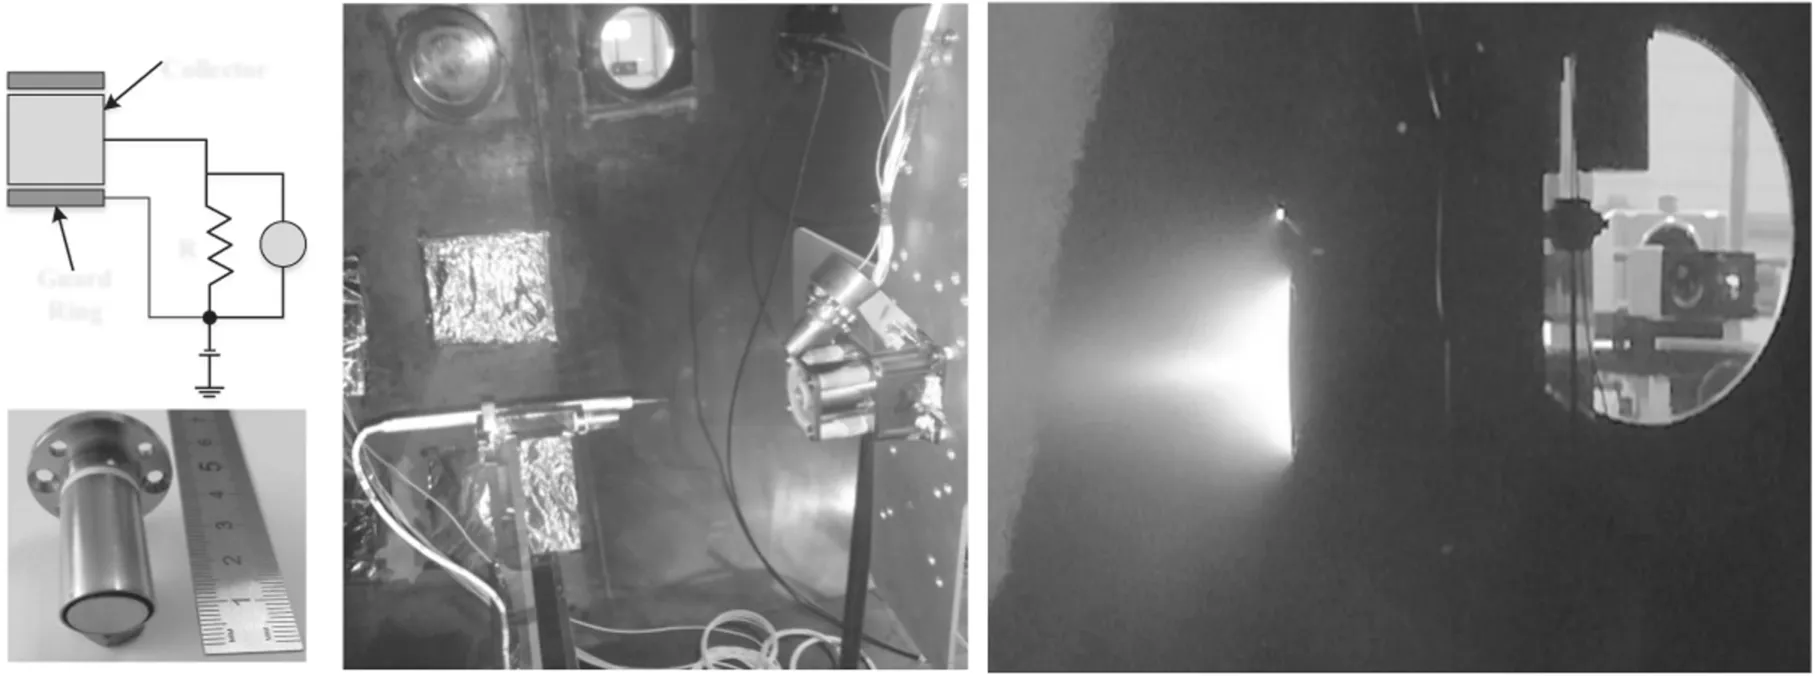
Figure 2.The electrical principle and photograph of the Faraday probe(a),relative positions of the Faraday probe(b),and a picture of the thruster discharge plume(c).
whereFis the thrust,andgdenote the anode mass flow rate(AMFR)and the gravitational acceleration,respectively.
The anode efficiency(ηa)is calculated with equation(2):
whereUdandIddenote the discharge voltage and discharge current,respectively.
The Faraday probe(FP)[29–31]is made up of a planar collecting electrode(PCE)encompassed within the shielded ring(SR),which is polarized to the same negative potentials such that the electrons are repelled.The PCE and SR of the FP employed in the present test consist of a molybdenum plate with a diameter of 10 mm and stainless steel,illustrated in figure 2(a).The PCE and SR are supplied with bias voltages of −30 V.The FP is positioned on a two-dimensional motion device(effective traveling distance:0.8 m×0.8 m,accuracy:0.1 mm).The electrical principle and the photograph of FP are shown in figure 2(a).The ion current density(ICD,j)and the beam divergence angle(α)are acquired from equations(3)and(4),respectively.
In equation(3),V,R,andAare the voltage,resistor impedance,and collection area.In equation(4),theDrepresents the HT external channel diameter,Lrepresents the distance along the axis between the HT outlets and the FP collection dish.TheR90%indicates the radial displacement concerning 90% of the overall ion beam current(TIBC).
The TIBC(Ii)can be obtained with equation(5).
here,randj(r)represent the radial distance from the thruster centerline and the corresponding ICD at locationr,respectively.
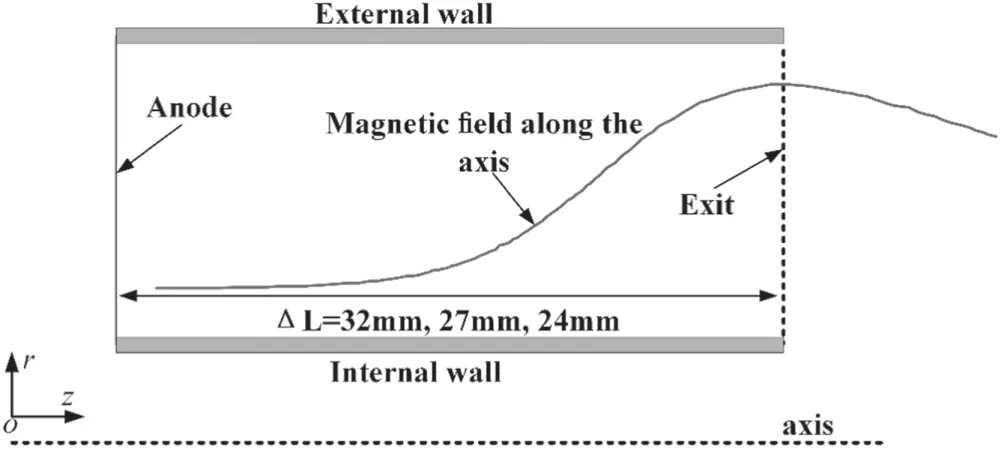
Figure 3.Schematic of the correlation between varying anode positions and the LHT exit.
The formula of the mass utilization efficiency(ηm)[23,32,33]is presented in equation(6)and indicates the percentage of atoms translated to ions.
3.Results and discussion
3.1.Experimental results and discussion
The distances of the anode to the thruster outlet are marked asΔL.In this test,ΔLare 24 mm,27 mm,and 32 mm,corresponding to the anodes marked case 1,case 2,and case 3,respectively.The strength of the magnetic field at the exit axis of the thruster remains constant(about 150 Gs)for differentΔL.The schematic of the relationship between different anode positions and the thruster exit is shown in figure 3.
The influence on the discharge performance for the thruster was carried out with different anode positions.Considering each operating situation of the thruster,the discharge current and its oscillations were documented.From the discharge results,it was revealed that the FP did not affect the thruster discharge,no matter where the FP was positioned.Before the thrust and ICD measurements,the thruster was subjected to a continuous discharge for up to two hours.The thrusters are regarded as achieving thermal stability.
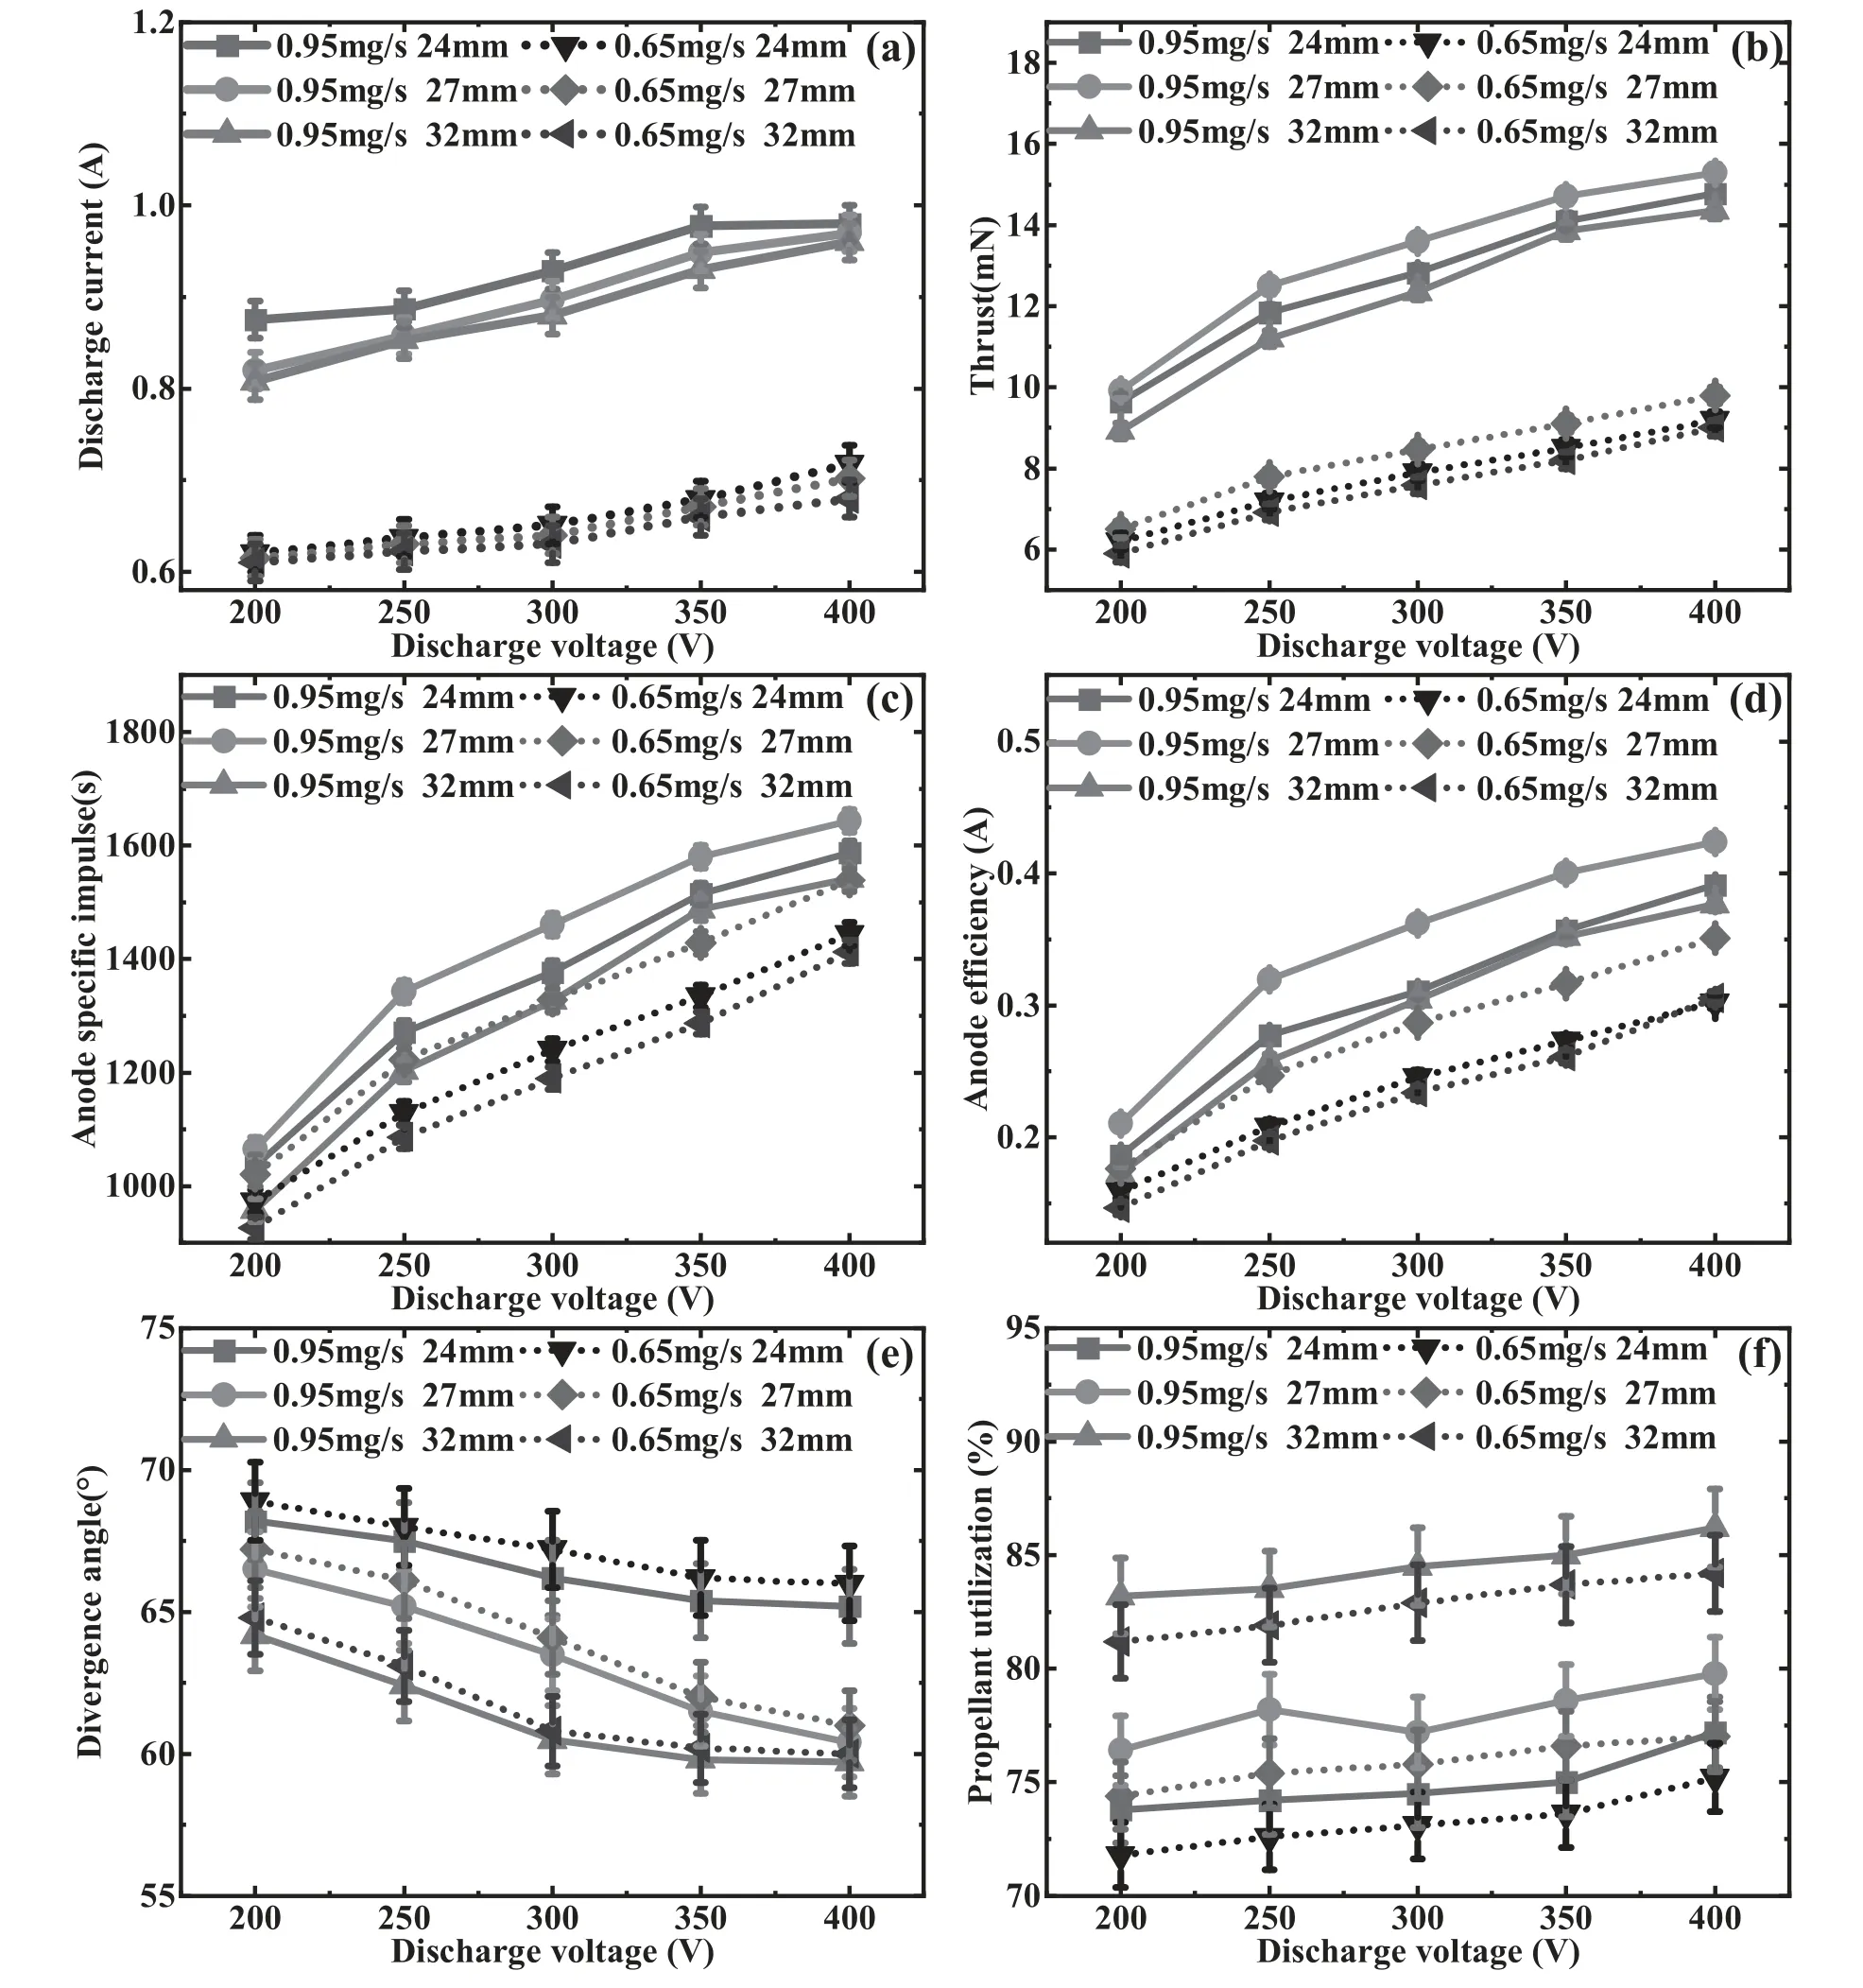
Figure 4.Thruster performance parameters as functions of different and DV.
The parameters in terms of thrust,discharge current(Id)and anode specific impulse,etc versus the three different anode positions are illustrated in figures 4(a)–(f).The experimental conditions were the discharge voltage(DV)from 100 to 400 V and two different AMFRs(0.65 mg·s−1and 0.95 mg·s−1).It is evident in figure 4 that theandIa,spincrease depending on DV and AMFR().Theαdecrease depends on DV and AMFR for all three anode positions.As can be seen in figure 4(a),theIdof case 1 is the maximum and theIdof case 3 is the minimum at the identical operating points.Taking case 2 as an example,the discharge currents(Id)are 0.97 A and 0.7 A respectively under the DV of 400 V andof 0.95 mg·s−1and 0.65 mg·s−1.It is obvious from figures 4(b)and(c)that for the identical operating,theF,Ia,spandηaof case 2 are maximum,and theF,Ia,spandηaof case 1 and case 3 are medium and minimum respectively.Taking case 2 as an example,the thrust is 15.3 mN and 9.8 mN,the anode specific impulse is 1643 s and 1538 s,and the anode efficiency is 42.3%and 35%under the discharge voltage of 400 V and the AMFR of 0.95 mg·s−1and 0.65 mg·s−1respectively.In general,the maximum increment of thrust for case 2 compared to cases 1 and 3 is about 11%and the minimum increment of thrust is about 3% under different operating conditions respectively.Furthermore,it is evident from figure 4(e)that the beam divergence angle(α)is between 68.9° and 59.4° for different operating conditions.Theαof case 3,case 2,and case 1 are the minimum,medium,and maximum respectively.As can be seen in figure 4(f),theηmfor case 3,case 2,and case 1 are the maximum,medium,and minimum respectively.The position of anode 2 with the largest thrust may be the result of a combination of thruster divergence losses and plasma-channel interactions.Anode 1(relative to anode 2)has a short discharge channel with a large beam divergence angle further causing the thrust loss,while anode 3(relative to anode 2)has a long discharge channel resulting in a large thrust loss due to the enhanced interaction between the discharge channel ions and the discharge channel.
3.2.Numerical simulation results and discussion
To further characterize the underlying mechanism of the operating characteristics of the LHT-40 Hall thruster for different anode positions,numerical simulations of the discharge properties of the HT for different anode positions were carried out with the particle in cell and Monte Carlo collisions(PICMCC)method.
3.2.1.General description of the PIC-MCC model.The PICMCC simulations are commonly employed in studying the plasma parameters for analytical HT.Due to the confining influence of the magnetic field on the electrons,a high-density electron region is formed at the location of the largest magnetic field(near the thruster exit).The accumulation of electrons causes a dramatic drop in the space potential near the thruster exit,which increases the electric field strength and facilitates the acceleration of the ions.The potential distribution in the HT discharge channel is satisfied by the Poisson equation.
where ρ is the net charge density,ε0is the dielectric constant in the vacuum andφis the spatial potential.
Under the axisymmetric assumption,the Poisson equation in cylindrical coordinates is:
hereerepresents elementary charge,nidenotes the ion density,andnestands for the electron density.Thezandrrepresent the axial and radial directions in cylindrical coordinates,respectively.
The above equation is discretized using the finite difference method.To have the same different formats on each grid node,the spatial grid is divided according to equal steps.The difference equation can be expressed as:
here,theiandjrepresent the grid counts in thezandrdirections,respectively.
By introducing virtual time(τn)into the equation,the above elliptic equation is transformed into a parabolic equation:
whereΔzandΔrdenote the spatial steps in thezandrdirections respectively,which are satisfied byΔz= Δr.Whenτn→∞and∂φ/∂τn= 0,φis the solution to the equation and the spatial electric field can be derived fromφ.
The motion of a charged particle located in the discharge channel of the HT is satisfied by the following equation.
Since the positions of the atoms entering the thruster discharge channel(TDC)from the thruster anode at the initial moment are uniformly distributed in space,Monte Carlo sampling is used to yield the position distribution of the primary ions.The distribution of the particles in the axial and radial directions follows the equation.
wherezmax,zmin,rmaxandrminare the maximum and minimum in the axial and radial directions,respectively.Theζdenotes a random number between 0 and 1.The initial velocity distribution of the particles obeys the Maxwell distribution.
whereTis the temperature,kis the Boltzmann constant,andυiis the three velocity components in the two-dimensional axisymmetric model.
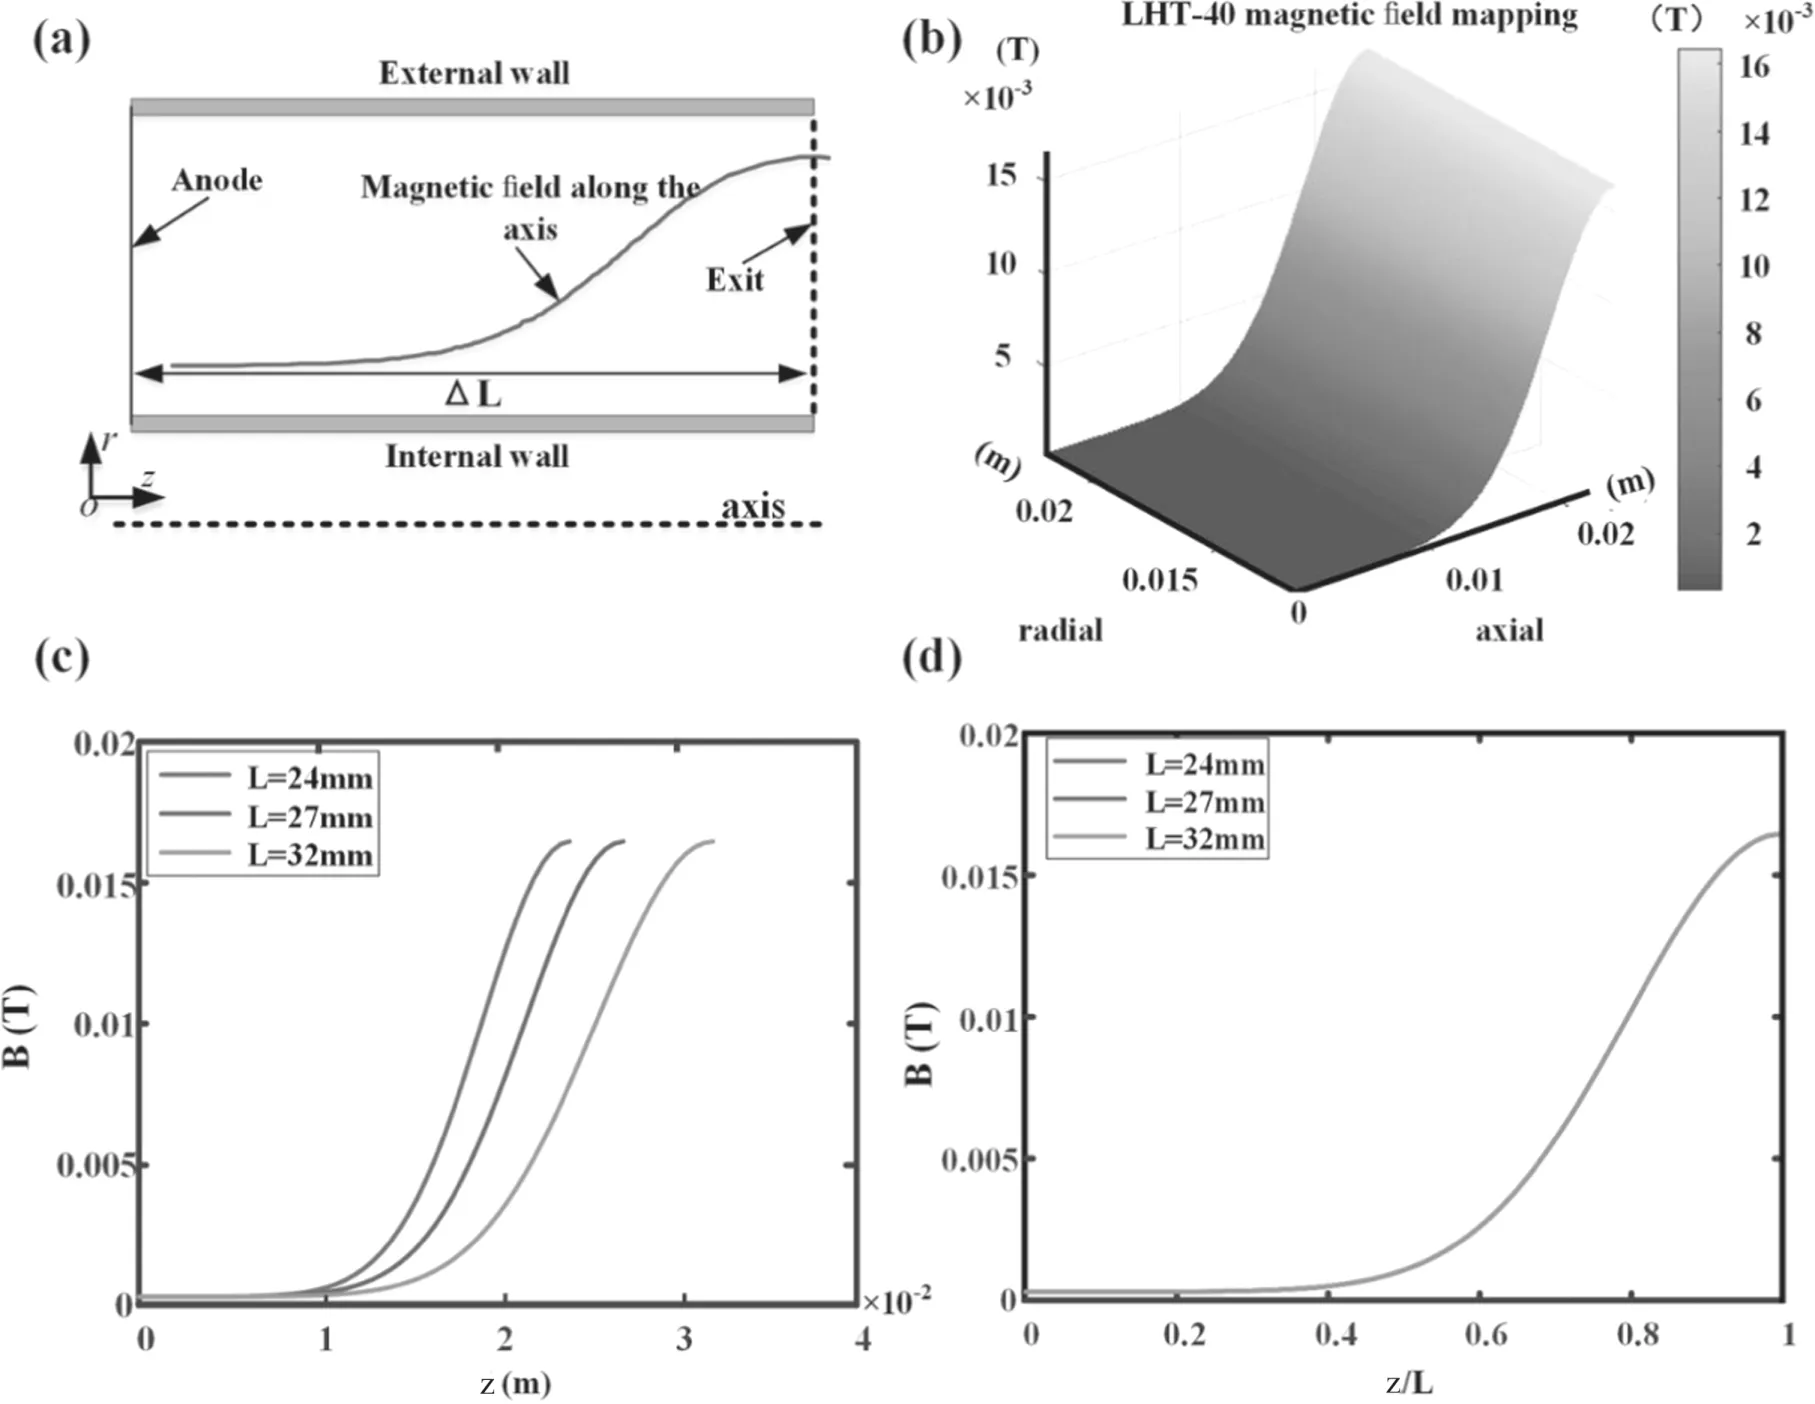
Figure 5.The diagram of the simulation area with different anode positions(a),two-dimensional magnetic field strength profile of the TDC(b)and along the discharge channel axis(c),and normalized magnetic field profile along the discharge channel axis(d).
The collisions of the particles are processed using the Monte Carlo method.When an electron collides elastically with an atom,the kinetic energy of the electron remains constant,the direction of velocity is re-distributed.When an electron collides with an atom in the course of the excitation,there is an energy loss of 8.32 eV and a random assignment of electron velocities to each homogeneous species.When the electron energy reaches a certain value,electrons and atoms occur in ionization collisions to form ions.The energy threshold for atoms undergoing primary ionization is 12.13 eV,and the trajectory of un-ionized neutral atoms remains unchanged.The ions generated by the ionization are treated as background particles and their velocity is distributed as the velocity of the background particles.
To increase the speed of convergence,the vacuum dielectric constantyis increased by a factor of 1600 and the equivalent Debye length is increased by a factor of 40,which can be estimated as approximately 1.3 mm for the expanded Debye length.As the mesh size required in the PIC simulation cannot be greater than the Debye length,0.5 mm is chosen as the axial and radial mesh size in this paper,and the time step is taken aswhereωpis the plasma cyclotron frequency.The plasma density at the beginning is l ×1018m−3,the electron temperature is 20 eV,and the anode voltage is 300 V.
3.2.2.The results of numerical simulations.In this section,the discharge properties of the LHT were investigated utilizing the numerical simulations for different anode positions of the 300 W class LHT.The physical model of the two-dimensional spatial coordinates(z,r)of the HT was established based on the axisymmetric structural characteristics of the HT discharge channel.The diagram of the simulation area with different anode positions is illustrated in figure 5(a).The two-dimensional magnetic field strength profile of the TDC and along the discharge channel axis are depicted in figures 5(b)and(c),respectively.To ensure that the magnetic field profile in the discharge channel remains unchanged when the length of the channel is varied,the normalization process is adopted in the axial direction during the calculations.The normalized magnetic field profile along the discharge channel axis is illustrated in figure 5(d).It is evident in figure 5(d)that the magnetic field strength in the TDC axis remains consistent for different anode positions.The same magnetic field distribution was employed in the calculation for different discharge channel lengths,i.e.the magnetic field increased in the axial direction and was constant in the radial direction,and the maximum magnetic field strength at the thruster exit was 165 Gs,which was consistent with the maximum value of the actual thruster product.It should be noted that the magnetic field direction of the Hall TDC is generally dominated by therdirection(providing theE×Beffect).Based on this assumption,the magnetic field direction is simplified to be a unifiedrdirection in this paper,and consequently,the distributions of the plasma parameters in the TDC at different anode positions are obtained.
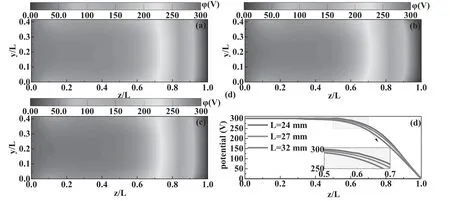
Figure 6.The potential distribution in the TDC(case 1(a),case 2(b),and case 3(c))and along the axis(d).
To reveal the influence of different anode positions on the performance variation of the thruster,and simultaneously weigh the efficiency and time of the simulation,the simulation work was carried out only for three different anode positions under the conditions of discharge voltage 300 V and AMFR 0.95 mg·s−1,instead of the whole anode flow and discharge voltage for the experiment.The condition for the simulation to stop is that the calculation reaches a steady state,and the criterion for the calculation to reach a steady-state is that the number of macro particles(ions and electrons)does not change significantly with the calculation time.
The orthogonal electromagnetic field in the TDC restrains the electrons in a circumferential,drifting motion in the area adjacent to the channel exit.The conductivity process of the electrons towards the anode determines the potential distribution in the channel.The electrical potential profiles in the TDC(case 1,case 2,and case 3)are shown in figures 6(a)–(c).The symbols a,b and c represent the operating conditions for the anode located at 24 mm,27 mm,and 32 mm with respect to the thruster outlet,respectively.The following simulation cases are defined in the same way.As shown in figure 6,the potential distributions at case 1,case 2,and case 3 are roughly identical.The potential adjacent to the anode is approximately 300 V and decreases towards the exit of the discharge channel to 0 V.The axial profile of the central potential in the TDC is illustrated in figure 6(d).From figure 6(d),it can be observed that the LHT of case 3 has the maximum change rate of the potential drop in its channel and case 1 has the minimum change rate of potential drop.
The ionization rate(IR)profiles in the TDC(case 1,case 2,and case 3)are shown in figures 7(a)–(c).The axial profile of the IR at the center of the TDC is shown in figure 7(d).It is indicated in figure 7 that the peak IR region is maximum for case 2 and minimum for case 1 at the three anode positions,and the width of the IR is significantly higher for case 2 than those for case 1 and case 3.As the anode position moves towards the channel exit,the peak IR moves towards the thruster exit and the peak IR magnitude shows a nonlinear variation.The main reason for this phenomenon is the decrease in the surface-to-volume ratio as the anode position moves towards the exit,resulting in a weaker interaction between the electrons and the wall,a decrease in the number of secondary electrons,an increase in the overall channel electron temperature and a larger ionization cross-section for collisions with atoms.The larger ionization cross-section leads to a shorter average free range of the collision,which ultimately results in a compressed ion acceleration zone and a narrower IR peak.
The IR for the xenon atoms in the TDC is predominantly determined by the electron temperature(Te),electron number density(ne),and the distribution of the IR reflects the lengthwherevaandveare the atoms and electron velocity respectively,neis the electron density andσizis the ionization cross-section)and location of the ionization zone.The axial(z)IR(si)[34]can be approximated as:
where,naandneare the atom density and electron density respectively.For the xenon propellant,β0=2.2×10⁻¹⁴m3·s−1andT*=4 eV.
In addition,it can be seen from equation(14)that the axial IR is related to the combined factors of atomic density,electron temperature,and electron density.The possible reason for the low IR in the case 1 working condition is that the discharge channel is too short resulting in a large number of atoms leaving the discharge channel without being ionized.
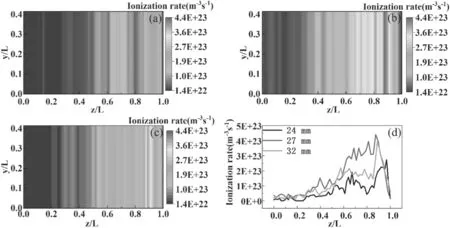
Figure 7.The IR profiles in the TDC(case 1(a),case 2(b),and case 3(c))and along the axis(d).
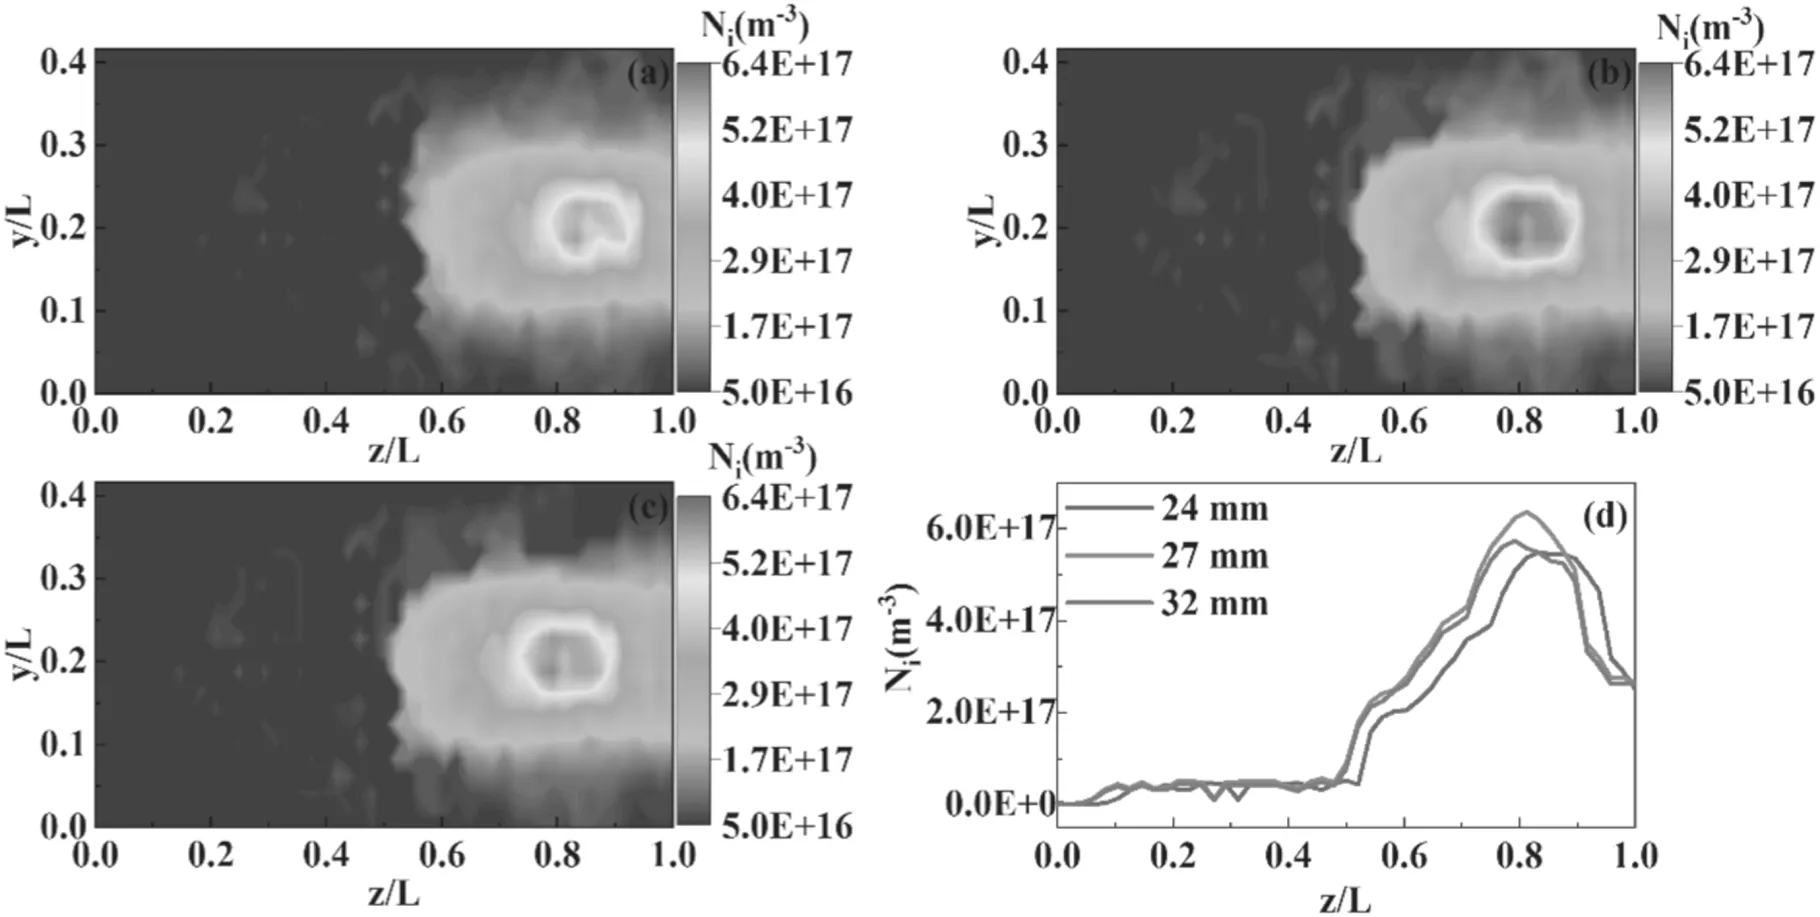
Figure 8.The ion number density(Ni)profiles in the TDC(case 1(a),case 2(b),and case 3(c))and along the axis(d).
The plasma in the HT discharge channel interacts with the walls.Different anode positions lead to changes in the energy dissipated by the collision of electrons with the wall,which in turn affects the discharge characteristics of the channel plasma.The ion number density(Ni)profiles in the TDC(case 1,case 2,and case 3)are illustrated in figures 8(a)–(c).The axial profile of the IR at the center of the TDC is illustrated in figure 8(d).It is indicated in figures 8(a)–(c)that theNiin the TDC is the maximum in the vicinity of the channel axis at different anode positions,indicating a significant ion aggregation effect.In addition,as can be seen in figure 8(d),as the anode position moves towards the discharge channel exit(case 3 to case 1),the ionization zone widens and moves towards the channel exit,resulting in a shift of the higher ion number density region at the channel centerline in the vicinity of the channel exit.The probable reason is that as the anode position in the thruster moves towards the exit(case 3 moves towards case 1),the electron-wall interaction is weakened due to the reduced surface-to-volume ratio,which reduces the near-wall conductivity,resulting in the potential drop region moving towards the channel exit and a good focusing effect of the ion beam and a lower plume divergence angle.The effect of ion concentration in the discharge channel along the axis is obvious at different anode positions,as shown in figure 8(d).The peak ion densities at the center of the discharge channel for case 2,case 3,and case 1 are the maximum,medium,and minimum,corresponding to the values of 6.3×10¹⁷m−3,5.7×1017m−3,and 5.5×10¹⁵m−3,respectively.
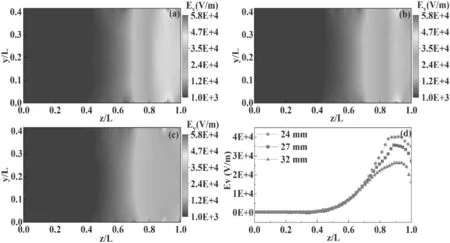
Figure 9.The axial electric field profiles in the TDC(case 1(a),case 2(b),and case 3(c))and along the axis(d).
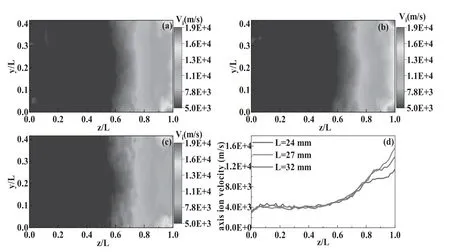
Figure 10.The axial ion velocity profiles in the TDC(case 1(a),case 2(b),and case 3(c))and along the axis(d).
The axial electric field profiles in the TDC(case 1,case 2,and case 3)are shown in figures 9(a)–(c).It is indicated in figures 9(a)–(c)that the axial electric field distributions are approximately similar for different anode positions,with the axial electric field gradually increasing from the exit of the anode position and reaching a maximum value before decreasing at the exit position.The axial electric distribution at the center of the channel is illustrated in figure 9(d).It is indicated in figure 9(d)that the axial electric field is maximum for case 3 with a value of 4.0×10⁴V·m−1and minimum for case 1 with a value of 2.7×10⁴V·m−1.
The axial ion velocity profiles in the TDC(case 1,case 2,and case 3)are illustrated in figures 10(a)–(c).It is apparent from figures 10(a)–(c)that the axial ion velocity distributions are approximately similar for different anode positions,with the axial electric field gradually increasing from the exit of the anode position and reaching a maximum value at the exit position.The axial electric distribution at the center of the channel is illustrated in figure 10(d).It is apparent from figure 10(d)that the axial electric field is maximum for case 2 with a value of 15.7 km·s−1and minimum for case 1 with a value of 11.3 km·s−1.
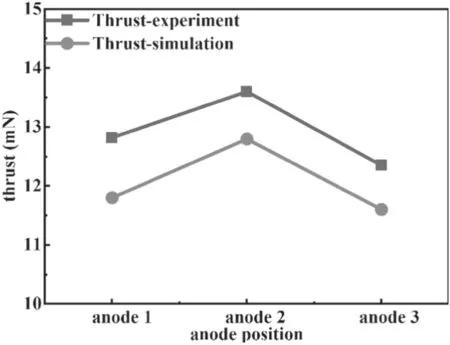
Figure 11.The comparison of experimental and simulated thrust under the conditions of discharge voltage 300 V and anode mass flow rate 0.95 mg·s−1.
To further verify the validity of the simulation results,the comparison of experimental and simulated thrust under the conditions of discharge voltage 300 V and AMFR 0.95 mg·s−1is illustrated in figure 11.As can be noticed from figure 11 that the simulated and experimental results of thrust showed identical results.In addition,the maximum error between simulation and experiment for thrust is 8.2%.The main reason for the simulated results to be smaller than the experimental results may be that the thrust of the simulation is attributed mainly to the ion flux and ion velocity in the vertical exit direction.The thrust is generated by the acceleration of the ions by the axial electric field.The magnitude of the axial electric field directly reflects the macroscopic properties of the thruster such as thrustwhereFis the thrust,qis the average ion charge,represents the xenon ion mass,andVirepresents the ion jet velocity.)and specific impulse.As compared to anode 2,the anode 3 has less thrust due to the long discharge channel and the interaction between the particles with the wall resulting in large energy loss.The anode 1 may cause the neutral atoms inside the discharge chamber to leave the discharge channel before they have fully collided with the electrons,resulting in a small ion density and a large divergence angle,which causes a large loss of thrust and a smaller thrust than the working condition of anode 2.
4.Conclusions
The goal of higher compact construction and superior performance is the perpetual pursuit of LHTs.In this study,the effect of different anode positions(ΔL= 32 mm,27 mm,24 mm)on the discharge characteristics of 300 W class LHT(LHT-40)has been investigated by employing experiments and simulation to improve parameters such as efficiency,thrust,specific impulse,etc.The conclusions are as follows:
(1)The experimental results indicated that the thruster has the most excellent performance in terms of thrust and efficiency etc at a channel length of 27 mm for identical operating conditions.
(2)In addition,PIC-MCC simulations show that the ionization and acceleration zone is pushed downwards towards the channel exit as the anode moves towards the exit.At the identical operating point,whenΔLis reduced from 32 to 27 mm,the ionization and acceleration zone moves towards the exit,and the parameters in terms of thrust and efficiency increase due to the high IR,ion number density,and axial electric field.When theΔLis further moved to 24 mm,the parameters in terms of thrust and efficiency are reduced as a result of the decreasing ionization efficiency and the larger plume divergence angle.
(3)The thruster has the most optimal performance in this case(ΔL= 27 mm).The work presented above has shown that the anode position has an essential influence on the discharge performance(such as thrust,and efficiency)of the thruster,and an appropriately short channel length of the LHT is desirable for a tighter and superior thruster performance.
Acknowledgments
The authors are grateful to National Natural Science Foundation of China(No.12005087),the Science and Technology Program of Gansu Province(Nos.2006ZCTF0054,HTKJ2019KL510003,and 20JR10RA478).
猜你喜欢
今日农业(2022年15期)2022-09-20
中国典型病例大全(2022年9期)2022-04-19
中国典型病例大全(2022年9期)2022-04-19
今日农业(2020年24期)2020-12-15
诗潮(2019年11期)2019-11-23
大众文艺(2019年3期)2019-01-24
学校教育研究(2018年1期)2018-10-21
东方女性(2016年7期)2016-10-09
扬子江诗刊(2015年3期)2015-11-14
 Plasma Science and Technology2023年1期
- Plasma Science and Technology的其它文章
- Development of miniaturized SAF-LIBS with high repetition rate acousto-optic gating for quantitative analysis
- Rotor performance enhancement by alternating current dielectric barrier discharge plasma actuation
- A nanoparticle formation model considering layered motion based on an electrical explosion experiment with Al wires
- Focused electron beam transport through a long narrow metal tube at elevated pressures in the forevacuum range
- A study of the influence of different grid structures on plasma characteristics in the discharge chamber of an ion thruster
- High-resolution x-ray monochromatic imaging for laser plasma diagnostics based on toroidal crystal