
Inversion techniques to obtain local rotation velocity and ion temperature profiles for the x-ray crystal spectrometer on EAST
2023-10-08 08:20ZichaoLIN林子超HongmingZHNG张洪明FudiWNG王福地heonhoBEJiaFU符佳YifeiJIN金仡飞DianLU卢迪安ShengyuFU傅盛宇JiankangLI李建康andBoLYU吕波
Plasma Science and Technology 2023年9期
Zichao LIN(林子超),Hongming ZHNG(张洪明),Fudi WNG(王福地),heonho BE,Jia FU(符佳),Yifei JIN(金仡飞),Di’an LU(卢迪安),Shengyu FU(傅盛宇),Jiankang LI(李建康),3 and Bo LYU(吕波),∗
1 Institute of Plasma Physics,HFIPS,Chinese Academy of Sciences,Hefei 230031,People’s Republic of China
2 Science Island Branch,Graduate School of University of Science and Technology of China,Hefei 230026,People’s Republic of China
3 School of Nuclear Science and Technology,University of South China,Hengyang 421001,People’s Republic of China
Abstract Inversion techniques are conducted based on the tangential x-ray crystal spectroscopy(TXCS)geometry on EAST to obtain the local profiles of ion temperature(Ti) and toroidal rotation velocity(vt).Firstly,local emissivity profiles of the impurity argon are obtained using the asymmetrical Abel inversion.Then,the local vt and Ti profiles are calculated by considering the local emissivity profiles and the TXCS detailed geometry.In addition,how the changes in the vt profiles affect the accuracy in the Ti profiles is discussed in detail.It is also found that the lineintegrated Ti profiles are becoming less accurate with the increase in the radial gradient in the local vt profiles.Nonetheless,accurate Ti radial profiles are reconstructed after considering the effects of the emissivity and velocity,which are verified by comparing the inverted vt and Ti profiles with those local profile measurements from the Charge eXchange Recombination Spectroscopy(CXRS) on EAST.
Keywords:plasma toroidal rotation,ion temperature,x-ray crystal spectroscopy,Abel inversion
1.Introduction
Ion temperature(Ti)and toroidal rotation velocity(vt)profiles are essential for the analysis of plasma transport and for optimization of the high-temperature operational range of tokamak plasmas.X-ray crystal spectroscopy(XCS),as one of the key diagnostics for measuring thevtandTi,has been equipped on many magnetic confinement fusion devices,including EAST[1-3].Usually,theTiprofiles measured by EAST XCS are line integrated;thus their profiles typically deviate from the true ones if no post-processing steps,such as inversion techniques,are applied [4].Therefore,application of inversion techniques is an essential step for obtaining reliable localTiandvtprofiles that are suitable for the analysis of high-performance plasma discharges.Inversion operations to obtain localvtandTiprofiles have been studied on the TFTR,Alcator C-Mod,etc [5-11].An inversion methodology ofTiandvtfor elongated tokamak plasmas has also been illustrated in[12].However,such an inversion operation has not been tested on actual experimental data on EAST.Since the hardware performances of the EAST XCS system have been well optimized in recent years,the signal quality of argon(Ar)spectra is also improved[13].Therefore,it becomes possible to conductthe profile inversion to obtain reliable local emissivity,velocity and ion temperature on EAST.The emissivity inversion,which is the prerequisite inversion step for attaining thevtandTiprofiles,has been conducted in a previous study to analyze impurity tungsten behavior[14].Based on that experience,the inversions of thevtandTiprofiles have recently been conducted in addition to the emissivity profile inversions and with the detailed geometry of the EAST XCS considered.The inverted localvtandTiprofiles are also compared to those measured by Charge eXchange Recombination Spectroscopy(CXRS) to validate the inversion technique applied to EAST XCS data [15-17].In this paper,the applied inversion method is briefly introduced in section 2,and the detailed geometry of the EAST XCS system is illustrated in section 3.Then,the line-integrated andvteffects onTiprofiles are discussed in section 4.The inverted profiles ofvtandTion EAST are presented in section 5 and compared with the well-calibrated CXRS data.Finally,this study is summarized in section 6.
2.Methods of XCS inversion techniques
As mentioned above,the line-integrated spectra that carry the emissivity strength,Doppler shift and Doppler broadening information are the basis of the XCS measurements.Therefore,the methods of non-circular cross-section Abel inversion(which is usually used to invert the line-integrated profiles)to obtain the local radial profiles of emissivity,rotation velocity and ion temperature with the spectra are illustrated in this section.
2.1.Emissivity inversion
Obtaining inverted emissivity profiles is a prerequisite for the velocity and ion temperature inversions.As illustrated in detail in [18],the basic principle of non-circular Abel inversion is to divide the plasma cross-section into several radial zones with the same emissivityEj,and the line-integrated brightness of each chord can be expressed asBi.These two parameters are related by a length matrixLij,as shown in equations(1) and(2),calculated along the path length of theith observation chord through thejth zone,which illustrates the key process of the Abel inversion.
whereLij-1is the inverted length matrix.After obtaining the local emissivityEjillustrated above,the inversion of the velocity and the ion temperature can now be conducted.
2.2.Velocity inversion
The inversions of velocity and ion temperature are more complicated than the emissivity inversion.For theTiandvtinversions,a Gaussian spectral emission profile in each emission zone is assumed,
Here,λ0is the unshifted wavelength,cis the light speed,kis the Boltzmann constant,mis the mass of the ion,is the unit vector in the direction of theith observation sightline andυjis the rotation velocity vector.The dot products ofandυjrepresent the differences between the true velocity and the line-integrated ones.The local wavelength shiftδλijcan be obtained by integrating over the first moment of the spectral emissivity and normalizing it with the total emissivity,
where υj=∣υ j∣is the jth zone’s scalar velocity,andθijis the angle between the sightline and the velocity directions.The relationship between the measured line-integrated velocity(ui) and local velocity(υj) is given by,
Then,the local velocity can be expressed as,
whereMijis defined as,
Considering that the velocity is the sum of the toroidal and poloidal components but the poloidal rotation velocity is usually smaller than the toroidal component in general discharges,the poloidal rotation velocity can be neglected [12].Typically,the poloidal velocities are around 10 km s-1and the toroidal velocities are more than tens of km s-1.Therefore,the errors in the toroidal velocities caused by neglecting the poloidal rotations depend on the ratio of the poloidal to the toroidal velocities,which are usually no more than 10%(without considering the pseudo rotation effects [19]).If the pseudo effects exist,the inverted toroidal velocity will be smaller than its real values,which will make the errors increase.If more accurate toroidal velocity results are needed,the average of measured velocities from the upper and lowersightlines can be used to eliminate the effects of poloidal components.Then,the toroidal velocity can be further updated as,
whereuiupanduidownare the measured velocities from the upper and lower sightlines,respectively.
2.3.Ion temperature inversion
The inversion technique used to obtain ion temperature measurement is based on the measured FWHM(ωj).Integrating over the second moment of the spectral emissivity from equation(3) yields,
Also,the line-integrated second moment can be used to obtain the line-integrated ion temperature,
whereTiis the line-integrated ion temperature observed at theith observation chord.The second term on the right-hand side shows how the velocity differences between different emission zones affect the ion temperature profile.However,it should be noted that the radial velocity has not been taken into account here and,as a result,the calculated error may potentially be greater than what was estimated in the error analysis presented in section 5.
3.XCS geometry on EAST
The XCS system on EAST consists of two subsystems: a tangential x-ray crystal spectrometer(TXCS) and a poloidal x-ray crystal spectrometer.In this study,only the measured data from the TXCS are used for the inversion techniques.The TXCS is installed on the #G horizontal port of EAST,and the angle between the TXCS sightline and the magnetic axis is about 60.5° in the horizontal plane.One single spectral crystal(quartz 011,2d=4.913 Å)with a curvature radius of 3750 mm and an effective area of 80×80 mm2is placed at the location where its major radius isR=10.95 m and its vertical position is atZ=0 m.A PILATUS 900 K detector consisting of nine sub-modules is used to record the spectra.Each module of the detector consists of 487×195 pixels with each pixel size of 172×172μm2.With this large size detector,the vertical spatial observation range covers fromZ=0.4 to-0.4 m of the EAST plasma crosssections.The spatial resolution can be as low as 0.542 mm,and the time resolution can be as good as 0.01 s.In cases with weak signals,the pixels are always combined along the vertical direction to improve the signal intensity.TheTiandvtare calculated by the Doppler broadening(mainly contributed by thermal velocity) and the Doppler shift(mainly contributed by the rotation velocities) of the Ar XVII(3.9494 Å) line spectra.The broadening caused by Zeeman splitting is neglected during the calculation,since it is several orders of magnitude smaller than the observed Doppler broadening at the typical magnetic field strength in EAST.During the discharges,Ar gas is always actively injected to the EAST plasmas through a horizontal #J port gas puffing system to obtain sufficient Ar emissions.Figure 1 shows the spectra measured by the TXCS during the EAST #115199 discharge; the curved spectra are caused by the focusing properties of the spherical crystal.The Ar w-line is the aforementioned line spectra of Ar XVII(3.9494 Å),which is used to calculate the rotation velocities and ion temperatures.These spectra are taken by the TXCS detector with an exposure time oft=0.2 s.The line-integrated profile of the spectra intensity is also presented for the vertical range of-40 cm≤Z≤40 cm.
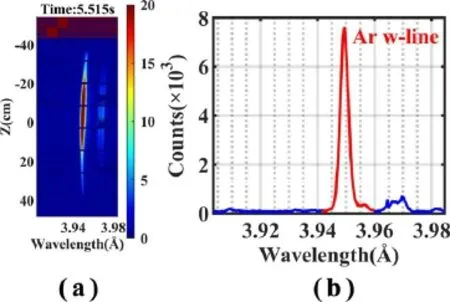
Figure 1.(a) A typical spectra recorded by the TXCS detector in EAST,which contains nine sub-modules covering the EAST vertical range of-40 cm≤Z≤40 cm.(b)The measured fifth sub-module spectra data with an obvious Ar w-line.
To apply the aforementioned inversion techniques,the crucial step is to obtain the length and angle matricesLijandMijin equation(11).In doing so,it is necessary to consider the realistic geometry of the TXCS sightlines for high accuracy in the resulting velocity and temperature profiles.Figure 2(a) shows the top view of the realistic geometry of the TXCS sightline(in red) at the midplane,and the magnetic surfaces(which are assumed to be toroidally symmetric) of EAST plasmas in blue lines.Therefore,thelength and angle matrices can be expressed as follows,
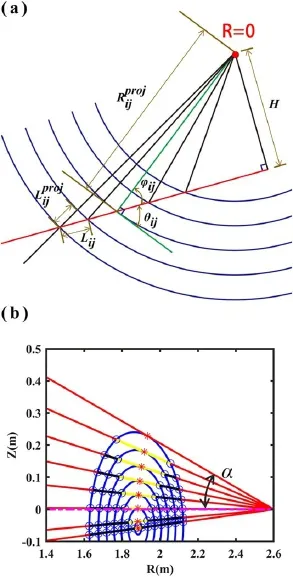
Figure 2.(a) The detailed geometry top-view profile used for the inversion technique.(b) The projection of the length matrix on the basis of EFIT information; the intersection of all the lines of the sightlines is not the real crystal position for illustration convenience.

Figure 3.The results of the simulation(real) profiles and lineintegrated profiles for(a) the emissivity,(b) the velocity and(c) the ion temperature based on the method illustrated above.
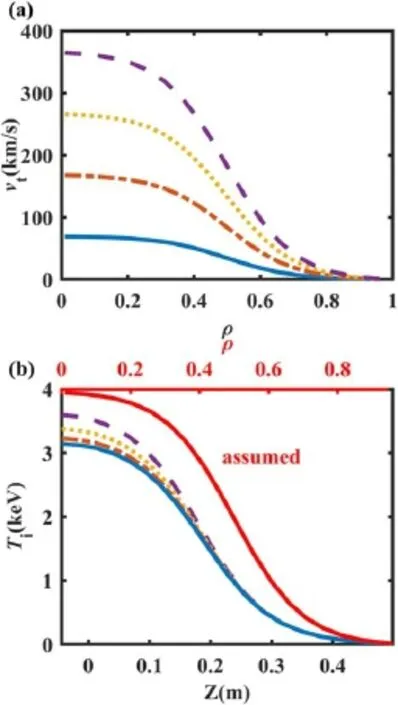
Figure 4.(a) The assumed different velocity profiles.(b) The lineintegrated effects with different velocity profiles on ion temperature profiles; the red line in(b) is the true profile of the ion temperature.
whereHis the vertical distance from the device center to the sightline on the midplane that can be calculated by the angle mentioned earlier,Lijis the chord length calculated according to the projectiongenerated by EFIT [20],φis the angle between the major radius and the sightline,θis the angle between the sightline and the toroidal velocity direction tangent to the magnetic surface andαis the angle between the projection of the sightline in the poloidal and horizontal plane(pink dashed line),as illustrated in detail in figure 2(b).In addition,the red lines are the poloidal crosssection sightlines,which correspond to the red line in figure 2(a).The sightlines are chosen to be tangent to the magnetic surfaces at locations indicated with the red asterisks for convenience.Theis calculated along the path length of theith observation chord through thejth zone,indicated with the yellow and black lines in figure 2(b).
4.Simulations of effects on the ion temperature profiles
Since the absolute calibration of the TXCS-measured velocities is currently not available at EAST,we focus on ion temperature profile measurements as the key aspect,unless there are other elements significantly affecting the velocities.Previously,it is mentioned that the line-integrated profiles will deviate from the local true profiles.Besides,according to equation(11),it is obvious that the velocity terms are coupled with the ion temperatures terms.Thus,in this section,lineintegration and velocity effects on the ion temperature radial profiles are simulated.
4.1.Effects of line-integration
To verify the line-integration effects on emissivity,rotation velocity and ion temperature profiles,a tanh-shape distribution of the local profiles can be assumed,as in equation(15),to conduct the simulations,as in [21],
One typical plasma geometry data of EAST #115199 att=4.8 s is applied during the simulation.The results of lineintegration and inversion are shown in figure 3 with all calculated emission,vt,andTiprofiles presented.The assumed local profiles(red solid lines),which are also the true radial profiles,are integrated along each observation chord(to restore the TXCS direct measurement results) to obtain the line-integrated profile(blue dotted lines) of the emission,vtandTiprofiles.The line-integrated profiles are in the coordinateZ(blue axis at the top),which is simply mapped to the coordinateρ(red axis at the bottom) corresponding to the magnetic flux provided by EFIT.Since the quantities are assumed to be uniform within each magnetic flux surface,only the sightlines located above the magnetic axis were considered in this analysis.It is obvious that all of the lineintegrated profiles deviate from the assumed(true) profiles,and the absolute values of the line-integrated results are smaller than the assumed(true) values.It is notable that although only the tanh-shape profile is discussed here,different radial profile shapes will have different line-integrated profiles,and they will always deviate from the true profiles.
The details of the line-integration effects of the toroidal rotation velocityvton theTiprofile are demonstrated in figure 4.To investigate the effects ofvton the line-integratedTiprofiles,four different velocity profiles are selected.Theresults show that increasingvtleads to greater line-integratedTiprofiles.
Figure 5 shows the ratio between the line-integratedTi(LineIntegrated)and the assumedTi(Assumed)for a range of typical toroidal velocities in tokamaks when no inversion techniques are applied.In the low-velocity range(<100 km s-1),approximately 20% reduction(~0.8 ratio) in the line-averagedTiis expected from the true values and approximately equal to the assumed value near 250 km s-1,without applying the inversion techniques.This interpretation can also be translated to the core and edge radial gradients of tokamak plasmas since the core velocities are much higher than those in the edge.Therefore,it can be generalized that different velocity gradients produce varying effects on the line-integrated ion temperature profile.

Figure 5.The relation between the core velocity value and the differences between the line-integrated and real ion temperature.

Figure 6.(a)The assumed velocity profiles.(b)The inversion results after ignoring the velocity term in the ion temperature inversion operation using according to the profiles in(a).
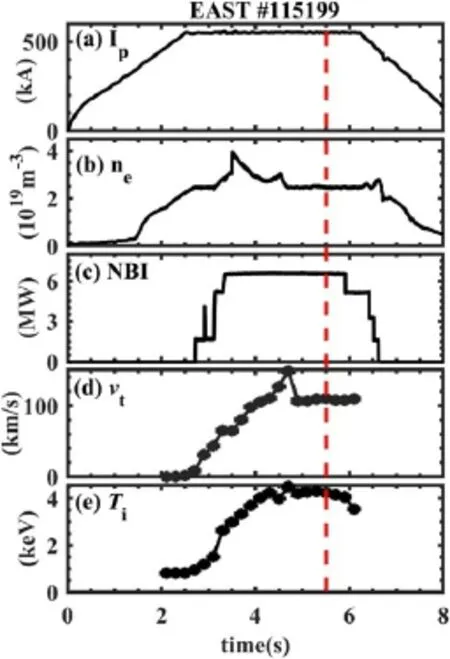
Figure 7.Time evolutions of(a)plasma current,(b)electron density,(c)NBI power,(d)toroidal velocity and(e)ion temperature of EAST#115199.
4.2.Effects of absolute velocity and velocity gradient
Since the absolute velocity calibration is currently not available for EAST TXCS,it is necessary to further study the effects of the absolute value and radial gradients of the velocity profiles on the accuracy of the obtained local profiles.For this purpose,a set of comparisons between different velocity profiles without considering the second term in equation(11) during the inversion operation is shown in figure 6.The line styles and colors correspond in figures 6(a)and(b).It is shown that the inverted profiles(in dot-dashed yellow and dashed crimson) deviate significantly from the true profile(in red crosses) in figure 6(b).Conversely,the other two(in solid blue and dotted cyan) are much closer to the assumed profile.It should be noted that the blue line overlaps with the red true profile,thus lies underneath the true red plus profiles in figure 6(b).The main difference between these two different groups being compared is in their radial velocity gradients.The effect of velocity magnitudes can also be investigated by comparing the dot-dashed yellow and dotted crimson lines or solid blue and dotted cyan lines,and it is much less than that of the velocity gradient effect.The slight differences between these two groups’ profiles are caused by the difference in the velocity term in equation(11).From a practical perspective,since the absolute wavelength is not well calibrated for the EAST XCS at present,it is still difficult to provide the absolute values of the rotation velocities.However,as aforementioned,when the velocity gradient of the profile is small enough,it is acceptable to neglect the second term during the calculation process.Specifically,when applying inversion techniques to plasmas,obtainingvelocity profiles with accurate radial gradients is more crucial than calibrating their absolute magnitudes.
5.TXCS inversion operations on EAST
The EAST discharge(#115199) is chosen for the inversion application in this study because of its high ion temperature.The discharge waveform of this shot is shown in figure 7.As the EAST neutral beam injections(NBIs) typically introduce large gradients in the velocity profiles,this shot is a good example where the second term in equation(11)should not be neglected.
Figure 8 shows the raw TXCS-measuredvtandTiprofiles of shot #115199 att=5.5 s before any inversion techniques are applied.It should be noted that thevthere is approximately obtained by dividing the rough line-integrated data by cos(60.5°),where 60.5°represents the angle between the sightlines and magnetic axis.Furthermore,the ion temperature on the edge is set to be 0.5 keV according to the CXRS measurement.As mentioned above,the absolute velocity calibrations of TXCS measurements are currently not available;the velocity in figure 8 is obtained by comparing the wavelength shift before the NBI injection(att=2.0 s) because the co-NBI(co-direction with toroidal rotation) provides an enormous momentum input to accelerate the toroidal velocity [22].If these measurements are converted into their respective radial profiles,the maxvtin the core range is expected to be ~115 km s-1and the maxTinear 4.2 keV.Abel inversion techniques are applied to theTXCS-measured profiles to yield their respective radial profiles,as presented in figure 9.The invertedvtprofile is averaged according to equation(9),and theTiprofile is also averaged by the results from the upper and lower profiles.As a result,the accuracy in the TXCS-measured velocity gradients has significantly improved,which is important because many tokamak discharge analyses are based on reliable velocity gradients,although their absolute calibrations may not be available.With the availability of the CXRS measurement,the TXCS velocity profiles can be adjusted to match the CXRS profiles by matching the CXRS edge velocity,as shown in figure 9(a).It is shown that the maxvtin the core range,with the inversion techniques applied and calibrated with the CXRS edge data,has been calibrated to be near 150 km s-1,which introduces about 35 km s-1differences in the magnitude ofv.t A similar difference can also be observed forTi,where its max value at near 4.2 keV before the inversion is re-calculated to about 5 keV.
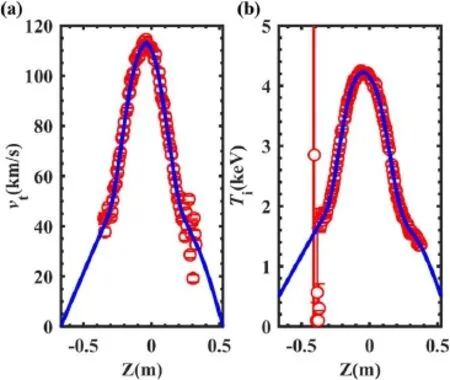
Figure 8.The measured(a) toroidal velocity profile and(b) ion temperature profile by TXCS;the red dots are measured data,and the blue lines are fitted profiles by smoothing splines.
The error in the inversion techniques is analyzed according to the error propagation theory,and the relative error of velocity can be expressed as,
where the relative error of theuiis ~10%,and theθis calculated by the EFIT magnetic surface information and causes a ~5% margin of error,which yields the final accumulated error of about 11.2% for the velocity inversion.With regard to the ion temperature,the relative error is expressed as,
where the relative errorof theTiis ~10% andthe absence of any other quantity is because they could be neglected sinceisa small amount compared to their relative errors.According to the above data,the final accumulated error is at about 10% for the ion temperature inversion.
Therefore,the Abel inversion techniques applied to the radialvtandTiprofiles measured by EAST XCS have shown significant improvements in their corresponding final profiles.
6.Summary
The inversion techniques have been applied to increase the accuracy in the obtained localvtandTiprofiles from the lineintegrated profiles measured by TXCS on EAST.To test the performance of the Abel inversion method,simulations based on a set of assumed profiles are performed in this study and introduced in this article.It is also verified that the inverted results are sensitive to the accuracy of the velocity gradients but much less sensitive to the accuracy of the velocity magnitudes.To demonstrate this inversion method with actual experimental data,the line-integrated profiles ofvtandTimeasured by TXCS from EAST shot # 115199 have been used to apply the inversion operations to obtain the localvtandTiprofiles.Furthermore,the comparison between the inverted profiles and those from the CXRS measurement show good qualitative agreement,which also demonstrates the reliable accuracy of the inversion method applied in this study.Therefore,the Abel inversion technique is expected to assist when cross-checking the accuracy of CXRS and XCS data in future EAST experiments.Besides,the localvtandTiprofiles can also be provided in those situations where the CXRS is not available with no NBI injections.
The obtained localvtandTiprofiles can be used to evaluate the plasma performance in the next EAST campaign.The obtained local profiles will also be used to study the related momentum transport in EAST.
Acknowledgments
The authors wish to thank the EAST team.The work is partially supported by National Natural Science Foundation of China(Nos.12175278 and 12205072),the Comprehensive Research Facility for Fusion Technology Program of China(No.2018-000052-73-01-001228),Major Science and Technology Infrastructure Maintenance and Reconstruction Projects of the Chinese Academy of Sciences(2021),the University Synergy Innovation Program of Anhui Province(No.GXXT-2021-029),Anhui Provincial Key Research and Development Project(No.202104a06020021),Open Fund of the Magnetic Confinement Fusion Laboratory of Anhui Province(No.2021AMF01002),and the National Magnetic Confinement Fusion Science Program of China(Nos.2019YFE03040000 and 2018YFE0303103).
ORCID iDs
猜你喜欢
历史教学问题(2022年1期)2022-07-28
音乐天地(音乐创作版)(2022年12期)2022-04-04
杭州师范大学学报(社会科学版)(2021年5期)2021-11-01
矿产勘查(2020年6期)2020-12-25
华人时刊(2020年15期)2020-12-14
学生天地(2020年3期)2020-08-25
鸭绿江·下半月(2020年2期)2020-04-07
幸福家庭(2019年14期)2019-01-06
中国粮食经济(2018年8期)2018-01-01
新青年(2017年11期)2017-11-23
 Plasma Science and Technology2023年9期
- Plasma Science and Technology的其它文章
- Plasma-activated hydrogel: fabrication,functionalization,and effective biological model
- Propagation of surface magnetoplasmon polaritons in a symmetric waveguide with two-dimensional electron gas
- Investigation of electron cyclotron wave absorption and current drive in CFETR hybrid scenario plasmas
- Impact of resonant magnetic perturbation on blob motion and structure using a gas puff imaging diagnostic on the HL-2A tokamak
- Comparison of methods for turbulence Doppler frequency shift calculation in Doppler reflectometer
- Invariant manifold growth formula in cylindrical coordinates and its application for magnetically confined fusion